Article

Association of Morphological, Ecological, and Genetic Diversity of Aerva javanica Populations Growing in the Eastern Desert of Egypt

1
Botany and Microbiology Department, Faculty of Science, South Valley University, 83523 Qena, Egypt
2
Botany and Microbiology Department, Faculty of Science, Assiut University, 71516 Assiut, Egypt
3
Botany Department, Faculty of Science, Mansoura University, 35511 Mansoura, Egypt
*
Author to whom correspondence should be addressed.
Agronomy 2020, 10(3), 402; https://doi.org/10.3390/agronomy10030402
Submission received: 21 January 2020 / Revised: 10 March 2020 / Accepted: 10 March 2020 / Published: 16 March 2020

Abstract

:
Aerva javanica is one of Egypt’s most important traditional medicinal plants used as antidiarrheal and anthelmintic medicine and recently as an anticancer agent. In this study, variations among ten populations of Aerva javanica in different sites in the Eastern Desert of Egypt were analyzed based on morphological and ecological attributes and molecular variation expressed by Inter-Simple Sequence Repeat (ISSR) markers. Morphological diversity was higher for populations in the Wadi El-Markh and Bir Abbady regions than others. The polymorphism revealed by ten ISSR primers was 79.4% among populations. Distance trees created using the results obtained from soil variables, morphological characterizations, and molecular data showed that the highest similarity was 0.974 between Populations 8 and 9, while the lowest similarity was 0.715 between Population 1 and Population 3 regions. In conclusion, the obtained data are important to design a plan for sustainable conservation of Aerva javanica as an important medicinal plant having a wide interspecific genetic variability within various populations.

1. Introduction

Aerva javanica (Burm.f.) Juss. ex Schult (Amaranthaceae) is a grey permanent tomentose woolly shrub, growing spread out the remote areas of the world [1]. In Egypt, there are two species of Aerva (A. lanata (L.) Juss. ex Schult and A. javanica (Burm.f.) Juss. ex Schult). It is differentiated into two varieties (var. bovei and var. javanica). In Egypt, Aerva javanica grows in the Eastern Desert, the Red Sea coastal strip, Gebel Elba and the surrounding mountainous region, Uweinat, the entire Sinai, Siwa, Farafra, Bahariya, Kharga, Dakhla, and Kurkur. It blooms from January to May and mainly plays an important role in the dune stabilization and helps the primary revegetation of deteriorated lands. Aerva javanica has an erect rigid branched stem to a height of 1.6 m. The pale green leaves, which are 20–40 mm long, are alternate, lanceolate, oblong-ovate or suborbicular, subsessile, or shortly petiolate and have matted hair covering, the upper surface with a grayish aspect [2]. The inflorescence is typically a bare white woody raceme with thick sessile pikes. The flowers are white-creamy and very small. Fruits immersed in silky white fleece are globular, single small black seeds. The densely woolly parts of the inflorescence were utilized by Bedouins in previous times for cushions and padding saddle pads as described by Boulos [3]. Various Aerva species are usually utilized in a popular medicine system against various sicknesses. For example, the roots mash of A. javanica is used straight on the face to treat acne [4] and very recently as an anticancer agent [5]. The roots and flowers of Aerva have medicinal properties in curing rheumatism and renal diseases and in healing toothache [6].
Aerva javanica is characterized by somatic chromosomal numbers of 2n = 32, 2n = 34, and 2n = 64 and showed variation in the morphological characteristics, including differences in SEM indumentum and seed coat sculpture of plants collected from different regions [2,7]. The ecophysiological properties of Aerva javanica in two tributaries of Wadi Qena (Wadi El-Atrash and Wadi El-Ghuza) in the Egyptian Eastern Desert revealed that chlorophyll contents, soluble sugars, and soluble proteins increased during summer while total free amino acids were higher during winter. Close relationships were found between the high K, Ca, and Cl contents and the hot-dry conditions predominating in the summer season [8].
The Eastern Desert of Egypt occupies the area protraction from the Nile Valley eastward to the Gulf of Suez and the Red Sea. It is crossed by several wadis extending to the Red Sea or to the Nile Valley. Studies regarding the vegetation in relation to various ecological characters proved that soil factors were important in this relationship, and it can affect the diversity of wild plant communities [9,10,11].
A correlation of soil properties and vegetation characteristics was determined in different studies in large areas indicating remarkable gradient pointing to soil properties [12,13]. Few studies have been made on the effect of edaphic factors and the structure of vegetation in semiarid environments and focused mainly on the preponderance of the physical characters of the soil [8,14,15].
Genetic diversity is extremely relevant to the keeping of endangered species [16]. Genetic molecular markers have been widely used for the characterization of medicinally important plant species [17,18,19]. For species without sequenced genomes, Inter-Simple Sequence Repeat (ISSR) markers are a suitable choice for studying genetic diversity because they are abundant, reproducible, highly polymorphic, informative, and simple to use. In ISSRs, the di- and tri-nucleotide repeat types of microsatellites are specifically targeted, because these are widespread in the nuclear genome. ISSR locus heritability has demonstrated an exceedingly close approximation to classic Mendelian ratios, and thus ISSR markers are considered dominant markers and consequently effectively act as bi-allelic loci [20,21]. The ISSR markers are usually applied in studies of genetic diversity and population genetic studies because of their frequency and the high degree of polymorphism between individuals within a population of close genotypes [22].
Geographic and local ecological differences are considered to have an impact on the genetic diversity of the plant populations. The association between morphological and random amplified polymorphic DNA (RAPD) fingerprinting was applied to Artemisia judaica and Artemisia monosperma, and the results suggested the transfer of A. herba alba to the genus Seriphidium of Artemisia [23]. In Egypt, the populations of Achillea fragrantissima growing in the mountains of Sinai were obviously featured from other populations growing at decreased altitudes depending on the morphological varieties and ISSR polymorphism [24]. The genetic differences of Citrullus colocynthis in the Eastern Desert of Egypt as detected by morphological and ISSR polymorphism were addressed by Badr et al. [25].
In the Eastern Desert of Egypt, 328 species were registered at 500 sites between 30°06’ and 24°00’ N [26], the dominance and diversity of plant communities were distinct in longitudinal and transverse directions, and the species of the southern part of the Eastern Desert of Egypt were more influenced by the Sudanian and Irano-Turanian elements than those growing in the northern, eastern, and western parts. The relationship between soil variables and vegetation was estimated by canonical correspondence analysis (CCA) using 18 soil factors and showed that some minerals (sodium and chlorides), clay, silt, fine sand, coarse sand, and gravel were the major soil variables influencing the distribution of plant communities in the Red Sea coastal wadis [11].
In view of the medicinal importance of Aerva javanica, the aim of this research is to study the association between genetic diversity of ten A. javanica populations using ISSR markers and morphological characters in relation to ecological features of the plant growing site.

2. Materials and Methods

2.1. The Study Area and Plant Material

Ten populations (Pop) of A. javanica (Figure 1) were studied in the Eastern Desert of Egypt (between 28°11′ and 25°5′ E longitudes and 33°46′ and 32°55′ N latitudes). The altitudes of the collection stands ranged from 94 to 537 meters above sea level and extend from Ras Garib on the coast of the Gulf of Suez in the North to Aswan and Wadi Abbady in the South (Figure 1). Morphological specimens of plants were collected from their natural habitats as mature flowering plants (Figure 2). Voucher specimens have been deposited at the herbarium of the Botany and Microbiology Department, Faculty of Science, South Valley University, Qena, Egypt. A detailed description of the morphological characters of at least three plants of each population was scored depending on the careful examination of six quantitative morphological traits. The average value of each quantitative trait ± standard deviation was calculated. The measurements of the quantitative traits were coded for data analysis.

2.2. Soil Sampling and Analysis

Three soil samples were collected from the A. javanica root area (about 50 cm depth) and placed in plastic bags for the physical and chemical analyses. The soil texture was estimated by utilizing the sieve method; the amount of each soil fraction (sand, silt, and clay) was expressed as a percentage of the main weight used [27]. The soil moisture content of the soil samples was estimated as a percentage of oven-dry weight. The percentage of organic matter (OM) was estimated by ignition at 600 °C for 3 h [28]. Soil-water extracts (1:5 weights to volume) were prepared for the estimation of total soluble salts (TDS), pH, and ionic components. Calcium and magnesium estimations were carried out by titration versus 0.01 N EDTA, while sodium and potassium were estimated by utilizing the flame photometer [29]. Available phosphorus (PO4) was estimated calorimetrically according to [30]. In the meantime, the content of chloride in the dry soil was estimated by titration versus 0.01 N AgNO3 according to [29].

2.3. DNA Extraction and ISSR-PCR Analysis

For each population, a single sample of DNA was produced from young leaves. DNA extraction and purification were carried using DNeasy Kit (Qiagen) according to the manufacturer requirement. To estimate DNA concentration, run 2 µL of the parent DNA sample on 1% agarose gel in comparison to 10 µL of a DNA size marker; then compare the degree of fluorescence of the DNA sample with the different bands in DNA size marker. A set of 10 ISSR primers (Table 1) was used in the detection of polymorphism. The expansion reaction was accomplished in 25 μL reaction volume containing 1X PCR buffer, 1.5 mM MgCl2, 0.2 mM dNTPs, 1 μM primer, 1 U Taq DNA polymerase, and 30 ng template DNA. PCR amplification was performed in a Perkin-Elmer/GeneAmp® PCR System 9700 (PE Applied Biosystems, Perkin-Elmer, Norwalk CT, USA) programmed to fulfill 35 cycles after an initial denaturation cycle for 5 min at 94 °C. Each cycle consisted of a denaturation step at 94 °C for 1 min, an annealing step at 45 °C for 1 min, and an elongation step at 72 °C for 1.5 min. The primer extension segment was extended to 7 min at 72 °C in the final cycle. The PCR products were separated by electrophoresis using a 2% agarose gel and photographed using a Gel Documentation System (BIO-RAD 2000). Lambda DNA Hind III digest ΦX174/HaeIII digests were used as DNA markers.

2.4. Statistical Analysis

Analysis of variance (ANOVA) of the morphological traits was carried out on the basis of the factorial design using SPSS version 19 [31].
The banding patterns generated by ISSR marker analyses were compared to determine the genetic relatedness of the samples under study. Clear and distinct amplification products were scored as ‘1’ for presence and ‘0’ for absence of bands. Bands of the same mobility were scored as identical. The similarity matrix, in addition to the cluster analysis, using Pearson correlation coefficient, Ward minimum variance method, and biplot mapping was estimated to generate the possible relationships among populations by using the SYSTAT version 7.0 program [32]. Principal coordinates analysis (PCoA) was used as an ordination method [33]. Canonical correspondence analysis (CCA) was performed to estimate the association between plant traits and determine soil variables in the various sites. The variables in the CCA biplot were shown by arrows referring to the direction of maximum variation, with their length proportional to the rate of change [34]. A Monte Carlo permutation test (499 permutations) [35] was used to test for significance of the eigenvalues of the first canonical axis. Prior to analysis, all variables were examined for normality, and conversions were accomplished when essential. Five plant traits were included: leaf index (LI), leaf width (LW), plant height (PH), plant diameter (PD), and inflorescence length (IL). The best seven included soil variables were: moisture content, fine sand (FS), silt, clay, chlorides (Cl), phosphates (PO4), and magnesium (Mg).

3. Results

The data given in Table 2 show substantial variation in the morphological traits among the A. javanica populations (Pop) in the study sites of the Eastern Desert of Egypt. The highest plant height was recorded in Pop 10 followed by Pop 7 and Pop 9 from Wadi Abbady (Idfu-Mrsa Allam Road), as 150 * ± 5.0 cm in Pop 10 and 120 * ± 5.0 cm in populations 7 and 9. In the meantime, the lowest plant diameter was recorded in Pop 3 (67.7 * ± 4.0 cm), and it reached 280 * ± 6.0 cm in Pop 6. Leaf length and width values indicated that plants of Pop 8 from Wadi Abbady (Idfu-Mrsa Allam Road) have the highest value of 2.82 * ± 0.1 cm and 7.2 * ± 0.4 mm, respectively, while the lowest leaf length value of 1.39 * ± 0.1 cm was recorded in Pop 4 from Qeft-Qusseir Road and the lowest leaf width value of 4.4 * ± 0.5 mm was recorded in Pop 9 from Wadi Abbady (Idfu-Mrsa Allam Road). Leaf index (leaf length/leaf width) values seemed close to each other, as it ranged between 2.17 * ± 0.02 in Pop 4 from Qeft-Qusseir Road to 4.09 * ± 0.15 in pop 10 from Wadi Abbady (Idfu-Mrsa Allam Road). Inflorescence length ranged from 1.69 * ± 0.2 cm in Pop 7 to 4.57 * ± 0.3 cm in Pop 4 from Qeft- Qusseir Road. Cluster analysis based on morphological variations revealed that there are two groups: first group separated at 40.00 includes populations (7–10), while the second group includes the other six populations (1–6) as shown in Figure 3A.

3.1. Genetic Diversity among Aerva javanica Populations based on ISSR Fingerprinting

Ten ISSR primers were used for amplification of the genomic DNA of Aerva javanica populations’ generated polymorphic bands, monomorphic bands, and percentage of polymorphism (Table 1 and Figure 4). Under the application of these ten primers, 113 total amplified bands were generated. Seventy-six of them were polymorphic (67.3%), 20 were monomorphic bands (17.7%), and 17 were unique bands (15%). The number of bands per primers ranged from five using ISSR-18 primer to 20 bands using ISSR-4 primer. Primers ISSR-4 or ISSR-5 gave the highest numbers of polymorphic ISSR fragments. The percentage of polymorphism ranged from 40% when ISSR-18 was used to 100% using ISSR-1 and ISSR-4 primers with an average of 79.4%.
Cluster tree based upon UPGMA analysis of Aerva javanica populations which illustrates the genetic diversity based on ISSR fingerprinting is shown in Figure 3B. The cluster tree was separated at 75.412 into two groups; the first group separated into two subgroups at 32.344; the first subgroup contains Pop 1 and Pop 2, the second subgroup contains populations 3–6. The large second cluster includes populations 7–10 that have the same geographical location, Idfu-Mrsa Allam Road Wadi Abbady, divided into two subgroups; the first subgroup includes Pop7 and Pop10, while the second subgroup includes Pop 8 and Pop 9 (Figure 3B).

3.2. Principal Coordinate Analysis (PCoA)

The PCoA was performed to find the association of the different populations based on ISSR polymorphism (Figure 5). The ten populations were distributed along the first two axes. Results showed three groups; the first one contains populations 1 and 2, while populations 3, 4, 5, and 6 were grouped together in the second group. The third group included the remaining populations from 7 to 10. These results agree with the cluster of ISSR polymorphism (Figure 3B), which confirms the possible relationship between the ten populations and separates them into three groups.

3.3. Soil Analysis

The mechanical soil analysis (Table 3) showed the predominance of fine sand and gravel among the other soil-particle components in site 1, site 6, and site 7. Fine sand percentages varied between sites and ranged from 44% in site 6 to 58.2% in site 1, while gravel ranged between 22.70% in site 7 to 30.27% in site 6. On the other hand, fine and coarse sand were predominant in the soil mechanical analysis in sites 2, 4, and 8. The fine sand ranged from 49.1% to 60.7% in sites 2 and 4, respectively, while coarse sand ranged from 18.07% to 20.5% in sites 4 and 8, respectively. In site 5, the fine sand percentage exhibited the highest fraction (66.7%), followed by clay percentage (19.7%), while the lowest percentage was gravel (2.17%). Generally, clay and silt fractions revealed the lowest percentages in all sites except at site 9 and 10, where they showed the highest contents.
Most of the investigated sites (1, 2, 4, 6, 8, 9, and 10) had low contents of cations (Table 3). The comparison of the measured soluble cations within the plants exhibited the predominance of Na and K. The contents of sodium were significantly higher in sites 3 and 7 at Qena-Safaga Road and Idfu-Mrsa Allam Road (11.5 and 4.8 mg·g−1 dry soil, respectively). However, the lowest Na content was recorded in site 4 (0.22 mg·g−1 dry soil) of Qeft-Qusseir. The contents of potassium were significantly higher in sites 3 and 7 at Qena-Safaga Road and Idfu-Mrsa Allam Road (2.8 and 5.4 mg·g−1 dry soil, respectively). Calcium and magnesium revealed the same behavior of sodium in most sites. The highest values of both Ca and Mg were in site 3 at Qena-Safaga Road (4.2 and 0.25 mg·g−1 dry soil, respectively).
The soils seemed to be poor in Cl (they ranged from 0.07 to 0.6 mg·g−1 dry soil in sites 7 at Idfu-Mrsa Allam Road and 3 at Qena-Safaga Road, respectively), but showed high contents of Cl in site 4 (1.04 mg·g−1 dry soil) at Qeft-Qusseir (Wadi El-Matulli). There were wide variations between the different sites regarding their contents of phosphates (PO4), which showed the highest values in site 3 at Qena-Safaga Road (0.74 mg·g−1 dry soil).
The results of pH value (Table 3) exhibited that the soil solution was slightly alkaline and ranged between 7.2 and 8.6. The soil of Hurghada (site 2) showed the highest significant alkalinity (pH = 8.6) while the lowest value was determined in site 3 at Qena-Safaga Road (pH = 7.2).
Soil moisture content (MC) of soil samples in sites inhabited by A. javanica plants (Table 3) revealed that MC of the soil samples ranged between 0.04% and 0.78% in the different sites, where the highest value was found in site 4 at Qeft-Qusseir Road and the lowest value in site 6 at Qeft-Qusseir Road (El Fawakher).
Total soluble salts significantly varied among the sites (Table 3). They were significantly higher in site 3 at Qena-Safaga Road (2106 mg/L). While the lowest value was revealed in site 4 at Qeft-Qusseir Road (74.4 mg/L).

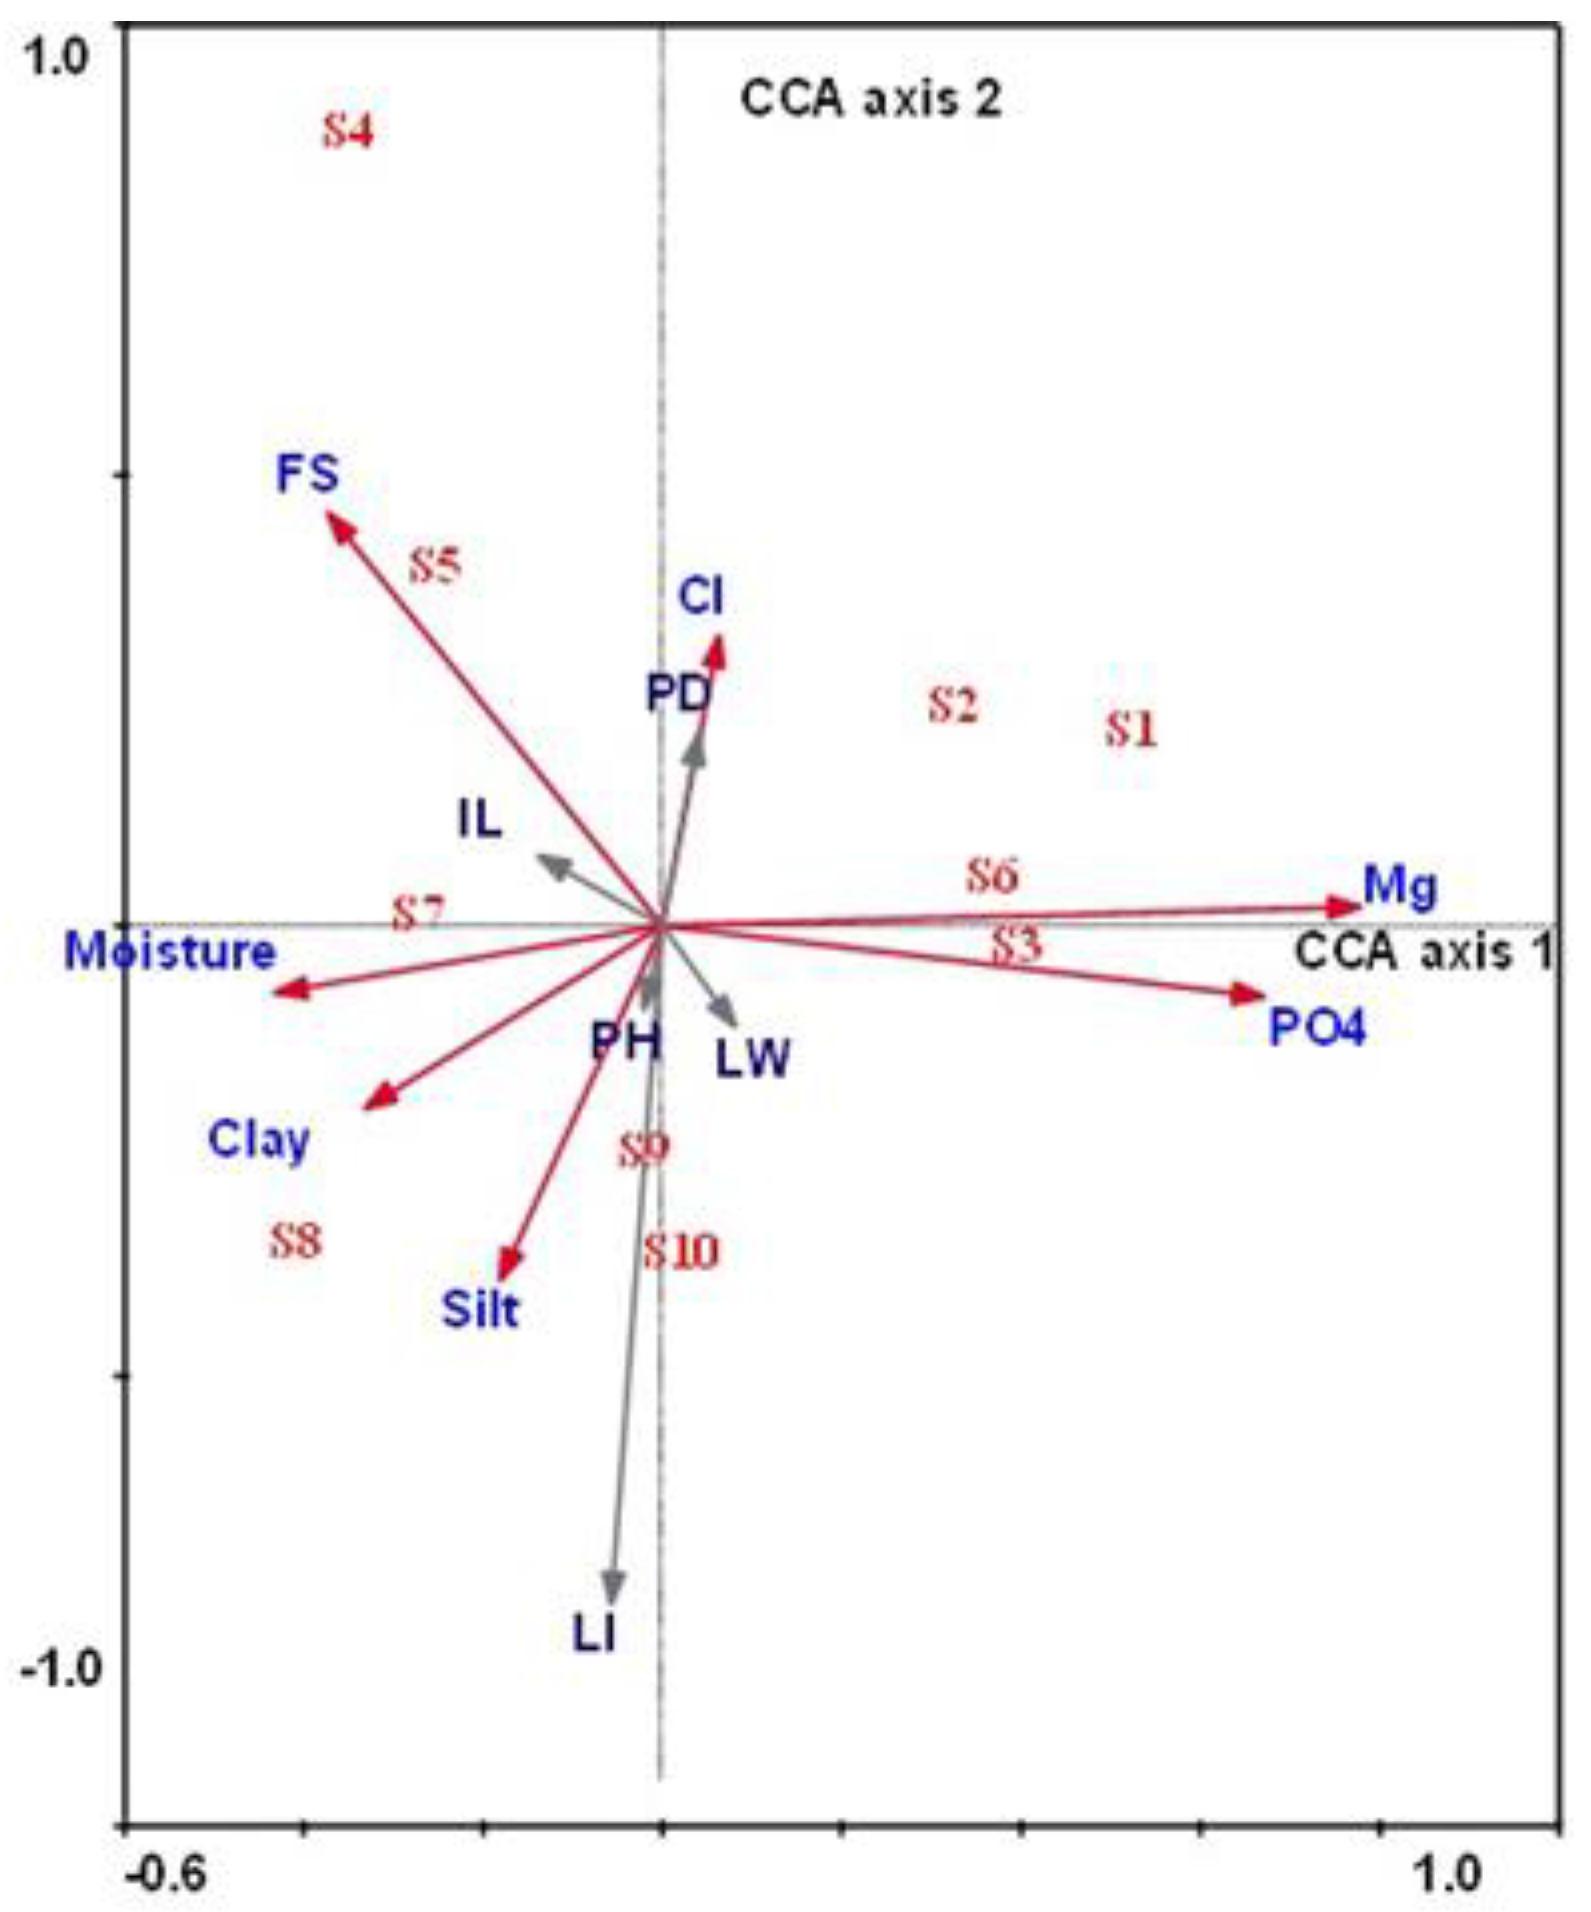
3.4. Compositional Ordination of Morphological Traits of Aerva javanica and Their Soil Variables

The relationship between the morphological traits of Aerva javanica and their soil variables was studied using Canonical Correspondence Analysis (CCA; Figure 6). The first CCA axis can be interpreted as the Mg–MC gradient and the second axis as the Fine sand–Silt gradient. Sites 1, 2, 3, and 6 were confined to the right half of the CCA biplot and highly correlated with Mg, PO4, and Cl, whereas sites 4, 5, and 7 (the upper left quadrate) showed a correlation with fine sand (FS) and soil moisture. Clay and silt were the most effective soil factors on A. javanica of sites 8, 9, and 10 (Figure 6). The variation of plant diameter (PD) was positively correlated with soil Cl and Mg; meanwhile, leaf width (LW) and leaf index (LI) were positively correlated with soil pH, silt, and clay. Notably, the inflorescence length (IL) variations were positively correlated with the variation in sites’ fine sand and moisture contents.
The successive decrease of eigenvalues of the two CCA axes (0.488 and 0.413 for axes 1 and 2, respectively) that are illustrated in Table 4 suggested a well-structured data set. However, the species–environment correlations were higher for the first two canonical axes, explaining 73.1% of the cumulative variance. These results suggested a strong association between plant morphological variations and the measured soil parameters presented in the biplot. The species–environment correlation was also high: 0.998 and 0.990 for CCA axes 1 and 2, showing that the species data were related to the measured environmental variables. A test for significance with an unrestricted Monte Carlo permutation test for the eigenvalue was found to be significant (p = 0.028).
By using all data comprising morphological variations, soil variables, and ISSR polymorphism, biplot mapping (Figure 7A) showed that the ten populations separated into three groups; one includes Pop 3 collected from Qena-Safaga Road (Wadi El-Markh) and was separate from other populations by ISSR 20, K+, Gravel %, and ISSR 10. Cluster analysis (Figure 7B) also gave the same result as the biplot and divided the populations into three groups; the first group includes Pop 3, the second group contains populations 1, 2, 3, and 4, and the third group had populations 7 to 10.
The highest similarity was (0.974) between Pop 8 collected from Idfu-Mrsa Allam Road Wadi Abbady (El-Timsah) and Pop 9 collected from Idfu-Mrsa Allam Road Wadi Abbady (El-Kanayis). The lowest similarity (0.715) was recorded between Pop1 collected at Ras Garib (Wadi Abo Had) and Pop 3 collected from Qena-Safaga Road (Wadi El-Markh) (Table 5).

4. Discussion

Genetic variation information is important for the assessment of genetic resources, as it is a source of knowledge about plant molecular structure and can, therefore, be used as a basis for plant selection and for the effective estimation, preservation, and utilization of germplasm of any population [36]. The genetic diversity of endangered species is one of the main aims of conservation strategies within populations and considered to be of high importance for acclimation to the change in environment conditions and for the long-term survival of a species [18,20,21]. On the other hand, the morphological descriptors accompanied by the study of genetic diversity are essential, because it permits the determination of the most different genitors [37]. Previous research showed that the discrimination of populations depends mainly on the morphological difference of Citrullus and that morphological markers can be used as a useful means of determining genetic relatedness [38]. Vavilov [39] has previously reported staggering differences between some plants depending mainly on their morphological features.
The values of ISSR and RAPD markers in genetic divergence analysis and protection management of medicinal plants genetic variation are necessary for any conservation program [40]. In this study, ten ISSR primers were utilized for the implementation of genomic DNA of Aerva javanica populations. Under the implementation of ten primers of ISSR, 113 intensity bands were generated that were higher than the total bands obtained from 17 ISSR primers for A. javanica studied by El-Domyati et al. [41]. The great number of single bands indicates the strength of ISSR markers in fingerprinting and variation analysis, particularly among intimately linked species and populations, as found by Joshi and Gupta [42]. The connection among genetic variance and the geographical location of populations has been noticed in various plant species. In Jordan, results exhibited the existence of relationships among morphology and molecular interpretation in Achillea fragrantissima [43]. In Egypt, the main focus of the molecular diversity of five populations of Achillea fragrantissima using RAPD and isozymes markers showed that the variations in zonation were especially reflected on DNA fingerprinting [44]. Consequently, the populations of some species in the Eastern Desert of Egypt from close geographical sites were grouped together corroborating a limited gene flow that may be due to fragmentation of the geographical range in the species assured by Badr et al. [25,45]. In the current study, the proportion of polymorphic bands distinctly specified that the ISSR markers are extremely polymorphic and particularly informational for determining genetic relationships of the examined A. javanica populations. The application of multivariate analysis techniques (PCoA) in the present study proved useful in classifying the ten sites into three main groups. This was confirmed by UPGMA analysis.
Gemeinholzer and Bachmann [46] found that the proficiency of morphological and molecular markers for species variation and delineation may not be the same. In some studies, species could not be differentiated on the principle of morphological properties when using molecular methods. Duminil and Di Michele [47] showed that the cases of morphological markers can be distinctly based on environmental conditions. By contrast, neutral molecular markers are fundamentally independent of environmental conditions and should, therefore, be more credible. The use of multiple morphological variations should, however, restrict the problem linked with the environmental effect as all traits are improbable to be influenced. Several authors have debated that DNA markers are often preferred over morphological characterizations, since they connect variance forthrightly at the genetic level and supply credible and tremendous data that allow a reproducible determine of genetic variance in the germplasm [48]. In addition, the expression of the majority of the phenotypic types is markedly affected by the environment, and the discovery of molecular markers is confounded by the environmental influences. However, combining both morphological and molecular data often results in the most inclusive evidence on the genetic differences of species, as done with A. javanica in the present study. Comparable results were also found in Artemisia monosperma and Artemisia judaica from Egypt [24] and Saudi Arabia [23] in various environmental systems [49].
The soil characteristics, particularly Na, Ca, K, Mg, Cl, SO4, pH, EC, gravels, and moisture contents, play essential roles in the vegetation groups in the Eastern Desert of Egypt [50]. The presence of some medicinal species in large groups of the Eastern Desert of Egypt reflects its capability to remain under various environmental systems [25,49]. In our study, A. javanica behaves in the same manner. Osmoregulation relies on inorganic solutes accumulation. It is a simple way to conquer outer biological or abiotic stresses. The absorption, exclusion, or removal of inorganic ions such as sodium, potassium, calcium, magnesium, and chlorides from the osmo-regulator is very helpful in adjusting the osmotic gradient in stressed plants [51,52,53]. The results of our study revealed that the above mechanisms might occur in A. javanica. Moreover, the current work showed that A. javanica accumulated high constituents of anions. This causes high osmotic pressure to increment the specific heat of cell sap to control high desert temperatures. Phosphates exhibited in few amounts in A. javanica may be due to the fast integration of phosphates into plant metabolism or rarity of phosphates in the soil; these results concur with Salama et al. [8]. The canonical correspondence analysis (CCA) biplot of soil variables analyzed by CCA showed that fine sand, Mg, PO4, silt and clay, moisture, fine sand, and salinity were the principal features affecting the frequency of A. javanica plants in the study area. This has been studied in other related studies [8,54]. Meanwhile, the cluster analysis of ISSR polymorphism showed that populations 7–10 are grouped in one distinct cluster and share similar geographical areas impacted by the environmental conditions and geographical locations. A similarity coefficient calculates the degree of similarity between a pair of objects [55]. According to the similarity coefficient, the highest similarity, 0.974, existed between Pop 8 and Pop 9. Similar findings correlating genetic diversity to geographical relations and environmental conditions were reported in some species in the Eastern Desert and in the mountains of South Sinai [18,21,41].

5. Conclusions

In conclusion, a substantial association was evident between morphological traits and molecular polymorphism among populations of A. javanica, indicating interpopulation variations related to geographic distribution and environmental variables in the study area. These results are important for future protection of A. javanica populations as genetic resources of this medicinal plant in natural habitats.

Author Contributions

Conceptualization, N.A.E.-T. and H.Z.; data curation, N.A.E.-T.; H.Z. and M.I.S.; formal analysis, H.Z., N.A.E.-T., H.K.G. and M.I.S.; investigation, N.A.E.-T. and H.Z.; methodology, H.Z. and N.A.E.-T.; software, N.A.E.-T.; H.Z. and M.I.S.; validation, N.A.E.-T. and H.K.G.; writing—original draft, H.Z., N.A.E.-T. and H.K.G.; writing—review and editing, H.Z., N.A.E.-T., H.K.G. and M.I.S. All authors have read and agreed to the published version of the manuscript.

Funding

This research received no external funding.

Acknowledgments

We are grateful to Abdelfattah Badr, professor of genetics and Plant Biosystematics at Helwan University, Egypt, for having read and carefully corrected our manuscript.

Conflicts of Interest

The authors declare no conflict of interest.

References

  1. Judd, W.S.; Campbell, C.S.; Kellog, E.A.; Stevens, P.F.; Donoghue, M.J. Plant Systematics: A Phylogenetic Approach, 3rd ed.; Sinauer Associates: Sunderland, MA, USA, 2007; ISBN 978-0-87893-407-2. [Google Scholar]
  2. Soliman, M.A. Cytogenetical studies on Aerva javanica (Amaranthaceae). Flora Mediterr. 2006, 16, 333–339. [Google Scholar]
  3. Boulos, L. Flora of Egypt Checklist; Revised Annotated Edition; Al Hadara Publishing: Cairo, Egypt, 2009. [Google Scholar]
  4. Raza, M.A.; Younas, M.; Buerkert, A.; Schlecht, E. Ethno-botanical remedies used by pastoralists for the treatment of livestock diseases in Cholistan desert, Pakistan. J. Ethnopharmacol. 2014, 151, 333–342. [Google Scholar] [CrossRef]
  5. Al-Shehri, M.; Moustafa, M. Anticancer, antibacterial, and phytochemicals derived from extract of Aerva javanica (Burm.f.) Juss. ex Schult. grown naturally in Saudi Arabia. Trop. Conserv. Sci. 2019, 12, 1–10. [Google Scholar] [CrossRef] [Green Version]
  6. Movaliya, V.; Zaveri, M. Pharmacognostical studies on roots of Aerva javanica. Int. J. Pharm. Sci. Rev. Res. 2012, 16, 34–37. [Google Scholar]
  7. Soliman, M.S.A.; El-Tarras, A.; El-Awady, M.A. Cytologenetical Study of some Wild Plants from Taif, Saudi Arabia. Nat. Sci. 2011, 9, 101–104. [Google Scholar]
  8. Salama, F.; Abd El-Ghani, M.; El-Tayeh, N.; Amro, A.; El-Naggar, S. Adaptive responses of Aerva javanica Burm.f. Shult. to severe aridity in the Egyptian deserts. Egypt. J. Bot. 2018, 58, 171–184. [Google Scholar] [CrossRef] [Green Version]
  9. Salama, F.M.; El-Naggar, S.M. Phytosociology of wadi system west of Qusseir province. Feddes Repert. 1991, 102, 453–468. [Google Scholar] [CrossRef]
  10. Abd El-Ghani, M.M. Environmental correlates of species distribution in arid desert ecosystems of eastern Egypt. J. Arid Environ. 1998, 38, 297–313. [Google Scholar] [CrossRef]
  11. Shawky, R.A.; El-Khouly, A.A. Plant species diversity of some wadis at Red Sea Coast, Egypt. Environ. Resour. Ecol. J. 2017, 1, 1–14. [Google Scholar]
  12. Abd El-Ghani, M.M. Floristics and environmental relations in two extreme desert zones of western Egypt. Glob. Ecol. Biogeogr. 2000, 9, 499–515. [Google Scholar] [CrossRef]
  13. Abd El-Ghani, M.M.; Amer, W.M. Soil-vegetation relationships in a coastal desert plain of southern Sinai, Egypt. J. Arid Environ. 2003, 55, 607–628. [Google Scholar] [CrossRef]
  14. Salama, F.M.; Abd El-Ghani, M.M.; El-Tayeh, N.A.; Amro, A.; Abdrabbu, H.S. Correlations between soil variables and weed communities in major crops of the desert reclaimed lands in southern Egypt. Rend. Lincei 2017, 28, 363–378. [Google Scholar] [CrossRef]
  15. Salama, F.; Abd El-Ghani, M.; Gadalla, M.; Ramadan, T.; Galal, H.; Gaafar, A. Vegetation Patterns and Floristic Composition along Elevation Gradient on Jabal Musa, South Sinai, Egypt. Catrina Int. J. Environ. Sci. 2018, 17, 41–57. [Google Scholar]
  16. Ottewell, K.M.; Bickerton, D.C.; Byrne, M.; Lowe, A.J. Bridging the gap: A genetic assessment framework for population-level threatened plant conservation prioritization and decision-making. Divers. Distrib. 2016, 22, 174–188. [Google Scholar] [CrossRef] [Green Version]
  17. Tharachand, C.; Immanuel Selvaraj, C.; Mythili, M.N. Molecular markers in characterization of medicinal plants: An overview. Res. Plant Biol. 2012, 2, 1–12. [Google Scholar]
  18. Krishnan, P.N.; Decruse, S.W.; Radha, R.K. Conservation of medicinal plants of Western Ghats, India and its sustainable utilization through in vitro technology. Vitr. Cell. Dev. Biol. Plant. 2011, 47, 110–122. [Google Scholar] [CrossRef]
  19. Ganie, S.H.; Upadhyay, P.; Das, S.; Prasad Sharma, M. Authentication of medicinal plants by DNA markers. Plant Gene. 2015, 4, 83–99. [Google Scholar] [CrossRef] [Green Version]
  20. Zietkiewicz, E.; Rafalski, A.; Labuda, D. Genome fingerprinting by simple sequence repeat (SSR)-anchored polymerase chain reaction amplification. Genomics 1994, 20, 176–183. [Google Scholar] [CrossRef]
  21. Godwin, I.D.; Aitken, E.A.B.; Smith, L.W. Application of inter simple sequence repeat (ISSR) markers to plant genetics. Electrophoresis 1997, 18, 1524–1528. [Google Scholar] [CrossRef]
  22. Singh, D.R.; Srivastava, A.K.; Srivastava, A.; Srivastava, R.C. Genetic diversity among three Morinda species using RAPD and ISSR markers. Indian J. Biotechnol. 2011, 10, 285–293. [Google Scholar]
  23. Badr, A.; El-Shazly, H.H.; Helail, N.S.; El Ghanim, W. Genetic diversity of Artemisia populations in central and north Saudi Arabia based on morphological variation and RAPD polymorphism. Plant Syst. Evol. 2012, 298, 871–886. [Google Scholar] [CrossRef]
  24. Badr, A.; Morsy, W.; Abdelfattah, S.; Shams, S.; Shehab, A. Genetic diversity in Artemisia monosperma and Artemisia judaica populations in Egypt based on morphological, karyological and molecular variations. J. Med. Plants Res. 2012, 6, 66–78. [Google Scholar]
  25. Badr, A.; Kamel, M.; Zaki, H. Genetic diversity of Colocynth (Citrullus colocynthis Schrader) populations in the Eastern Desert of Egypt as revealed by morphological variation and ISSR polymorphism. Feddes Repert. 2018, 129, 173–184. [Google Scholar] [CrossRef]
  26. Abd El-Ghani, M.; Salama, F.; Salem, B.; El-hadidy, A.; Abdel-aleem, M. Phytogeography of the Eastern Desert flora of Egypt. Wulfenia 2017, 24, 97–120. [Google Scholar]
  27. Ryan, J.; Rashid, A. Application of soil and plant analysis for applied research and development in West Asia-North Africa: An international center’s perspective. Commun. Soil Sci. Plant Anal. 2006, 37, 2185–2198. [Google Scholar] [CrossRef]
  28. Sparks, D.L. Methods of Soil Analysis; Chemical Methods; Soil Science Society of America, Inc.: Madison, WI, USA, 1996. [Google Scholar]
  29. Estefan, G.; Sommer, R.; Ryan, J. Methods of Soil, Plant, and Water Analysis; A manual for the West Asia and North Africa Region; International Center for Agricultural Research in the Dry Areas (ICARDA): Aleppo, Syria, 2013. [Google Scholar]
  30. Watanabe, F.S.; Olsen, S.R. Test of an Ascorbic Acid Method for Determining Phosphorus in Water and NaHCO3 Extracts from Soil1. Soil Sci. Soc. Am. J. 1965, 29, 677. [Google Scholar] [CrossRef]
  31. Green, S.; Salkind, N. Using SPSS for Windows and Macintosh; Books a La Carte; Pearson: London, UK, 2016. [Google Scholar]
  32. Wilkinson, L. Systat. Wiley Interdiscip. Rev. Comput. Stat. 2010, 2, 256–257. [Google Scholar] [CrossRef]
  33. Kovach, W. MVSP-A MultiVariate Statistical Package for Windows, version 3.1; Kovach Computing Services: Pentraeth, Wales, UK, 1999. [Google Scholar]
  34. Ter Braak, C.J.F. Canonical correspondence analysis: A new eigenvector technique for multivariate direct gradient analysis. Ecology 1986, 67, 1167–1179. [Google Scholar] [CrossRef] [Green Version]
  35. Ter Braak, C.J.F. Update Notes: CANOCO, version 3.1; Agricultural Mathematics Group: Wageningen, The Netherlands, 1990; p. 35. [Google Scholar]
  36. Lee, S.R.; Choi, J.E.; Lee, B.Y.; Yu, J.N.; Lim, C.E. Genetic diversity and structure of an endangered medicinal herb: Implications for conservation. AoB Plants 2018, 10, ply021. [Google Scholar] [CrossRef]
  37. Carvalho, A.; Lima-Brito, J.; MaçÃs, B.; Guedes-Pinto, H. Genetic diversity and variation among botanical varieties of old Portuguese wheat cultivars revealed by ISSR assays. Biochem. Genet. 2009, 47, 276–294. [Google Scholar] [CrossRef]
  38. Gichimu, B.M.; Owuor, B.O.; Mwai, G.N.; Dida, M.M. Morphological characterization of some wild and cultivated watermelon (Citrullus sp.) accessions in Kenya. ARPN J. Agric. Biol. Sci. 2009, 4, 10–18. [Google Scholar]
  39. Vavilov, N.I. Origin and Geography of Cultivated Plants; Cambridge University Press: Cambridge, UK, 1992; p. 498. ISBN 0-521-40427-4. [Google Scholar]
  40. Kumar, A.; Mishra, P.; Singh, S.C.; Sundaresan, V. Efficiency of ISSR and RAPD markers in genetic divergence analysis and conservation management of Justicia adhatoda L., a medicinal plant. Plant Syst. Evol. 2014, 300, 1409–1420. [Google Scholar] [CrossRef]
  41. El-Domyati, F.M.; Younis, R.A.A.; Edris, S.; Mansour, A.; Sabir, J.; Bahieldin, A. Molecular markers associated with genetic diversity of some medicinal plants in Sinai. J. Med. Plants Res. 2011, 5, 1918–1929. [Google Scholar]
  42. Joshi, S.P.; Gupta, V.S.; Aggarwal, R.K.; Ranjekar, P.K.; Brar, D.S. Genetic diversity and phylogenetic relationship as revealed by inter simple sequence repeat (ISSR) polymorphism in the genus Oryza. Theor. Appl. Genet. 2000, 100, 1311–1320. [Google Scholar] [CrossRef]
  43. Rawashdeh, I.M.; Haddad, N.I.; Amri, A. Diversity assessment of Achillea fragrantissima (Forskal) Schultz Bip. populations collected from different ecosystems in Jordan. Res. Crop. 2009, 10, 632–642. [Google Scholar]
  44. Morsy, A.A. Molecular variations of Achillea fragrantissima (Forssk.) SCH. BIP. growing in five areas of South Sinai. Int. J. Agric. Biol. 2007, 9, 11–17. [Google Scholar]
  45. Badr, A.; El-Shazly, H.; Ahmed, H.; Hamouda, M.; El-Khateeb, E.; Sakr, M. Genetic diversity of Achillea fragrantissima in Egypt inferred from phenotypic variations and ISSR markers associated with traits of plant size and seed yield. Plant Genet. Resour. 2017, 15, 239–247. [Google Scholar] [CrossRef]
  46. Gemeinholzer, B.; Bachmann, K. Examining morphological and molecular diagnostic character states of Cichorium intybus L. (Asteraceae) and C. spinosum L. Plant Syst. Evol. 2005, 253, 105–123. [Google Scholar] [CrossRef]
  47. Duminil, J.; Di Michele, M. Plant species delimitation: A comparison of morphological and molecular markers. Plant Biosyst. 2009, 143, 528–542. [Google Scholar] [CrossRef]
  48. Pandey, S.; Kumar, S.; Mishra, U.; Rai, A.; Singh, M.; Rai, M. Genetic diversity in Indian ash gourd (Benincasa hispida) accessions as revealed by quantitative traits and RAPD markers. Sci. Hortic. 2008, 118, 80–86. [Google Scholar] [CrossRef]
  49. Abd El-Ghani, M.; Abo El-Kheir, M.; Abdel-Dayem, M.; Abd El-Hamid, M. Vegetation analysis and soil characteristics of five common desert climbing plants in Egypt. Turk. J. Botany 2011, 35, 561–580. [Google Scholar]
  50. Salama, F.; El-Ghani, M.; Gadallah, M.; El-Naggar, S.; Amro, A. Variations in Vegetation Structure, Species Dominance and Plant Communities in South of the Eastern Desert-Egypt. Not. Sci. Biol. 2014, 6, 41–58. [Google Scholar] [CrossRef] [Green Version]
  51. Walker, J.M.; Sunkar, R. Plant Stress Tolerance—Methods and Protocols; Humana Press: Totowa, NJ, USA, 2010; ISBN 9781607617013. [Google Scholar]
  52. Sayed, A.; Mohamed, A.A.; Salama, F.M. Ecophysiological studies on three desert plants growing in Wadi Natash, Eastern Desert, Egypt. J. Biol. Earth Sci. 2013, 3, 135–143. [Google Scholar]
  53. Salama, F.; Sayed, S.; Abd El-Gelil, A. Ecophysiological responses of Calligonum polygonoides and Artemisia judaica plants to severe desert aridity. Turk. J. Bot. 2015, 39, 253–266. [Google Scholar] [CrossRef] [Green Version]
  54. Shaltout, K.H.; El-Kady, H.F.; Al-Sodany, Y.M. Vegetation analysis of the Mediterranean region of Nile Delta. Vegetatio 1995, 116, 73–83. [Google Scholar]
  55. Thada, V.; Jaglan, V. Comparison of jaccard, dice, cosine similarity coefficient to find best fitness value for web retrieved documents using genetic algorithm. Int. J. Innov. Eng. Technol. 2013, 2, 202–205. [Google Scholar]
Figure 1. Map of Egypt showing the sites of populations of Aerva javanica used in this study. Location 1 = Ras Garib (Wadi Abo Had), Location 2 = Hurghada (Wadi Bali), Location 3 = Qena-Safaga Road (Wadi El-Markh), Location 4 = Qeft-Qusseir Road (Wadi El-Matulli), Location 5 = Qeft-Qusseir Road (Wadi El-Laqeita), Location 6 = Qeft-Qusseir Road (El Fawakher), Location 7 = Idfu-Mrsa Allam Road Wadi Abbady (Bir Abbady), Location 8 = Idfu-Mrsa Allam Road Wadi Abbady (El-Timsah), Location 9 = Idfu-Mrsa Allam Road Wadi Abbady (El-Kanayis), Location 10 = Idfu-Mrsa Allam Road Wadi Abbady (El-Kanayis).
Agronomy 10 00402 g001
Figure 2. Photograph of Aerva javanica plant collected from Ras Garib (1) and Qeft-Qusseir Road (2).
Agronomy 10 00402 g002
Figure 3. (A) Cluster analysis among ten populations (Pop) of A. javanica based on morphological characters. (B) Cluster analysis among ten populations of A. javanica based on ISSR molecular markers. Pop 1 = Ras Garib (Wadi Abo Had), Pop 2 = Hurghada (Wadi Bali), Pop 3 = Qena-Safaga Road (Wadi El-Markh), Pop 4 = Qeft-Qusseir Road (Wadi El-Matulli), Pop 5 = Qeft-Qusseir Road (Wadi El-Laqeita), Pop 6 = Qeft-Qusseir Road (El Fawakher), Pop 7 = Idfu-Mrsa Allam Road, Pop 8 = Idfu-Mrsa Allam Road Wadi Abbady (El-Timsah), Pop 9 = Idfu-Mrsa Allam Road Wadi Abbady (El-Timsah), Pop 10 = Idfu-Mrsa Allam Road Wadi Abbady (El-Kanayis).
Agronomy 10 00402 g003
Figure 4. ISSR fingerprinting profile produced by the 10 primers in the examined populations of A. javanica.
Agronomy 10 00402 g004
Figure 5. Principal Coordinate Analysis (PCoA) of ten populations of A. javanica based on ISSR molecular markers.
Agronomy 10 00402 g005
Figure 6. Canonical correspondence analysis (CCA) biplot of axes 1 and 2 showing the distribution of the 10 sites of the study area of A. javanica populations with their vegetation groups, soil variables, and morphological characters. LI = leaf Index, LW = leaf width, PH = plant height, PD = plant diameter, IL = inflorescence length. All other soil parameters and plant traits were excluded due to insignificance.
Agronomy 10 00402 g006
Figure 7. (A) Biplot mapping among ten populations of A. javanica based on morphological variations, soil variables, and molecular attributes (ISSR). (B) Cluster analysis among ten populations of A. javanica based on morphological variations, soil variables, and molecular attributes (ISSR). Pop 1 = Ras Garib (Wadi Abo Had), Pop 2 = Hurghada (Wadi Bali), Pop 3 = Qena-Safaga Road (Wadi El-Markh), Pop 4 = Qeft-Qusseir Road (Wadi El-Matulli), Pop 5 = Qeft-Qusseir Road (Wadi El-Laqeita), Pop 6 = Qeft-Qusseir Road (El Fawakher), Pop 7 = Idfu-Mrsa Allam Road, Pop 8 = Idfu-Mrsa Allam Road Wadi Abbady (El-Timsah), Pop 9 = Idfu-Mrsa Allam Road Wadi Abbady (El-Timsah), Pop 10 = Idfu-Mrsa Allam Road Wadi Abbady (El-Kanayis).
Agronomy 10 00402 g007
Table 1. The sequence, names of Inter-Simple Sequence Repeat (ISSR) primers, number of polymorphic, monomorphic, unique, total bands, and polymorphism (%) calculated by the analysis of ISSR in the examined Aerva javanica populations.
Name PrimerSequenceMonomorphic BandsPolymorphic BandsUnique BandsTotal BandsPolymorphism (%)
ISSR- 15′-AGAGAGAGAGAGAGAGC-3′09514100
ISSR- 45′-ACACACACACACACACG-3′41422080
ISSR- 55′-GTGTGTGTGTGTGTGTYG-3′013013100
ISSR- 105′-GACAGACAGACAGACAAT-3′161888
ISSR- 125′-ACACACACACACACACC-3′21031587
ISSR- 135′-AGAGAGAGAGAGAGAGT-3′5511155
ISSR- 145′-CTCCTCCTCCTCCTCTT-3′151786
ISSR- 185′-HVHCACACACACACACAT-3′320540
ISSR- 195′-HVHTCCTCCTCCTCCTCC-3′251875
ISSR- 205′-HVHTGTGTGTGTGTGTGT-3′2731283
Total 20761711379.4
Table 2. The average value of the measurements for the quantitative traits ± SD for the examined populations of A. javanica.
NoCharacterPopulations
12345678910
1Plant height (cm)110 * ± 5.0100 * ± 3.044.3 ± 3.068 * ± 2.065 * ± 2.080 * ± 3.0120 * ± 5.065 * ± 4.0120 * ± 6.0150 * ± 5.0
2Plant diameter (cm)200 * ± 6.0170 * ± 5.067.7 ± 4.0240 * ± 2.0210 * ± 3.0280 * ± 6.0109 * ± 3.0115 * ± 1.0230 * ± 4.0115 * ± 2.0
3Leaf length (cm)2.06 * ± 0.11.8 * ± 0.12.09 ± 0.11.39 * ± 0.11.71 * ± 0.11.95 * ± 0.11.65 * ± 0.12.82 * ± 0.11.63 * ± 0.12.78 * ± 0.1
4Leaf width (mm)6.8 * ± 0.55.6 * ± 0.45.6 ± 0.36.4 * ± 0.45.0 * ± 0.45.6 * ± 0.25.4 * ± 0.17.2 * ± 0.44.4 * ± 0.56.8 * ± 0.5
5Leaf index3.03 * ± 0.083.21 * ± 0.413.72 ± 0.022.17 * ± 0.023.43 * ± 0.073.48 * ± 0.33.06 * ± 0.133.91 * ± 0.083.71 * ± 0.664.09 * ± 0.15
6Inflorescence length (cm)2.81 * ± 0.23.01 * ± 0.32.40 ± 0.14.57 * ± 0.33.60 * ± 0.43.99 * ± 0.11.69 * ± 0.23.63 * ± 0.23.30 * ± 0.42.93 * ± 0.2
* = Statistically significant at the 0.05 level.
Table 3. Soil variables ± SD values in the collected soil samples of the 10 examined populations of A.javanica.
No.Gravel %Coarse Sand %Fine Sand %Silt %Clay %Moisture (%)pHTDS (mg/L)EC (µs/cm)Na (mg/g)K (mg/g)Ca (mg/g)Mg (mg/g)Cl (mg/g)PO4 (mg/g)
127.91 ± 4.59.7 ± 2.0858.0 ± 3.42.3 ± 0.32.1 ± 0.110.08 ± 0.07.9 ± 0.24116.6 ± 4.4188.9 ± 86.22.9 ± 2.11.5 ± 0.430.49 ± 0.40.17 ± 0.070.15 ± 0.040.5 ± 0.4
219.31 ± 6.419.9 ± 7.549.1 ± 5.46.2 ± 8.25.4 ± 6.90.11 ± 0.018.6 ± 0.0885.56 ± 7.2145.9 ± 17.82.5 ± 0.742.5 ± 0.470.21 ± 0.030.11 ± 0.030.10 ± 0.010.28 ± 0.1
324.81 ± 2.155.5 ± 3.310.8 ± 1.94.6 ± 1.74.4 ± 1.560.29 ± 0.07.2 ± 0.092106 ± 1353380.0 ± 64511.5 ± 3.22.8 ± 1.024.2 ± 0.70.25 ± 0.210.60 ± 0.300.74 ± 0.7
40.02 ± 0.0118.07 ± 2.860.7 ± 4.515.8 ± 1.95.4 ± 0.210.78 ± 0.08.3 ± 0.1474.4 ± 5.4123.2 ± 9.950.22 ± 0.10.03 ± 0.010.23 ± 0.00.08 ± 0.011.04 ± 0.020.23 ± 0.01
52.17 ± 1.863.9 ± 3.366.7 ± 22.97.5 ± 4.819.7 ± 220.23 ± 0.28.4 ± 0.48139.6 ± 67.4232.5 ± 113.22.6 ± 1.42.5 ± 0.930.34 ± 0.00.08 ± 0.030.09 ± 0.010.21 ± 0.02
630.27 ± 3.621.3 ± 2.644.0 ± 4.02.0 ± 0.42.4 ± 1.010.04 ± 0.08.0 ± 0.1976.6 ± 19.9126.8 ± 31.92.3 ± 0.931.5 ± 0.320.16 ± 0.00.12 ± 0.050.08 ± 0.020.34 ± 0.2
722.70 ± 18.89.8 ± 5.645.1 ± 8.310.1 ± 6.912.2 ± 8.90.50 ± 0.17.9 ± 0.16281.7 ± 20.1469.0 ± 335.64.8 ± 1.355.4 ± 0.750.28 ± 0.00.06 ± 0.030.07 ± 0.020.23 ± 0.03
815.84 ± 3.0820.5 ± 3.958.2 ± 7.93.4 ± 2.72.1 ± 0.100.13 ± 0.08.5 ± 0.12112.3 ± 27.6186.8 ± 45.61.8 ± 0.602.5 ± 0.770.44 ± 0.20.05 ± 0.020.21 ± 0.040.3 ± 0.06
93.08 ± 4.523.6 ± 4.629.5 ± 2.436.0 ± 0.827.8 ± 6.80.61 ± 0.38.1 ± 0.12131.2 ± 18.3216.9 ± 24.11.5 ± 0.292.5 ± 0.200.23 ± 0.10.12 ± 0.010.16 ± 0.010.3 ± 0.10
102.1 ± 2.524.4 ± 3.630.7 ± 4.137.5 ± 1.725.3 ± 2.80.51 ± 0.38.2 ± 0.10134.2 ± 15.1220.1 ± 14.51.7 ± 0.252.9 ± 0.220.27 ± 0.10.12 ± 0.040.15 ± 0.010.3 ± 0.11
Table 4. Inter-set correlation of CCA analysis for the soil variables, together with eigenvalues and species–environment correlations for the 10 examined populations of Aerva javanica.
Axes12
Eigenvalues0.4880.413
Species–environment correlations0.9980.990
Cumulative percentage variance of species–environment relation25.747.4
FS (%)−0.356 *0.447 *
Silt (%)−0.173−0.384 *
Clay (%)−0.316 *−0.198
Moisture content−0.412 *−0.073
Mg (mg g−1 dry soil)0.742 **0.021
Cl (mg g−1 dry soil)0.0610.315 *
PO4 (mg g−1 dry soil)0.640 **−0.077
Species–environment correlations0.9260.744
Cumulative percentage variance of species–environment relation:30.747.7
Plant height (PH)−0.0196−0.0906
Plant diameter (PD)0.03910.2085
Leaf width (LW)0.0771−0.1093
Leaf index (LI)−0.0543−0.7358
Inflorescence length(IL)−0.13170.0762
* = Correlation is significant at 0.05 level. ** = Correlation is significant at 0.01 level.
Table 5. Similarity index among the populations of A. javanica based on morphological, ecological, and molecular attributes using the SYSTAT version 7.0 program.
12345678910
11
20.9531
30.7150.7291
40.8470.8360.7451
50.7990.8190.8360.9251
60.8480.8880.8310.8190.811
70.8160.8230.8170.870.9110.8511
80.8180.8490.860.8890.9210.8740.9591
90.8290.8510.8160.9130.9420.8570.9510.9741
100.8150.8170.7920.8850.9180.8840.9320.9220.9431

