
An Integrated Grassland Fire-Danger-Assessment System for a Mountainous National Park Using Geospatial Modelling Techniques

Department of Geography, Faculty of Natural and Agricultural Sciences, University of the Free State, Bloemfontein 9300, South Africa
*
Author to whom correspondence should be addressed.
Fire 2024, 7(2), 61; https://doi.org/10.3390/fire7020061
Submission received: 29 December 2023
/
Revised: 5 February 2024
/
Accepted: 8 February 2024
/
Published: 19 February 2024
(This article belongs to the Special Issue Remote Sensing of Wildfire: Regime Change and Disaster Response)
Abstract
:Grasslands are key to the Earth’s system and provide crucial ecosystem services. The degradation of the grassland ecosystem in South Africa is increasing alarmingly, and fire is regarded as one of the major culprits. Globally, anthropogenic climate changes have altered fire regimes in the grassland biome. Integrated fire-risk assessment systems provide an integral approach to fire prevention and mitigate the negative impacts of fire. However, fire risk-assessment is extremely challenging, owing to the myriad of factors that influence fire ignition and behaviour. Most fire danger systems do not consider fire causes; therefore, they are inadequate in validating the estimation of fire danger. Thus, fire danger assessment models should comprise the potential causes of fire. Understanding the key drivers of fire occurrence is key to the sustainable management of South Africa’s grassland ecosystems. Therefore, this study explored six statistical and machine learning models—the frequency ratio (FR), weight of evidence (WoE), logistic regression (LR), decision tree (DT), random forest (RF), and support vector machine (SVM) in Google Earth Engine (GEE) to assess fire danger in an Afromontane grassland protected area (PA). The area under the receiver operating characteristic curve results (ROC/AUC) revealed that DT showed the highest precision on model fit and success rate, while the WoE was used to record the highest prediction rate (AUC = 0.74). The WoE model showed that 53% of the study area is susceptible to fire. The land surface temperature (LST) and vegetation condition index (VCI) were the most influential factors. Corresponding analysis suggested that the fire regime of the study area is fuel-dominated. Thus, fire danger management strategies within the Golden Gate Highlands National Park (GGHNP) should include fuel management aiming at correctly weighing the effects of fuel in fire ignition and spread.
1. Introduction
Grasslands are the largest ecosystem in the world, representing 40% of the Earth’s vegetation cover [1]. Therefore, grasslands are key to Earth’s system—they have crucial ecosystem functions, including livestock grazing areas, water supply and regulation, biodiversity reserves, tourism sites, recreation areas, and religious sites [2,3]. Its other functions are food sources, natural medicine sources, carbon storage and climate mitigation, pollination, and cultural services [2,3]. Grasslands are found mainly in tropical and subtropical Africa and Australia, temperate and high mountain areas in China and Tibet, and in the Middle East and North and South America [4]. However, the global degradation of grassland ecosystems is increasing at an alarming rate, and fire is regarded as one of the major drivers of their degradation [5]. The grassland biome accounts for 80% of the global burnt area [6]. Fire, a vital ecological phenomenon, has overtime allowed grasslands to retain their health and vigour [7]. Fire shapes the grassland ecosystem landscape and the population of the inhabiting species [8,9]. Thus, fire has been used as a principal management tool, e.g., in African and Australian grasslands. However, in the face of climate change, the balance between wildfires and nature has been disturbed, leading to a rise in fire frequency, longer fire seasons, and extensive and high-intensity fires [5,10]. Additionally, there will be a rise in burnt areas, human causalities, and damage to infrastructure [11].
Increased fire frequency elevates the risk of fires and amplifies the negative economic, environmental, and social impacts. For instance, in South Africa, the 2017 Knysna fire resulted in the loss of lives and the destruction of property, leading to an economic loss of ZAR 3036 million [12,13]. The April 2021 Table Mountain National Park fire affected surrounding buildings, including the adjacent University of the Cape Town (UCT) library and other historical buildings, burnt c. 600 ha of land, and injured several people [13]. According to Keeley and Pausas [14], the negative impacts of fire are not caused by fire per se but rather perturbations of fire regime parameters, i.e., frequency, seasonality, spread pattern, or intensity. Hence, it is crucial to accurately predict the occurrence of fire and to understand the underlying driving factors of fire danger in order to mitigate and reduce these impacts on protected grassland ecosystems. The prevalence of fires across the African continent has led to Africa being termed the “fire continent” [15]. In South Africa, the grassland biome covers an area of 360,589 km2, comprising an extensive grassland watershed [16]. However, grasslands are one of the most critically threatened in South Africa’s ecosystems [17] and have relatively little national/international protection [18].
Four conditions, known as fire switches, must be met for the occurrence of fire in vegetation: (i) there must be a continuous production of biomass—fuel, (ii) the fuel must be adequately dry, (iii) the weather needs to meet conditions for fire ignition and spread, and (iv) there must be a source of fire ignition [15,19,20]. These conditions are further influenced by the biophysical (e.g., climatic, edaphic, topographic, and vegetation variations) and anthropogenic factors (e.g., land management practices and population density) [19]. Therefore, understanding how fire is influenced by these factors is essential in bolstering fire management efforts and anticipating the future trends in fire patterns. Previous studies analysed key biophysical and anthropogenic factors of fire, independently or otherwise, using conventional statistical techniques. But, the sensitivity of fire to the various factors still remains unknown. Thus, the fire prediction models require understanding the potential driving factors and their respective roles in influencing spatiotemporal fire patterns over a landscape [15,19,21,22,23].
The processing of explanatory data is the most challenging task in mapping fires in relatively large areas due to multiple data sources and the inherent modelling complexity [24]. However, geographic information systems (GIS) have proven useful for fire-danger mapping. In addition, remote sensing (RS) is a popular method in fire modelling. RS is used to classify land cover which is associated with fire-fuel characteristics [25], provide elevation data [26], assess vegetation moisture content [7,27,28,29], assess soil moisture content [10,30,31,32], and for active fire detection and burnt-area estimation [33,34,35]. With the development of Google Earth Engine (GEE) and Cloud Engine (CE) [36], platforms that reduce the requirement for expensive information technology infrastructure, the acquiring and processing of RS datasets is rapidly improving the prediction of fire-danger models [37].
Scholars have applied different methods for fire danger assessment modelling by exploring the relationship between fire occurrence and the driving factors. For example, several studies [38,39,40] assigned weights to independent variables using expert opinion (EO) or judgement-adopting techniques like multi-criteria decision analysis (MCDA) and analytic hierarchy process (AHP). However, the AHP technique cannot adequately depict the effects of the respective fire conditioning factors on fire probability. Furthermore, AHP is critically subjective and suffers from the deficiency of uncertainty due to using the nine-point pairwise rating scale [41,42]. Also, statistical methods have been applied for fire modelling, e.g., frequency ratio (FR) [43,44] and weight of evidence (WoE) [45,46,47,48]. The authors of Hong, et al. [41] combined WoE and AHP to improve the fire susceptibility map of Yuichang County in the south of Jiangxi Province, China. The authors of Arca, et al. [49] compared FR and MCDA for fire danger modelling in Karabük Province, Turkey—FR and MCDA attained classification accuracies of 76.42% and 73.92%, respectively. The authors of Abdo, et al. [50] used FR and AHP to map fire susceptibility in the western region of Syria. Regression models have been intensively applied in fire-danger modelling due to their ease and interpretation [51,52,53,54], logistic generalized additive models [55,56,57], and geographical weighted logistic regression [7,58,59]. Simulation models have been incorporated into applications, from simple to more advanced ones [60]. The most used simulation models include BehavePlus [61], FARSITE [62], Flapmap [63,64], ForeFire [65], Phoenix [66], Prometheus [67], Spark [68], and Wildfire Analyst [69]. Other simulation approaches such as F-Sim, Burn-P3, and Burn-Pro have been used to compute fire ignition and [66]. A variety of studies have employed machine learning (ML), e.g., decision trees (DT), random forest (RF), and support vector machines (SVM) [70,71,72,73,74], as well as maximum entropy (MaxEnt) [22,75,76].
A review by Chicas and Østergaard Nielsen [77] noted an increased use of fire danger models since 2001. However, they observed fire-prone areas where this type of research is not being implemented, especially in Africa and Latin America. Furthermore, previous studies focused more on forest fires—grassland fires have been relatively overlooked. Montane grasslands have long been known to be highly sensitive to the direct impact of climatic warming and drying, so fires in these ecosystems are expected to increase globally [78]. The South African montane grasslands are no exception. Fire regimes in Afromontane grassland ecosystems are not well studied, and the conditions under which fires occur in these landscapes still need to be fully understood. Therefore, this study aimed to develop an integrated grassland fire-danger-assessment system for the Golden Gate Highlands National Park, a montane grassland ecosystem, by exploring six statistical and machine learning models, i.e., frequency ratio (FR), weight of evidence (WoE), logistic regression (LR), decision tree (DT), random forest (RF), and support vector machines (SVM).
2. Materials and Methods
2.1. Study Area
The GGHNP was proclaimed as a national park in 1963. The GGHNP is situated in the foothills of the Drakensberg (Maloti) Mountains in the eastern Free State Province, South Africa (Figure 1). The provincial road R712 winds its way through the park.
The grassland biome, of which the study area was comprised, was the second lowest protected biome within South Africa [79]. The GGHNP was established to protect a pristine area, emphasising conserving the sandstone formation and the montane and Afro-Alpine grassland biome [80]. The park is home to a broad spectrum of floral and faunal diversity [80]. The GGHNP is the province’s tourism hub, owing to its incredible scenery. The park features various soil types, i.e., shallow rocky soils (Glenrosa and Mispah), deep soils along drainage lines (Oakleaf), well-developed sandy soils (Hutton and Clovelly) and clayey soils (Milkwood and Tambakulu). The park is part of the most important water catchment in South Africa, called the Maloti Drakensberg catchment complex [80]. The southern parts of GGHNP drain into the Caledon River. The Caledon River delineates the park’s southwestern boundary and forms the border between South Africa and Lesotho [80]. In the northern section of the park, the Perskeboom and Klerspruit are tributaries which drain towards the Wilge River which is part of the Vaal River basin, which contributes to the water requirements of Gauteng, Mpumalanga, and north-west provinces [81,82]. The Little Caledon River flows about 8 km through the park and drains towards the Gariep Dam and Orange River [80].
According to Köppen–Geiger climate classification, the GGHNP falls under the subtropical highland climate, also known as the Cwb climate subgroup [83]. The Cwb climate subgroup is temperate, with dry winters and warm summers. More than 80% of the precipitation occurs during the austral summer month from October until March, peaking in January with an average of 129 m, and is typically scarce in July in the middle of winter, with an average of 9 mm (Figure 2). Evapotranspiration rates are also high during this period, i.e., October–March (Figure 2a) due to the higher temperature (Figure 2b). Mean monthly minimum and maximum temperatures range from −1.3 °C (July) to 24 °C (January and February).
2.2. Data Acquisition
2.2.1. Historical Fires
Fire data for analysis was obtained from the visible infrared imaging radiometer suite (VIIRS) 375 m thermal anomalies/active fire product, accessed through the Fire Information for Resource Management System (FIRMS) https://firms.modaps.eosdis.nasa.gov/download/ (accessed on 22 March 2022). The VIIRS data, when compared to the moderate resolution imaging spectroradiometer (MODIS), is particularly beneficial for detecting smaller fires and improving the mapping of large fire parameters [85]. The attribute information of each fire point contains latitude, longitude, acquisition date and time, satellite instrument, confidence, version, brightness_T31, Fire Radiative Power (FRP), and day/night. The confidence information is used to determine the quality of individual hotspots or fire pixels, with values set at low (<15 K), nominal (>15 K, free of potential sunlight contamination), and high (day or night-time saturated pixels) [85]. The data became available in 2012; therefore, data spanning from 2012 to 2021 was utilized for the study.
2.2.2. Grassland Fuel
Fuel moisture content, degree of curing (DOC), and health condition are crucial drivers in grassland fires. DOC is the phenomenon of grass senescence, signifying the die-off process and the transformation of live fuels into the dead fuel component [86]. The DOC is a key driver of fire ignition and spread and has long been used in the Australia Fire Danger Rating System [87]. A high percentage of curing is associated with high fuel flammability and a high rate of fire spread. It was demonstrated that fire propagation can occur at curing levels as low as 20% [88]. Vegetation moisture is one of the most essential indicators of potential fire ignition and propagation; hence, several fuel moisture prediction models have been developed for fire danger rating systems [89]. The authors of Ceccato, et al. [90] developed the Global Vegetation Monitoring Index (GVMI) and demonstrated that the index can directly measure vegetation moisture content regardless of species composition. Wang, et al. [91] incorporated GVMI for fire-danger assessment. Higher fuel moisture may decrease the likelihood of fuel ignition.
This study utilized the MODIS Terra MOD09A1 Version 6 product and Sentinel -2 satellite data. The MODIS Terra instrument was launched on 18 December 1999. The MOD09A1 provides surface spectra reflectance of Terra MODIS Bands 1 through 7, and it has been atmospherically corrected [92,93]. Also, it consists of two quality layers and four observation bands with a temporal resolution of a day and a spatial resolution of 500 m [92]. The MODIS data have the advantages of higher spectral and temporal resolutions. The European Space Agency developed Sentinel-2 with a constellation of identical twin satellites, i.e., Sentinel-2A and Sentinel-2B, launched on 23 June 2015 and 7 March 2017, respectively. Sentinel-2 is equipped with an optical instrument payload that captures data in 13 spectral bands. This includes four bands at a spatial resolution of 10 m, six bands at 20 m, and three bands at 60 m. The satellite revisits the equator every 5 days. Each satellite in the Sentinel-2 mission has a single payload called a Multi-Spectral Instrument (MSI). Compared with MODIS data with a solid historical database, Sentinel-2 lacks that quality. Nevertheless, it is more advantageous in spatial resolution and can integrate imagery with compatible sensors [92]. All MODIS and Sentinel-2 satellite imageries were used to compute the Normalized Difference Moisture Index (NDMI), Global Vegetation Monitoring Index (GVMI), normalized difference vegetation index (NDVI), and vegetation condition index (VCI) in GEE. The data spanning from 2007 to 2021 for June to October was selected for the study. This period was selected because it reflects the region’s fire season [94]. Google Earth Engine (GEE) operates a cloud-based computing platform that gives convenient web-based access to numerous catalogues of satellite imagery and other geospatial data in a format that is analysis-ready [36]. Distance from the watercourse is a vital parameter as it affects the fuel moisture content [95] and can also act as a fire break. Data on rivers was extracted from DEM (digital elevation model).
The VCI is good indicator of how dryness affects vegetation is was calculated following Equation (1) [95,96]:
where
where VCI is the vegetation condition index, NDVI (Equation (2)) is the index of greenness, and NDVImin is the index of minimum and NDVImax is the index of maximum greenness. Lower values of VCI indicate severe dryness for vegetation or poor vegetation conditions.
In computing the global vegetation moisture index (GVMI), instead of using bands 6 and 11 of MODIS and Sentinel-2, respectively, this study used bands 7 and 12 reflectance. The GVMI was calculated using Equation (3) [90]:
2.2.3. Topographic Data
Elevation is the vertical distance above sea level at a location on the ground. Lightning strikes are frequent at high elevations, which may increase the likelihood of lightning ignition [95]. Vegetation in high elevations has a higher humidity and a lower temperature and density; hence, it is associated with few fire occurrences. National Aeronautics and Space Administration (NASA, Washington, DC, USA) Shuttle Radar Topography Mission (STRM) 30 m DEM data was downloaded from the USGS (United States Geological Survey, Baltimore, MD, USA) EarthExplorer (http://earthexplorer.usg.gov, accessed on 15 December 2023). Slope, aspect, topographic wetness index (TWI), topographic ruggedness index (TRI), and topographic position index (TPI) data were extracted from the DEM. These variables were selected due to their known influence on fuel type, load, and moisture, particularly when topography interacts with microclimates [97]. Slope is the degree of inclination or steepness of an area [23]. Fires are more likely to spread uphill due to convection, and steeper slopes lead to more fuel preheating [98]. Aspect is defined as the compass direction that the slope faces [23,99]. The aspect facing the sun has lower humidity and, as a result, increases the dryness of combustible materials, leading to low fuel moisture, which increases ignition likelihood [95]. The TPI is calculated using the following Equation (4) [100]:
where M0 represents the elevation of the model point being assessed, Mn denotes the elevation of the grid, and n indicates the total number of surrounding points considered in the evaluation.
If each square represents a grid cell on a DEM, then TRI is calculated following Equation (5) [101]:
where xij is the elevation of each neighbour cell to cell (0,0).
The topographic ruggedness index (TPI) and topographic position index (TPI) were derived from the DEM using Raster analysis GDAL TPI and the TRI tool of QGIS version 3.28.5. The TPI gauges the slope position of the topography by determining the difference from the mean elevation of cells within a specified neighbourhood [101]. Positive TPI values indicate a ridge, negative values indicate a valley, and values around zero indicate a relatively flat landscape [102]. Lightning is prevalent on ridges, which may increase the likelihood of ignition [95]. Ridges or canyons can change prevailing wind patterns by funnelling air, increasing wind speed, and thereby accelerating fire [103]. The TRI measures heterogeneity of topography, computed as the sum of elevation changes between a grid cell and its eight neighbouring grid cells [104]. Lower values of TRI indicate smooth surfaces or level areas, which are classified as having a very high danger of fire [105].
The topographic wetness index (TWI) characterises the propensity of a cell to accumulate water [106]. Hence, it has been used as a proxy for soil moisture. The TWI was computed following Equation (6) [106]:
where α represents the cumulative upslope drainage area through a point, and tan β denotes the slope angle. The higher the TWI values, the wetter the surface, thereby increasing soil moisture. High soil moisture makes the surrounding vegetation harder to ignite [107].
2.2.4. Soil Properties Data
Soil moisture, texture, and soil hydraulic properties such as fractional available water capacity (FAW) or profile available water (PAW) are important indirect drivers of fire ignition and propagation. The relationship between soil and vegetation governs soil’s influence on fire occurrence; some soils support more vegetation than others. Wildfires occur in soils with high sand contents and relatively low clay and silt contents [108]. Sandy soils are known to have low available water capacity, so vegetation on soils with low available water capacity is susceptible to water stress [109]. The higher the sand content, the lower the available water capacity, increasing the likelihood of fire ignition. Relatively high clay and silt content is associated with high soil water retention and available water capacity; thus, less vegetation stress and decreased likelihood of fire ignition. Tanveera, et al. [110] have shown a positive correlation between sand content and soil bulk density; therefore, high bulk density leads to high vegetation water stress. Bulk density serves as an indicator of soil compactness, calculated as the ratio of dry soil mass per unit volume, and it provides insights into soil quality [111]. Wildfire tends to occur less on smaller particle sizes than large particles; the higher the coarse soil content, the higher the likelihood of an increase in fire occurrence. Clay, silt, and sand content and coarse fragments, as well as soil bulk density images, were extracted using the extent of the study area.
Comprehending the structure of ecosystems relies significantly on the study of bare soil, which has emerged as a fundamental influence on ecological functioning [112]. Bare soil can be used as a barrier, can limit the direction and rate of spread, and is an indicator of fuel continuity and load [99]. The bare soil index (BSI) has been employed for distinguishing bare soil from other land use and land cover (LULC) classes [113] and is not widely used as a driving factor for fire danger assessment. The BSI values increase as vegetation density decreases and ground exposure increases [38]. This study adopted the Modified Bare Soil Index (MBI), proposed by Nguyen, et al. [114], as shown in Equation (7):
where SWIR1 and SWIR2 refer to bands 6 and 7 for MODIS and bands 11 and 12 for Sentinel-2 in the shortwave infrared spectrum, with an additional factor denoted as f (where f equals 0.5).
Soil moisture data from June to October for the period of 2007 to 2021 from TerraClimate with a spatial resolution of 4000 m was downloaded from Climate Engine (CE) https://app.climateengine.org/climateEngine (accessed on 22 March 2022) [115]. Soil physical properties, including soil bulk density, coarse fragments, and clay, coarse, sand, and silt contents were acquired from the International Soil Reference and Information Centre (ISRIC) https://soilgrids.org/ (22 March 2022) at 250 m spatial resolution [116]. The total plant available water-holding capacity (TAWCP) was downloaded from African SoilGrids of ISRIC World Soil Information http://africasoils.net/services/data/soil-databases/ (22 March 2022).
2.2.5. Climatic/Weather Data
An increase in land surface temperature (LST) indicates a reduction in fuel moisture content, thus increasing the likelihood of fire ignition. Hence, LST has been used as a driver for fire-danger assessment in numerous studies, e.g., [37,91,117,118,119]. The LST was extracted from MODIS MOD11A2 version 6.1. product (2007–2021) using GEE at a spatial resolution of 1000 m. Wind is known to be one of the most important factors in determining fire dynamics [120,121]. Because of the fanning effect, wind significantly affects the fire ignition and spread [122]. Wind accelerates fuel preheating, reducing fuel moisture and resulting in drier fuel, thus increasing the likelihood of fire ignition and spread. Wind speed data from June to October 2007 to 2021 from TerraClimate with a spatial resolution of 4000 m was downloaded from CE.
2.2.6. Fire Ignition Data
Fire ignition sources can either be caused by humans or natural causes. Natural ignition source includes lightning strikes. Cloud-to-ground (CG) lightning data was acquired from the Southern African Lightning Detection Network (SALDN), operated by the South African Weather Services (SAWS). The improved 2015 network consists of 25 Vaisala CG lightning sensors capable of detecting all CG lightning discharges with a 90% efficiency measure [123]. The SALDN exhibits a lightning detection capability with a location accuracy of ~0.005 degrees, encompassing South Africa, Lesotho, and Swaziland [124,125]. Following the recommendation of the International Electrotechnical Commission Standards (IEC 62858), a minimum of ten years of lightning data is essential to account for short-term scale variations in lightning parameters attributed to diverse meteorological oscillations [126]. Consequently, this study employed lightning strike data spanning 11 years, from January 2007 to December 2017. Anthropogenic ignition sources are related to human presences and activities, such as distance from the road, tourist infrastructure, or housing density—a vector road and infrastructure map was attained from the South African National Parks (SANParks) Scientific Service Department. As a support, Open Street Map data (OSM) was used to download the road, infrastructure, and building maps https://download.geofabrik.de/africa/south-africa.html (accessed on 10 June 2018). Roads may increase the likelihood of intentional “arson” ignition, especially that far from the road and accidental ignition near the road through the discarding of cigarette butts. Other infrastructure and buildings, such as tourist facilities, offices, and staff dwellings, are associated with an increased population, which may increase the likelihood of accidental ignition. Roads not only serve as the source of fire ignition, but roads can also act as barriers or fire breaks and can aid in containing the fire as the roads increase the accessibility, allowing the fire control or firefighters easier access to the fire [38]. The data used in this study are listed in Table 1.
2.3. Wildfire Detection
Firstly, a regular shape file with cell sizes of 0.0001 degrees was created using the fishnet tool in ArcMap 10.7 to create study area polygons. An extract-multiple-values-to-point data tool was applied to extract values of all environmental drivers of fire to a point layer. Fire point data were then joined using Spatial Join Analysis tool with delineated study area polygons to create a binary layer (10 m) indicating the presence and absence of fire polygons. All the polygons with null values for latitude, longitude, and acquisition date were treated as non-fire polygons and denoted a value of 0 for the newly created field name “Fire occurrence” and “1” for the presence of a fire polygon. A binary layer attribute table with associated drivers’ values was then converted into an “XLS” format. The “Fire_Occurrence” field was a dependent variable, and all drivers are independent variables for models and statistical analysis.
2.4. Multicollinearity Analysis
Multicollinearity assessment is the test predominately used for the detection of spatial correlation among independent variables (driving factors) used to model the response variable (fire danger) occurrence [127]. This study used the variance inflation factor (VIF) as a diagnostic tool for the multicollinearity assessment of ordinary least squares (OLS) linear regression analysis. The VIF provides insights into the extent to which the variances of the estimated regression coefficient are increased as a result of correlation among the predictors in the model [128]. The purpose of these analyses was to verify the precision and dependability of the data prior to the modelling process. The OLS analysis was executed using the OLS Modelling Spatial Relationship tool of ArcMap 10.
2.5. Fire-Danger-Assessment Techniques
Fire-danger-assessment modelling was created using QGIS’s susceptibility zoning (SZ) plugin, which was developed for landslide zoning [129]. Nonetheless, it can be utilized to map any kind of danger zoning. The SZ plugin was selected because of its usability, its collector of QGIS processing scripts in Python, which runs as a part of the GIS platform, and its ability to predict and validate fire danger using six (6) built-in different models [130]. Hence, this study utilized all these methods for fire-danger mapping.
2.5.1. Weight of Evidence (WoE)
The weight of evidence (WoE) is a quantitative data-driven approach based on Bayesian principles to integrate spatial datasets [44] and to estimate the relative importance of independent variables on a dependant variable (occurrence). It utilized conditional probabilities statistics to determine weight values of geographic evidence layers that are closely associated with the predicted events [43,44]. These weight values are then used to calculate the probability of events within a given area by superimposing the weight value of each evidence layer that represent the contribution of corresponding evidence factors to event occurrences [131]. Hence, it is based on the concepts of prior and posterior probability [43,46]. The weights were determined using Equations (8) and (9) [44].
where Wi+ signifies the presence of a driving factor at the fire site, and the magnitude of this weight reflects the correlation between that factor and fire occurrence. On the other hand, Wi− denotes the absence of the relevant factor at the fire’s location, indicating an inverse correlation level. The variables Npix1, Npix2, Npix3, and Npix4 are defined as follows: Npix1 represents the number of pixels with fire in the specified class, Npix2 is the total pixels with fire in the entire map minus pixels with fire in the class, Npix3 is the total pixels in the class minus the pixels with fire in the class, and Npix4 is the total pixels in the map minus the pixel with fire in the class.
The contrast in weight (Wf), which measures the magnitude of the spatial relationship between the driving factor and the occurrence of fire, is determined through Equation (10).
2.5.2. Frequency Ratio (FR)
FR is a binary statistical model based on the favourability function [47]. Like WoE, FR describes the importance of classes for each driving factor in relation to the occurrence of fire. However, FR defines the ratio of the probability of fire occurrence to the probability of non-occurrence fire for a given fire driving factors [24,45]. The authors of Mohajane, et al. [24] and Xie, et al. [42] fully explained the calculation of the FR model.
2.5.3. Logistic Regression (LR)
Logistic regression (LR) is a modelling technique that is part of the family of generalized linear models [132] and is one of the popular statistical models utilized effectively to predict fire occurrence and examine the driving factors for fire ignition and propagation. In a regression model, an equation for predicting the value of the dependant variable based on one or more independent predictor variables is developed [133]. In the context of fire-danger-assessment modelling, the goal of LR is to find the best fitting model that can describe the relationship between the existence (1) or absence (0) of fire (i.e., dependent variable) and a set of independent variables (fire-driving factors) [41,133]. The authors of Hong, et al. [41] provide the general form of LR equation.
2.5.4. Decision Tree (DT)
Decision Tree (DT) is a non-parametric, supervised learning approach utilized for classification and prediction. Its easy interpretability and simplicity make DT more transparent for application in decision-support systems [72], and it has a Boolean function (if each decision is binary, i.e., true or false) [42]. DT is based on humanly understandable tree rules (If/Then rules) to extract predictive information. A tree-like structure is designed that kick-starts with all training samples and selects the variable that best fit the class and to make subdirectories [134]. The tree branches are constructed from the test performed at each step by the algorithm on the middle nodes. At each split in the tree, all input attributes are evaluated for their influence on the predictable attribute [135,136]. Predictions of the model are found at the leaves of the tree, also known as final nodes. A detailed description of the DT algorithms for wildfire predictions and classification has been described [71].
2.5.5. Random Forest (RF)
For mapping and modelling wildfires, RF is one of the most effective non-parametric ensemble learning techniques proposed by Breiman in 2001 as an inheritance and improvement of the traditional DT [137]. The efficiency of RF is influenced by two parameters: the number of trees in the forest (ntree) and the number of random variables per split node (mtry) [138,139]. Sharma, et al. [26] thoroughly explained the RF algorithm for the RF classification and regression algorithms.
2.5.6. Support Vector Machine (SVM)
Based on structural risk reduction approaches and statistical learning theory, SVM is one of the most reliable supervised ML techniques for creating a linear hyperplane to divide two classes, e.g., fire and non-fire [70]. The core idea of the SVM model is to establish the classification hyperplane as a decision surface to maximize the isolation edge between positive and negative examples by providing a high generalization performance [140]. The SVM can solve quite well high dimensional and non-linear pattern recognition problems [42] by using its kernel functions. Kernel functions can map the original input space to a new feature space, making samples that are otherwise linearly indistinguishable potentially distinguishable in the kernel space [139].
2.6. The Development of Fire-Danger Maps
A variety of techniques have been applied to categorize fire-danger classes into discrete classes. For example, Eskandari, et al. [141] used natural breaks to classify the Golestan fire-danger map into four classes. Gholamnia, et al. [136] also used the natural breaks as a classifier method for the fire susceptibility map of Amol County in Iran. In this study, receiver operating character (ROC) curves were used to produce a robust classification of the fire-danger map [142]. SZ plugin consists of a new genetic algorithm (GA)-based classifier which is an iterative meta-heuristic method based on the numerical replication of Charles Darwin’s natural selection theory [130]. This study applied this GA-based classifier using the “classify vector by ROC” tool of SZ plugin to develop the fire-danger index (FDI) into five classes. The classifier is based on the quantile classification method; Bustillo Sánchez, et al. [143] applied the method for the spatial assessment of wildfire susceptibility in Santa Cruz, Bolivia. The FDI values were normalized to the range of 0–1 using geomorphometry and Gradient Metric Toolbox. After normalization, each data layer was classified and assigned a numerical rating value ranging between 1 and 5 guided by the fire-danger rating system of the South Africa Department of Agriculture, Forestry and Fisheries, with five classes ranging low (insignificant) to extremely dangerous (extremely high) as shown in Table 2 [144]. Finally, the fire-danger maps of each model were constructed. A zonal statistic tool in ArcMap was used to determine the area coverage of each fire-danger class.
2.7. Model Performance Assessment
The evaluation criteria are key factors in assessing the performance and validation of prediction models [74,145]. Cross-validation is one of the common techniques used for model performance and validation. A simple model fit and a random split in test methods were used for this study as embedded in the SZ plugin. The ability of the fire danger assessment models to predict the spatial distribution of fire and to evaluate the robustness of the model-fitting capacity was achieved using the ROC/AUC curves [37,145]. A useful way to illustrate the effectiveness of the probability maps that specific models predict is to use the ROC/AUC technique [146]. The ROC curve portrays the trade-offs or relation between true positive rates and false positives (FPs), rather than arbitrarily selecting a particular threshold [145]—the SZ plugin plots ROC curves through following Equation (11) [142].
where TPrates stands for sensitivity, TP for true positive, FN for false negative, FRrates for specificity, and FP for false positive.
The dataset was randomly split into two datasets, i.e., 70% and 30% to train and validate the model, respectively [142]. The success and prediction rate curves were displayed in both datasets [146]. How well the modelling outputs fit the training dataset is indicated by the success rate. The prediction rate of the validation dataset indicates how well the model predicts future fires across the landscape of the Golden Gate Highland National Park (GGHNP) [70]. The ROC/AUC values of less than 0.6 indicate poor model performance, while 0.6–0.7 is moderate and 0.7–0.8 is good model performance. ROC/AUC values in the range 0.8–0.9 are very good and greater than 0.9 indicates excellent model performance [70].
2.8. The Importance and Contribution of Driving Factors in Fire-Danger Modelling
Like the GEE classifier, the SZ plugin suffers from the limitation of variable importance analysis. The relative importance and contribution of each driving factor for predicting fire-danger models were determined by using the maximum entropy (MaxEnt) Version 3.4.4 algorithm [22,75,76,147,148]. A major advantage of MaxEnt model is that it allows for the assessment of all the input predictor variables in order of their significance [22]. According to the MaxEnt modelling, the probability distribution with the highest entropy is the best one and the most significant [149]. Furthermore, WoE and FR algorithms can determine the spatial association between the classes of each driving factor and fire occurrence. The Wf (weight of contrast) value and FR were used to determine the spatial correlation between the driving factor and the fire-occurrence probability [44,45,46,136].
2.9. Correlation Analysis
The relationships between the twenty driving factors and the susceptibility index (SI) values from the fire-danger maps were analysed using the multi-environment trial analysis (metan) package in R software Version 4.3.0.
3. Results
3.1. Multicollinearity Assessment
The VIF (variable inflation factor) index results revealed that sand, silt, and clay failed to meet the multicollinearity threshold. Henceforth, these three factors were excluded from the analysis. The list of factors that met the multicollinearity threshold, i.e., attained VIF values of less than 7.5, indicating the least redundancy between variables as explained in the ordinary least squares (OLS) analysis results, are presented in Table 3.
3.2. Fire Danger Maps
Wildfire-danger maps based on six datasets or models consistently depicted the presence of all five (insignificant to extreme high) fire-danger classes across the entire study area, as presented in Figure 3 and Figure 4. The decision tree (DT), frequency ratio (FR) and random forest (RF) models showed the greatest area coverage in the extremely high-danger level or class, while logistic regression (LR), support vector machine (SVM), and weight of evidence (WoE) models showed the greatest area coverage in the moderate danger class (Figure 3). Figure 3 illustrates that DT reported the highest percentage of the extremely high-risk class, i.e., 41.11%, followed by RF (35.68%), FR (32.92%), WoE (26.76%), SVM (16.67), and LR (11.48%). However, the results of the WoE model illustrated that 83% of the study area was in the moderate-, high-, and extremely high-risk classes. The FR, DT, SVM, RF, and LR models recorded were used to record 73.12%, 70.40%, 69.62%, 68.58%, and 66.15%, respectively. All models identified that extremely high-risk areas were mostly concentrated in the southern and south-western parts of the park Figure 4, which are dominated by rocky highland grassland plant communities, including grass species such as Festuca caprine, Themedea triandra, Merxmuellera disticha and Xerophyta viscosa. Also, the eastern part of the study area (Figure 4) dominated by grass species such as Aristida junciformis, Digitaria monodactyla, Heteropogon contortus, Melwilla natalensis, and Adiantum capillus-veneris found at outcrop/middle plateau grassland as well as the grass species found in plateau grassland communities including Cynodon dactylon, Hyparrhenia hirta, Ekebergia capensis, Eriocephalus racemos and Sporobolus africana.
3.3. Model Evaluation
Table 4 presents the ROC/AUC values of all the models, and Figure 5. portrays the ROC/AUC curves from the goodness of fit model results. The DT outperformed the other models with an AUC value of 0.93, while SVM and LR performed poorly, yielding 0.63. The FR, RF, and WoE performed very well; the AUC values were 0.92, 0.91 and 0.83, respectively.
The DT outperformed other models with the highest accuracy value of 0.96, although the model reported the lowest prediction rate. Similarly, both RF and SVM demonstrated poor prediction performances with AUC values of 0.53 and 0.59, respectively. Meanwhile, the LR and FR achieved moderate prediction performances. The WoE was used to record the best prediction rate, i.e., 0.74.
3.4. The Importance of Driving Factors in Fire-Danger Modelling
According to the results of the MaxEnt model analysis in Table 5, bulk density, global vegetation moisture index (GMVI), land surface temperature (LST), proximity from road (prox_road), aspect, proximity from river (prox_river), grass curing index (GCI), soil moisture content (SMC), and wind speed had the most significant impact on influencing the probability of fire occurrence. In contrast, slope, modified bare soil index (MBI), topographic position index (TPI), coarse fragments, and lightning had little impact, and TAWCP had no impact on occurrences of wildfires.
Figure 6 shows the results of the jack-knife test regarding the order of importance of the driving factors in the models. The VCI and LST were the strongest and most influential driving factors of the fire-danger model for the study area; therefore, if excluded from the model, its performance would be considerably reduced. Without the respective application of the BSI, elevation, lightning, slope, and TAWCP in the model, the regularized training gain remained almost the same compared to applying all the variables at once.
3.5. The Spatial Relationship between Fire-Driving Factors and Fire Location
The spatial relationship between fire-driving factors and fire location in the Golden Gate Highlands National Park (GGHNP) was analysed using WoE and FR models. If the FR is greater than one (>1), there is a high correlation, and if it is less than one (<1), there is a low correlation or no causative relationship [39,46]. If the Wf of the WoE is positive, the class of the driving factor has a role in fire occurrence with a positive relation or direct causation. When Wf is zero, the factor is not significant for the analysis. A negative correlation exists if the Wf is negative, i.e., the factor reduces wildfire ignition and spread. The results of the aspect analysis revealed that the class of reliefs oriented towards northeast (NE)-, south (S)-, southeast (SE)-, and southwest (SW)-facing directions had positive Wf values for the Wf and FR >1, with the highest value observed in the NE class. Therefore, the relief oriented towards NE has a strong and causative relationship with the fire occurrence. The flat zones included negative Wf (−1.050) and positive FR (0.552) values.
Considering other topographic factors, the elevation results indicated positive Wf values and FR (>1) values at the altitude ranging from 1976 to 2815 m. The highest scores were observed at the altitude floor 1976–2094 m (0.295; 1.103), followed by 2098–2815 m (0.152; 1.053). The lowest causative relationship was observed at 1779–1875 m (−0.297; 0.894). The 13.77–21.20 degrees (0.325; 1.113)-, and 0–4.68 degrees (−0.392; 0.860)-slope classes had the highest and the lowest impact on the probability of fire occurrence, respectively. The highest and lowest correlation was observed in the classes 0.63–2.0 (0.295; 1.103), and 2.0–13 (−0.264; 0.907), respectively, for the TPI. For the TRI, the highest and the lowest probability of the fire occurrence were observed in the 31.71–117.81 (0.310; 1.108), and 1–6.86 (−0.331; 0.882) classes, respectively. With respect to TWI, a positive causative relationship to the risk of fire was recorded for 3.26–5.06 (0.277; 1.097), 6.22–791 (0.043; 1.015), and 10.71–17.91 (0.006; 1.002) classes. Meanwhile, the 7.91–10.71 (−0.250; 0.910) and 5.06–6.22 (−0.072; 0.975) classes had no effect on the probability of fire occurrence.
Soil bulk density (BD) analysis results revealed that the highest and lowest correlation was observed in the classes of 121–132 (0.516; 1.186) and 141–145 (−0.472–0.840), respectively. Regarding SMC, the highest and lowest impacts on the occurrence of fires were observed in the class of 3.71–4.614 (0.422; 1.139) and 3.181–3.411 (−0.292; 0.898). The soil with coarse fragments between the 103–121 and 121–194 classes, with Wf values and FRs of 0.162;1.057 and 0.161;1.056, respectively, had a high probability of fire occurrence. The negative correlation was observed by the areas with the coarse fragments in the class of 43–103, with Wf and FR values of −0.223; 0.921, −0.057; 0.980, and −0.03; 0.987 for the classes 90–103, 43–75 and 75–90, respectively. For TAWCP, classes 24–25 (0.263; 1.089) and 25–28 (0.249; 1.068) had a positive correlation with fire occurrence, whereas classes 21–24 (−0.618; 0.748) and 28–33 (−0.263; 0.92) showed no effects to fire occurrence.
All classes in the BSI factor had an impact on the probability of fire occurrence except the class 0.391–0.466 (−0.427; 0.848). The highest positive correlation was observed in the class 0.373–0.382 (0.249; 1.087), followed by 0.334–0.365 (0.141; 1.050), 0.382–0.391(0.030; 1.010), and 0.365–0.373 (0.014; 1.050). Similar to BSI, all GCI classes yielded a positive correlation with the fire occurrence except the class 0–30% (−0.572; 0.816). The highest probability of fire occurrence was recorded in the class 60–80% (0.815; 1.304), followed by 50–60% (0.562; 1.211), 30–50% (0.030; 1.007), and 80–100% (0.022; 1.010). In contrast to BSI and GCI, all GVMI classes had no effect on fire occurrence except the class −0.051–0.109, with positive values of Wf (0.704) and FR (1.238). The VCI that recorded the highest probability of fire occurrence existed in the classes 39–82% (0.671; 1.228), 28–33% (0.281; 1.098), and 33–39% (0.180; 1.063). The lowest probability of fire danger was recorded in the classes 9.0–23% (−0.567; 0.798) and 23–28% (0.525; 0.798).
The proximity factors fluctuated more than any other factors; instead of a positive or negative trend, the factors had a mixture of negative and positive correlations. A negative correlation was observed in the 0–200 m (−0.200; 0.925) class and a positive correlation in the 200–400 m (0.060; 1.024) class. Similarly, a negative correlation was observed in the 400–600 m (−0.032; 0.987) class, while positive correlations were evident in the 600–800 m (0.140; 1.057) and more than 1000 m (0.154; 1.036) classes. In terms of proximity from the river, the distance between 200 and 800 m recorded a positive correlation with the occurrence of fire. The area with the highest probability of fire occurrence was the 400–600 m (0.372; 1.146) class. Negative correlations were recorded in the 800–1000 m (−0.269; 0.888) and the more than 1000 m (−0.169; 0.961) classes. The proximity from tourists’ infrastructure and the built environment revealed a positive correlation with fire occurrence in the 0–100 m (0–100 m, 0.177; 1.077), 300–400 m (0.108; 1.047), and more than 500 m (0.432; 1.009) classes. The 100–200 m (−0.642; 0.718), 200–300 m (−1.029; 0.561), and 400–500 m (−0.232; 0.898) classes indicated a negative impact on the probability of fire occurrence.
The results of the lightning factor revealed that a positive correlation with the probability of fire occurrence was observed at level 1 (almost danger-free lightning zone), level 4 (severe danger lightning zone), and level 5 (extremely dangerous lightning area). The highest WoE and FR values were recorded at level 5. The lowest correlation with fire probability was recorded at levels 2 (minimal lightning danger) and 3 (moderate danger of lightning). For LST, the highest and lowest correlations were recorded at the 22–23 °C (0.37; 1.130) and 19–22 °C (−0.209; 0.926) classes, respectively. Regarding wind speed, the area with the highest probability of fire occurrence was observed in class 6.32–11.89 (0.252; 1.088), while the lowest correlation was in class 3.59–4.29 (−0.131; 0.954). Overall, the highest probability of fire danger was observed at the GCI class of 60–80% with the Wf value 0.815 and FR value of 1.304, followed by the GVMI class of −0.005–0.109 (0.704; 1.238), the VCI class of 39–82% (0.671; 1.228), level 5 of lightning danger (0.609; 1.218), and level 1 of the lightning danger area (0.587; 1.243).
3.6. Pairwise Correlations between Wildfire-Driving Factors
As depicted by the Pearson correlation graph (Figure 7), the highest correlation values were computed between the GVMI and VCI (0.71), the GCI and VCI (0.84), the GCI and GVMI (0.85), and slope and the TRI (0.98). Significant negative correlations were recorded for coarse fragments and BD (−0.70), SMC, and BD (−0.71). Therefore, the results indicated that all these factors were important in the fire-danger-assessment modelling process.
4. Discussion
4.1. Model-Performance Assessment
Considering the importance of grassland ecosystems, this study combined twenty driving factors influencing fire occurrence to map fire danger in the Golden Gate Highlands National Park (GGHNP), a montane grassland in Free State Province, South Africa. This study applied conventional statistical and machine learning (ML) methods, i.e., frequency ratio (FR), the weight of evidence (WoE), logistic regression (LR), decision tree (DT), random forest (RF), and support vector machine (SVM). The RF, SVM, and DT models have been proven effective in wildfire modelling [37,42,70,72,73,75,150,151]. The WoE and FR, on the other hand, although outperformed ML models in predicting complex environmental phenomena such as landslides and gullies [130,152,153], their applications in wildfire mapping is very limited [44,45,46]. The RF has been the most accurate algorithm in fire modelling [66].
Although the superior performance of RF was expected, the results from this study revealed that the RF method had a medium performance compared with DT and FR in both overall model goodness of fit and success rate. Furthermore, the RF model was the second least poorly performed in the fire prediction rate; this aligns with previous studies where RF was outperformed by other models [72,146,154]. Although DT and FR models outperformed RF, the three models performed poorly in prediction rate; in fact, DT had the worst prediction accuracy—the FR performance was satisfactory— and it was second best after WoE. The poor performance of the LR model was also observed in previous studies, e.g., [54,136,155,156]. While the WoE had relatively less accuracy than DT, FR and RF outperformed all the models in terms of prediction rate. This demonstrates that WoE can perform just as well as ML models for fire assessment. The capability of WoE to achieve balanced accuracy makes it a better choice for fire-danger-assessment mapping in the study area. Furthermore, Phelps and Woolford [132] have shown that statistical approaches, i.e., logistic GAMs, can perform just as well as ML for fire occurrence predictions; therefore, they should be preferred models for fire-management operations.
The WoE was the best model in terms of prediction rate; however, it was outperformed by DT, FR, and RF models in its accuracy and success rate. This trend might be explained by the complexity–accuracy trade-offs and the implications of complexity in interpretability and prediction. The trade-off is based on the tendency of complex models to outperform simple models [157], and interpretable models are worse performers than difficult to understand “black-box models” [158]. Complex models achieve the best performance at the high price of complexity, while model interpretability and complexity are positively correlated. However, that trend holds under the assumption that the models have been properly parameterized and trained [157]. For example, DT is regarded as an interpretable model and is prone to overfitting if not properly parameterized. RF is robust to overfitting and the model of choice in fire-danger modelling; however, RF is complex and not interpretable because the aggregation step makes it very difficult to trace the outcome of the model back to the input features [157]. In contrast, the WoE is a simple and interpretable model if the data meet the requirements of a simple model (linearity); therefore, WoE is adept at revealing higher performance. This is because this model can perform multiple analyses and generalize information and present outcomes as probabilities, thus offering a robust analytic framework with a straightforward interpretation [159].
A classification analysis of the developed fire-danger maps revealed that the largest percentage of area coverage of the study area was observed from the extreme fire-danger class of the DT model (41.11%), succeeded by RF (35.68%), with the lowest percentage of area coverage derived from the LR model (11.48%). The findings reveal that these models operate on mathematical concepts that do not necessarily lead to the same performance in environmental settings [160]. Furthermore, the asymmetric performance of the models is attributed to the models’ computational algorithms. Decision-tree-based models like the RF algorithm randomly draw samples, generate multiple decision trees, and combine them through averaging or voting in a way that reduces overfitting. The basic algorithm of the LR model considers a linear relationship between a fire occurrence and its driving factors [41] that does not meet the complex nature of phenomena and therefore does not underestimate the probability of fire danger [160]. In comparison with SVM, it can quickly and efficiently implement “transduction” inference using a simple and robust algorithm [161]). However, SVM requires consideration to test different kernel functions and model parameters to find the best model and to create an impractical approach for dealing with large samples of datasets [139].
Several authors have demonstrated the efficacy of WoE in wildfire-mapping research, e.g., those of [44,46,48,162]. Hong, et al. [46] generated a fire-risk map for China using FR, WoE, linear, and quadratic differential analysis models. Their findings showed that WoE had the highest yield (2.82). For the leveraging of the capacity of WoE to deal with generalized and manifold information and to represent a robust framework for studying natural hazards, Jaafari, et al. [48] used it to simulate fire likelihood in the Zagros Mountains of Iran. The results of their study confirmed the predictive ability of the WoE model, with AUC values of 84.2% and 80.4% for success rate and prediction rate, respectively. The authors recommended the model due to its relatively straightforward implementation and interpretation of results, its simplicity and predictive power, ease in incorporating multi-source information and application in a GIS environment, and objectivity [163]. Salavati, et al. [44] assessed fire-danger potential using WoE and Statistical Index (SI) models and compared them; their findings demonstrated the superiority of WoE over SI. The main weakness of WoE is that it neglects the internal correlation among the driving factors incorporated in the model to predict natural hazards [41]. However, incorporating the WoE model with other ML or hybrid models could be an effective solution to this problem. Studies have also suggested coupling WoE with AHP [41] and constructing multimodal ensembles [164]. Hence, in the future, an appropriate ensemble of WoE-like FRs based on [24,42] can be built and tested to improve wildfire modelling.
4.2. The Driving Factors of Fire-Danger-Assessment Modelling
In modelling the fire-danger assessment, it is imperative to analyse the spatial relationship between fire occurrences and their driving factors. This study explored twenty conditioning factors of fire in the Golden Gate Highlands National Park (GGHNP). Regarding the ignition source, proximity from roads, other infrastructures, such as buildings and tourist facilities, and lightning were highly rated. According to WoE and FR, proximity from the road networks and other infrastructures, such as buildings and tourist facilities, does not mean that there exists an inverse relationship with fire occurrence, i.e., the closer to the road, the higher the probability of fire occurrence. A similar observation was made by Bowman, et al. [165] and Ye, et al. [163] that this confusion indicated the existence of more complications and that fire-ignition patterns may be unpredictable, strengthening the novelty of the relationship between human activities and wildfire occurrence as being not linear. Pradeep, et al. [47] also revealed that areas far away from settlements and roads of the Eravikulam National Park in India had a spatial correlation with fire occurrence. Several studies, e.g., [45,95,163,166,167], concluded that fire ignitions exist near roads and other related infrastructure.
The observed fire-ignition pattern for this study can be explained using a saturation curve as described by [20], i.e., mild weather conditions are unlikely to generate wildfires; however, in more severe weather conditions, the probability of fire increases sharply. Therefore, some areas may be limited by natural ignition and saturated by frequent lightning strikes or by human population density, in which case a slight reduction in ignitions may not necessarily reduce the chance of fire occurrence. Even a relatively small number of ignitions can generate fires if coupled with extremely hot weather. The GGHNP is a mountainous protected area, saturated by frequent lightning strikes, as spatial autocorrelation analysis by the authors of Mofokeng, et al. [168] revealed. In the park, the presence of humans is limited, and therefore, the population density is smaller. However, reduced ignition occurrence may be sufficiently compensated for by less-fragmented fuel, resulting in more extensive fires. It takes fewer people to provide a sufficient ignition source, and lightning can provide adequate ignition sources in smaller human populations. Spatially, as per expectation, most fire occurred in class 5, an extremely high lightning-danger zone. However, the class 1 lightning-free danger areas correlate positively with fire-danger probability. Based on this observation, it can be concluded that the fire-ignition pattern of the GGHNP is driven by both anthropogenic and natural sources of ignition.
Lightning and elevation had a positive correlation; this is in agreement with Catry, et al. [169], who found that elevation positively influences ignition distribution and that lightning-caused fires are prevalent in high elevations. The analysis revealed that although fire danger increased with elevation, it dropped slightly at the highest altitude class (>2098). A similar observation was made by Fang, et al. [170] in the boreal forest of the Great Xing’an Mountains, China. The authors suggested that the positive correlation between elevation and fire danger might be possibly attributed to the complex interaction of elevation with fuel and weather. Mpakairi, et al. [148] also found a positive correlation between elevation and fire occurrence while determining the Kavango Zambezi Transfrontier Conservation Area (KAZA-TFCA) fire hotspots in Zimbabwe. According to a recent study by Alizadeh, et al. [171], there is a greater elevational synchronization of fire hazards in western United States (US) mountains, which suggests the existence of a weakened flammability barrier in high elevations due to climate warming. This suggests that in recent decades, higher elevations that were formally sufficiently moist to reduce the risk of fire have started to favour fire activity [172].
The aspect analysis showed a weaker negative correlation with fire occurrence. Chafer, et al. [173] found a non-significant relationship between fire and aspect in the Sydney basin, Australia. A study by the authors of Eskandari, et al. [141] found aspect to be collinear with other fire-conditioning factors and was discarded for fire-danger analysis. In South Africa, the north-facing slopes have more direct sunlight exposure, higher temperatures, less rainfall, and lower humidity [23] and, therefore, have relatively sparser and drier vegetation, which is favourable for fire activities, resulting in higher fire-danger probability. In this study, the northeastern-facing (NE) slopes had the greatest correlation with the fire occurrence probability. Slope had a significant influence and positive correlation with the predicted fire occurrence. Similarly, Argañaraz, et al. [174] found a significant positive correlation between slope and fire frequency. Fires are typically more likely to spread on intermediate slopes than on flat or very steep slopes [95]. Oliveira, et al. [175] reported a similar pattern, whereby very steep slopes had fewer fire activities. Fuel discontinuity might have played a role, as rocky outcrops are inadequate to initiate a fire and are less flammable.
This study found no relationship between topographic water index (TWI) and topographic position index (TPI) and fire occurrence. These findings are consistent with [22,141,151]. In fact, Eskandari, et al. [141] suggested the disqualification of the use of these drivers in fire-danger modelling. The topographic ruggedness index (TRI), a topographic driver that has not yet received much quantitative attention in fire danger research, demonstrated its superiority among frequently used topographic drivers, e.g., elevation and slope. The TRI was the second strongest driver associated with increasing wildfires in Portugal [176]. In general, fire-danger probability decreases with TRI—in contrast, a significant positive correlation between TRI and the predicted fire-danger-assessment map was observed (Figure 7). Spatially, the highest fire-danger areas were on the highest class of the TPI. This pattern might be due to the effect of climate warming. Although the TRI had collinearity with other topographic drivers [26], its superiority to elevation underscores its incorporation in fire-danger modelling.
The global vegetation moisture index (GVMI) was the most important among fuel drivers and the second highest contribution to the model. Generally, the fire-danger probability increases as the GVMI decreases; however, a positive correlation between the GVMI and the predicted fire occurrence was evident (Figure 7)—this might be associated with the threshold related to fuel moisture [20]. The highest GVMI of the study area of 0.12 implies that the vegetation may ignite and propagate easily as the fuel moisture content (FMC) exceeds the fire ignition and spread moisture thresholds at which fire can be sustained. However, it should be noted that the FMC threshold for fire ignition and spread is species-dependent [27]. Consistent with Clarke, et al. [19], the relationship between fuel dryness (GCI) and predicted fire occurrence was positive. According to earlier research, the resource gradient restrictions principle may not be sufficient to maintain the fuel growth necessary to support fire danger in grasslands under conditions favourable to high fuel dryness [177,178].
The probability of fire is expected to be high in areas with a low bare soil index (BSI), as these areas will be highly vegetated, and hence increased availability of fuel to sustain fire [KumariandPandey [38]]. This study met the expectation as a significant inverse relation between the BSI and predicted fire occurrence was observed. Concerning the vegetation condition index (VCI), the strongest contributor to fire-danger modelling, there existed a significant positive relation with wildfire occurrence—spatial analysis revealed the highest fire activity at the highest value of the VCI. This pattern is not surprising; in contrast with woody communities, in grass communities, drought is associated with reduced fire activity [20]. According to the researchers, fire activity is primarily based on grass biomass and fuel continuity; in the grassland ecosystem, drought reduces fuel continuity and, consequently, lessens the spread of fires. Grasses are particularly combustible every year during the dry season. Furthermore, Bowman, et al. [179] observed that during the 2019–2020 Australian fire season, there was a significant rise in the area burned in forests but a decrease in the area burned in grasslands (savannas).
Soil bulk density (BD) was the most important driving factor of the model. Bulk density (BD) captures soil porosity, which can relate to root growth and, therefore, influences plants’ intake of nutrients and water, affecting grass production and, thus, fuel conditions [111]. Bulk density (BD) was also one of the strongest predictors of fuel components for all fuel strata modelling in examining the climatic and edaphic gradient variation in wildland fuel hazards in south-eastern Australia [180]. The study found that the probability of extreme fuel hazards decreased as soil BD increased. Similarly, a significant negative correlation between BD and predicted fire occurrence was observed in this study—the highest values of BD had no impact on the probability of fire danger. The lowest bulk density class had a greater fire activity. This study used coarse fragments as a proxy for soil fertility—soil fertility positively affects grass production [15]. In agreement with the hypothesis of the authors of [15], a significant positive correlation between coarse fragments and predicted fire danger was observed; therefore, fire danger probability increased with the increase in coarse fragments. The spatial relation also revealed that the highest fire activity was at the highest coarse fragment classes. Total plant available water-holding capacity (TAWCP) showed no significant relation with predicted fire occurrence—this could be because the Africa Soil Profile database has data gaps, leading to uncertainty in spatial analysis [181].
Chicas and Østergaard Nielsen [77] classified soil moisture as one of the least driving factors used in fire-danger modelling. However, applying soil moisture data in fire danger rating systems is gaining traction in fire-risk science [182]. Soil moisture does not only influence vegetation growth conditions and thus the accumulation of fire fuel, but also determines the vegetation moisture content and hence the flammability of the vegetation [27,32,183]. Generally, the probability of fire danger decreases as the soil moisture increases. In contrast, a significant positive relation between soil moisture and the predicted fire danger was observed in this study. These findings confirmed the global regression models, suggesting a positive relationship between soil moisture and fire in the montane grassland biomes [177]. This positive trend might have been attributed to chronic lower soil moisture (3.18–4.62 mm). Krueger, et al. [184] have shown that during the dormant season, low dormant season soil moisture may reduce vegetation moisture content, increase their flammability, and accompanying this with extreme weather, could provide a conducive environment for the enhancement of fire activity. Based on this pattern, using a combination of current, near-time, and antecedent soil moisture data is vital to determine the fire–soil moisture relations.
Generally, climatic/weather-driving factors significantly contributed to the fire-danger-assessment modelling, particularly temperature-associated drivers [185]. Temperature correlates positively with fire-danger probability, as high temperatures increase the probability of fire danger, increasing the effect on evapotranspiration rate and flammability [46]. On the contrary, this study revealed a weak, significant negative relationship between LST and the predicted fire occurrence. A similar observation was made by the authors of [7]. The most probable reason might be the climate characteristics of rain and heat synchronization, in that when the moisture is high, fuel does not ignite easily in hot weather [7]. Spatial relation analysis also illustrated that variation as a positive correlation was observed at the area of 22–24 °C and negative at the area with the lowest LST class (19–22 °C) and the highest class (24–25 °C). The assumption is that this spatial variation might be due to the study area’s local specific biophysical and social conditions [51]. The study area is characterized by a diversity of topography and scenic, heritage, or cultural (caves) landscapes. As expected, wind speed was positively related to the predicted fire-danger map. The higher the wind, the higher the evapotranspiration rate, the more oxygen is supplied for fuel combustion, and the higher the flame rate and depth as well as the dispersal of embers speed increase [178]. Spatially, variation was observed in which fire occurrence decreased in the highest class of wind value. The observation confirmed that severe wind events do not usually accompany extreme fire occurrences [178] due to the role of synoptic circulation interacting with topography [186].
5. Conclusions
Understanding the probability of fire ignition and spread is critically important in identifying fire-prone regions, especially in montane grassland ecosystems. Such measures are useful for effective fire preparedness, mitigation planning, and sustaining the ecological and cultural integrity of protected areas (PAs). This study is probably among the first that attempts to map and predict grassland fires in the protected mountainous area using both statistical and machine learning (ML) models. The ROC/AUC results revealed that the weight of evidence (WoE) (0.74) had achieved the highest prediction rates while the decision tree (DT) outperformed other models in success rate (0.96) and model-fit accuracy rate (0.93). The grassland fire-danger maps created by all models revealed extremely high fire-danger areas concentrated in the south-western, south, and eastern part of Golden Gate Highlands National Park (GGHNP), while the DT model classified the largest area coverage of 41.11%. These results revealed that statistical and ML models have individual advantages in wildfire-danger-assessment modelling. The analysis also revealed a trade-off between these techniques. Therefore, this study suggests a hybrid or ensemble approach comprising statistical (WoE), ML, and deep learning methods for improving fire-danger-assessment mapping in the Golden Gate Highlands National Park (GGHNP). Advanced model-fusing techniques should be explored to increase the reliability of the hybrid approaches.
The application of the WoE and frequency ratio (FR) models allowed for discerning that the spatial relationship between fire occurrence and driving factors varied over the different topographic, human, soil, weather, and fuel condition classes. While the MaxEnt method assists in the relative importance assessment of driving factors on the fire-danger modelling, the impact of driving factors on fire danger is complex and cannot be apprehended or explained by a simple monotonic relationship. Overall, spatial analysis revealed that fuel conditions, a grass curing index (GCI) class of 60–80%, a global vegetation moisture index (GVMI) class of −0.005–0.109, and a vegetation condition index (VCI) class of 39–82% as well as a level 5 and level 1 of lightning-danger area had the highest impact on the probability of fire danger. In that, the results revealed that the study area’s fire regime was fuel-driven—this suggests that a fire-management strategy should be based on a fuel-management strategy that considers the local fuel conditions. Therefore, there is an urgent need to identify and determine the thresholds of fuel conditions, especially grass fuel, for fire prevention and control in the study area. Also, this suggests that the fire ignition source of the study area was caused by both anthropogenic and natural causes, with natural-ignition sources dominating fire occurrence, owing to heterogeneity with the mountainous terrain of the GGHNP.
Knowing where and how the key drivers affect wildfires is significant for fire suppression and preparedness and for Sustainable Development Goal 15: life on land, including the protection of natural landscapes and biodiversity and the conservation of mountainous ecosystems. In conclusion, this study provides a novel perspective to fire-danger assessment and modelling methods and offers references for enhancing fire-management strategies in the protected grassland Afromontane of the GGHNP.
Author Contributions
Conceptualization, S.A.A. and O.D.M.; Methodology, S.A.A. and O.D.M.; Formal Analysis, S.A.A. and O.D.M.; Writing—original draft preparation, O.D.M.; Writing—Review and Editing, C.M.J. and S.A.A.; Supervision, S.A.A. All authors have read and agreed to the published version of the manuscript.
Funding
This research received no external funding.
Institutional Review Board Statement
Not applicable.
Informed Consent Statement
Not applicable.
Data Availability Statement
Available upon request.
Conflicts of Interest
The authors declare no conflicts of interest.
References
- Neary, D.G.; Leonard, J.M. Effects of Fire on Grassland Soils and Water: A Review. In Grasses and Grassland Aspects; IntechOpen: London, UK, 2020; pp. 1–22. [Google Scholar]
- O’Mara, F.P. The Role of Grasslands in Food Security and Climate Change. Ann. Bot. 2012, 110, 1263–1270. [Google Scholar] [CrossRef]
- Pausas, J.G.; Keeley, J.E. Wildfires as an Ecosystem Service. Front. Ecol. Environ. 2019, 17, 289–295. [Google Scholar] [CrossRef]
- Cobon, D.H.; Baethgen, W.E.; Landman, W.; Williams, A.; van Garderen, E.A.; Johnston, P.; Malherbe, J.; Maluleke, P.; Kgakatsi, I.B.; Davis, P. Agroclimatology in Grasslands. Agroclimatol. Link. Agric. Clim. 2020, 60, 369–423. [Google Scholar]
- Jolly, W.M.; Cochrane, M.A.; Freeborn, P.H.; Holden, Z.A.; Brown, T.J.; Williamson, G.J.; Bowman, D.M.J.S. Climate-Induced Variations in Global Wildfire Danger from 1979 to 2013. Nat. Commun. 2015, 6, 7537. [Google Scholar] [CrossRef]
- Leys, B.A.; Marlon, J.R.; Umbanhowar, C.; Vannière, B. Global Fire History of Grassland Biomes. Ecol. Evol. 2018, 8, 8831–8852. [Google Scholar] [CrossRef] [PubMed]
- Chang, C.; Chang, Y.; Xiong, Z.; Ping, X.; Zhang, H.; Guo, M.; Hu, Y. Predicting Grassland Fire-Occurrence Probability in Inner Mongolia Autonomous Region, China. Remote Sens. 2023, 15, 2999. [Google Scholar] [CrossRef]
- Bond, W.J.; Keane, R.E. Fires, Ecological Effects Of. In Reference Module in Life Sciences; Elsevier: Amsterdam, The Netherlands, 2017; pp. 1–11. [Google Scholar]
- Bond, W.J.; Keeley, J.E. Fire as a Global Herbivore’: The Ecology and Evolution of Flammable Ecosystems. Trends Ecol. Evol. 2005, 20, 387–394. [Google Scholar] [CrossRef] [PubMed]
- Sharma, S.; Dhakal, K. Boots on the Ground and Eyes in the Sky: A Perspective on Estimating Fire Danger from Soil Moisture Content. Fire 2021, 4, 45. [Google Scholar] [CrossRef]
- Jain, P.; Coogan, S.C.P.; Subramanian, S.G.; Crowley, M.; Taylor, S.; Flannigan, M.D. A Review of Machine Learning Applications in Wildfire Science and Management. Environ. Rev. 2020, 28, 478–505. [Google Scholar] [CrossRef]
- Kraaij, T.; Baard, J.A.; Arndt, J.; Vhengani, L.; Van Wilgen, B.W. An Assessment of Climate, Weather, and Fuel Factors Influencing a Large, Destructive Wildfire in the Knysna Region, South Africa. Fire Ecol. 2018, 14, 4. [Google Scholar] [CrossRef]
- Flores Quiroz, N.; Gibson, L.; Conradie, W.S.; Ryan, P.; Heydenrych, R.; Moran, A.; van Straten, A.; Walls, R. Analysis of the 2017 Knysna Fires Disaster with Emphasis on Fire Spread, Home Losses and the Influence of Vegetation and Weather Conditions: A South African Case Study. Int. J. Disaster Risk Reduct. 2023, 88, 103618. [Google Scholar] [CrossRef]
- Keeley, J.E.; Pausas, J.G. Distinguishing Disturbance from Perturbations in Fire-Prone Ecosystems. Int. J. Wildland Fire 2019, 28, 282–287. [Google Scholar] [CrossRef]
- Archibald, S.; Roy, D.P.; Wilgen, V.; Brian, W.; Scholes, R.J. What Limits Fire? An Examination of Drivers of Burnt Area in Southern Africa. Glob. Chang. Biol. 2009, 15, 613–630. [Google Scholar] [CrossRef]
- White, R.P.; Murray, S.; Rohweder, M.; Prince, S.D.A.; Thompson, K.M. Grassland Ecosystems; World Resources Institute: Washington, DC, USA, 2000. [Google Scholar]
- Rutherford, M.C.; Westfall, R.H. Biomes of Southern Africa: An Objective Categorization; National Botanical Institute: Pretoria, South Africa, 1994. [Google Scholar]
- Carbutt, C.; Henwood, W.D.; Gilfedder, L.A. Global Plight of Native Temperate Grasslands: Going, Going, Gone? Biodivers. Conserv. 2017, 26, 2911–2932. [Google Scholar] [CrossRef]
- Clarke, H.; Penman, T.; Boer, M.; Cary, G.J.; Fontaine, J.B.; Price, O.; Bradstock, R. The Proximal Drivers of Large Fires: A Pyrogeographic Study. Front. Earth Sci. 2020, 8, 90. [Google Scholar] [CrossRef]
- Pausas, J.G.; Keeley, J.E. Wildfires and Global Change. Front. Ecol. Environ. 2021, 19, 387–395. [Google Scholar] [CrossRef]
- Duane, A.; Castellnou, M.; Brotons, L. Towards a Comprehensive Look at Global Drivers of Novel Extreme Wildfire Events. Clim. Change 2021, 165, 43. [Google Scholar] [CrossRef]
- Makhaya, Z.; Odindi, J.; Mutanga, O. The Influence of Bioclimatic and Topographic Variables on Grassland Fire Occurrence within an Urbanized Landscape. Sci. Afr. 2022, 15, e01127. [Google Scholar] [CrossRef]
- Trollope, W.S.W.; de Ronde, C.; Geldenhys, C.J. Fire Behavior. In Wildland Fire Management Handbook for SubSahara Africa; Goldammer, R.C., de Ronde, C., Eds.; Global Fire Monitoring Centre (GFMC): Freiburg, Germany, 2004; pp. 27–59. [Google Scholar]
- Mohajane, M.; Costache, R.; Karimi, F.; Pham, Q.B.; Essahlaoui, A.; Nguyen, H.; Laneve, G.; Oudija, F. Application of Remote Sensing and Machine Learning Algorithms for Forest Fire Mapping in a Mediterranean Area. Ecol. Indic. 2021, 129, 107869. [Google Scholar] [CrossRef]
- Keane, R.E.; Burgan, R.; van Wagtendonk, J. Mapping Wildland Fuels for Fire Management across Multiple Scales: Integrating Remote Sensing, GIS, and Biophysical Modeling. Int. J. Wildland Fire 2001, 10, 301–319. [Google Scholar] [CrossRef]
- Sharma, S.K.; Aryal, J.; Shao, Q.; Rajabifard, A. Characterizing Topographic Influences of Bushfire Severity Using Machine Learning Models: A Case Study in a Hilly Terrain of Victoria, Australia. IEEE J. Sel. Top. Appl. Earth Obs. Remote Sens. 2023, 16, 2791–2807. [Google Scholar] [CrossRef]
- Chuvieco, E.; Aguado, I.; Dimitrakopoulos, A.P. Conversion of Fuel Moisture Content Values to Ignition Potential for Integrated Fire Danger Assessment. Can. J. For. Res. 2004, 34, 2284–2293. [Google Scholar] [CrossRef]
- Verbesselt, J.; Somers, B.; Lhermitte, S.; Jonckheere, I.; Van Aardt, J.; Coppin, P. Monitoring Herbaceous Fuel Moisture Content with Spot Vegetation Time-Series for Fire Risk Prediction in Savanna Ecosystems. Remote Sens. Environ. 2007, 108, 357–368. [Google Scholar] [CrossRef]
- Yebra, M.; Dennison, P.E.; Chuvieco, E.; Riaño, D.; Zylstra, P.; Hunt Jr, E.R.; Danso, F.M.; Qi, Y.; Jurdao, S. A Global Review of Remote Sensing of Live Fuel Moisture Content for Fire Danger Assessment: Moving towards Operational Products. Remote Densing Environ. 2013, 136, 455–468. [Google Scholar] [CrossRef]
- Vinodkumar, V.; Dharssi, I.; Yebra, M.; Fox-Hughes, P. Continental-Scale Prediction of Live Fuel Moisture Content Using Soil Moisture Information. Agric. For. Meteorol. 2021, 307, 108503. [Google Scholar] [CrossRef]
- Sazib, N.; Bolten, J.D.; Mladenova, I.E. Leveraging NASA Soil Moisture Active Passive for Assessing Fire Susceptibility and Potential Impacts over Australia and California. IEEE J. Sel. Top. Appl. Earth Obs. Remote Sens. 2021, 15, 779–787. [Google Scholar] [CrossRef]
- Sungmin, O.; Hou, X.; Orth, R. Observational Evidence of Wildfire-Promoting Soil Moisture Anomalies. Sci. Rep. 2020, 10, 11008. [Google Scholar]
- Chuvieco, E.; Aguado, I.; Salas, J.; García, M.; Yebra, M.; Oliva, P. Satellite Remote Sensing Contributions to Wildland Fire Science and Management. Curr. For. Rep. 2020, 6, 81–96. [Google Scholar] [CrossRef]
- Pettinari, M.L.; Chuvieco, E. Fire Danger Observed from Space. Surv. Geophys. 2020, 41, 1437–1459. [Google Scholar] [CrossRef]
- Szpakowski, D.M.; Jensen, J.L.R. A Review of the Applications of Remote Sensing in Fire Ecology. Remote Sens. 2019, 11, 2638. [Google Scholar] [CrossRef]
- Gorelick, N.; Hancher, M.; Dixon, M.; Ilyushchenko, S.; Thau, D.; Moore, R. Google Earth Engine: Planetary-Scale Geospatial Analysis for Everyone. Remote Sens. Environ. 2017, 202, 18–27. [Google Scholar] [CrossRef]
- Sharma, L.K.; Gupta, R.; Fatima, N. Assessing the Predictive Efficacy of Six Machine Learning Algorithms for the Susceptibility of Indian Forests to Fire. Int. J. Wildland Fire 2022, 31, 735–758. [Google Scholar] [CrossRef]
- Kumari, B.; Pandey, A.C. Geo-Informatics Based Multi-Criteria Decision Analysis (Mcda) through Analytic Hierarchy Process (Ahp) for Forest Fire Risk Mapping in Palamau Tiger Reserve, Jharkhand State, India. J. Earth Syst. Sci. 2020, 129, 1–16. [Google Scholar] [CrossRef]
- Zhao, P.; Zhang, F.; Lin, H.; Xu, S. GIS-Based Forest Fire Risk Model: A Case Study in Laoshan National Forest Park, Nanjing. Remote Sens. 2021, 13, 3704. [Google Scholar] [CrossRef]
- Maniatis, Y.; Doganis, A.; Chatzigeorgiadis, M. Fire Risk Probability Mapping Using Machine Learning Tools and Multi-Criteria Decision Analysis in the Gis Environment: A Case Study in the National Park Forest Dadia-Lefkimi-Soufli, Greece. Appl. Sci. 2022, 12, 2938. [Google Scholar] [CrossRef]
- Hong, H.; Jaafari, A.; Zenner, E.K. Predicting Spatial Patterns of Wildfire Susceptibility in the Huichang County, China: An Integrated Model to Analysis of Landscape Indicators. Ecol. Indic. 2019, 101, 878–891. [Google Scholar] [CrossRef]
- Xie, L.; Zhang, R.; Zhan, J.; Li, S.; Shama, A.; Zhan, R.; Wang, T.; Lv, J.; Bao, X.; Wu, R. Wildfire Risk Assessment in Liangshan Prefecture, China Based on an Integration Machine Learning Algorithm. Remote Sens. 2022, 14, 4592. [Google Scholar] [CrossRef]
- Romero-Calcerrada, R.; Novillo, C.J.; Millington, J.D.A.; Gomez-Jimenez, I. Gis Analysis of Spatial Patterns of Human-Caused Wildfire Ignition Risk in the Sw of Madrid (Central Spain). Landsc. Ecol. 2008, 23, 341–354. [Google Scholar] [CrossRef]
- Salavati, G.; Saniei, E.; Ghaderpour, E.; Hassan, Q.K. Wildfire Risk Forecasting Using Weights of Evidence and Statistical Index Models. Sustainability 2022, 14, 3881. [Google Scholar] [CrossRef]
- de Santana, R.O.; Delgado, R.C.; Schiavetti, A. Modeling Susceptibility to Forest Fires in the Central Corridor of the Atlantic Forest Using the Frequency Ratio Method. J. Environ. Manag. 2021, 296, 113343. [Google Scholar] [CrossRef]
- Hong, H.; Naghibi, S.A.; Moradi Dashtpagerdi, M.; Pourghasemi, H.R.; Chen, W. A Comparative Assessment between Linear and Quadratic Discriminant Analyses (Lda-Qda) with Frequency Ratio and Weights-of-Evidence Models for Forest Fire Susceptibility Mapping in China. Arab. J. Geosci. 2017, 10, 167. [Google Scholar] [CrossRef]
- Pradeep, G.S.; Danumah, J.H.; Nikhil, S.; Prasad, M.K.; Patel, N.; Mammen, P.C.; Rajaneesh, A.; Oniga, V.-E.; Ajin, R.S.; Kuriakose, S.L. Forest Fire Risk Zone Mapping of Eravikulam National Park in India: A Comparison between Frequency Ratio and Analytic Hierarchy Process Methods. Croat. J. For. Eng. J. Theory Appl. For. Eng. 2022, 43, 199–217. [Google Scholar] [CrossRef]
- Jaafari, A.; Gholami, D.M.; Zenner, E.K. A Bayesian Modeling of Wildfire Probability in the Zagros Mountains, Iran. Ecol. Inform. 2017, 39, 32–44. [Google Scholar] [CrossRef]
- Arca, D.; Hacısalihoğlu, M.; Kutoğlu, Ş.H. Producing Forest Fire Susceptibility Map Via Multi-Criteria Decision Analysis and Frequency Ratio Methods. Nat. Hazards 2020, 104, 73–89. [Google Scholar] [CrossRef]
- Abdo, H.G.; Almohamad, H.; Al Dughairi, A.A.; Al-Mutiry, M. Gis-Based Frequency Ratio and Analytic Hierarchy Process for Forest Fire Susceptibility Mapping in the Western Region of Syria. Sustainability 2022, 14, 4668. [Google Scholar] [CrossRef]
- Zapata-Ríos, X.; Lopez-Fabara, C.; Navarrete, A.; Torres-Paguay, S.; Flores, M. Spatiotemporal Patterns of Burned Areas, Fire Drivers, and Fire Probability across the Equatorial Andes. J. Mt. Sci. 2021, 18, 952–972. [Google Scholar] [CrossRef]
- Si, L.; Shu, L.; Wang, M.; Zhao, F.; Chen, F.; Li, W.; Li, W. Study on Forest Fire Danger Prediction in Plateau Mountainous Forest Area. Nat. Hazards Res. 2022, 2, 25–32. [Google Scholar] [CrossRef]
- Tien Bui, D.; Le, K.-T.T.; Nguyen, V.C.; Le, H.D.; Revhaug, I. Tropical Forest Fire Susceptibility Mapping at the Cat Ba National Park Area, Hai Phong City, Vietnam, Using Gis-Based Kernel Logistic Regression. Remote Sens. 2016, 8, 347. [Google Scholar] [CrossRef]
- Guo, F.; Wang, G.; Su, Z.; Liang, H.; Wang, W.; Lin, F.; Liu, A. What Drives Forest Fire in Fujian, China? Evidence from Logistic Regression and Random Forests. Int. J. Wildland Fire 2016, 25, 505–519. [Google Scholar] [CrossRef]
- Brillinger, D.R.; Preisler, H.K.; Benoit, J.W. Probabilistic Risk Assessment for Wildfires. Environmetr. Off. J. Int. Environmetr. Soc. 2006, 17, 623–633. [Google Scholar] [CrossRef]
- Woolford, D.G.; Martell, D.L.; McFayden, C.B.; Evens, J.; Stacey, A.; Wotton, B.M.; Boychuk, D. The Development and Implementation of a Human-Caused Wildland Fire Occurrence Prediction System for the Province of Ontario, Canada. Can. J. For. Res. 2021, 51, 303–325. [Google Scholar] [CrossRef]
- Sá, A.C.L.; Turkman, M.A.A.; Pereira, J.M.C. Exploring Fire Incidence in Portugal Using Generalized Additive Models for Location, Scale and Shape (GAMLSS). Model. Earth Syst. Environ. 2018, 4, 199–220. [Google Scholar] [CrossRef]
- Rodrigues, M.; Jiménez-Ruano, A.; Peña-Angulo, D.; de la Riva, J. A Comprehensive Spatial-Temporal Analysis of Driving Factors of Human-Caused Wildfires in Spain Using Geographically Weighted Logistic Regression. J. Environ. Manag. 2018, 225, 177–192. [Google Scholar] [CrossRef]
- Cao, Q.; Zhang, L.; Su, Z.; Wang, G.; Guo, F. Exploring Spatially Varying Relationships between Forest Fire and Environmental Factors at Different Quantile Levels. Int. J. Wildland Fire 2020, 29, 486–498. [Google Scholar] [CrossRef]
- Cardil, A.; Monedero, S.; Schag, G.; de-Miguel, S.; Tapia, M.; Stoof, C.R.; Silva, C.A.; Mohan, M.; Cardil, A.; Ramirez, J. Fire Behavior Modeling for Operational Decision-Making. Curr. Opin. Environ. Sci. Health 2021, 23, 100291. [Google Scholar] [CrossRef]
- Andrews, P.L. Current Status and Future Needs of the BehavePlus Fire Modeling System. Int. J. Wildland Fire 2013, 23, 21–33. [Google Scholar] [CrossRef]
- Finney, M.A. Farsite, Fire Area Simulator—Model Development and Evaluation; US Department of Agriculture, Forest Service, Rocky Mountain Research Station: Fort Collins, CO, USA, 1998.
- Finney, M.A. An overview of FlamMap fire modeling capabilities. In Fuels Management-How to Measure Success, Proceedings of the RMRS-P-41, Portland, OR, USA, 28–30 March 2006; US Department of Agriculture, Forest Service, Rocky Mountain Research Station: Fort Collins, CO, USA, 2006; pp. 213–220. [Google Scholar]
- Xofis, P.; Tsiourlis, G.; Konstantinidis, P. A Fire Danger Index for the Early Detection of Areas Vulnerable to Wildfires in the Eastern Mediterranean Region. Euro-Mediterr. J. Environ. Integr. 2020, 5, 32. [Google Scholar] [CrossRef]
- Balbi, J.H.; Morandini, F.; Silvani, X.; Filippi, J.B.; Rinieri, F. A Physical Model for Wildland Fires. Combust. Flame 2009, 156, 2217–2230. [Google Scholar] [CrossRef]
- Zacharakis, I.; Tsihrintzis, V.A. Integrated Wildfire Danger Models and Factors: A Review. Sci. Total Environ. 2023, 899, 165704. [Google Scholar] [CrossRef] [PubMed]
- Tymstra, C.; Bryce, R.W.; Wotton, B.M.; Taylor, S.W.; Armitage, O.B. Development and sTructure of Prometheus: The Canadian Wildland Fire Growth Simulation Model; Information Report NOR-X-417; Natural Resources Canada, Canadian Forest Service, Northern Forestry Centre: Edmonton, AB, Canada, 2010.
- Hilton, J.E.; Miller, C.; Sullivan, A.L.; Rucinski, C. Effects of Spatial and Temporal Variation in Environmental Conditions on Simulation of Wildfire Spread. Environ. Model. Softw. 2015, 67, 118–127. [Google Scholar] [CrossRef]
- Ramírez, J.; Monedero, S.; Buckley, D. New Approaches in Fire Simulations Analysis with Wildfire Analyst. In Proceedings of the 5th International Wildland Fire Conference, Sun City, South Africa, 9–13 May 2011. [Google Scholar]
- Jaafari, A.; Pourghasemi, H.R. 28—Factors Influencing Regional-Scale Wildfire Probability in Iran: An Application of Random Forest and Support Vector Machine. In Spatial Modeling in Gis and R for Earth and Environmental Sciences; Pourghasemi, H.R., Gokceoglu, C., Eds.; Elsevier: Amsterdam, The Netherlands, 2019; pp. 607–619. [Google Scholar] [CrossRef]
- Jaafari, A.; Zenner, E.K.; Pham, B.T. Wildfire Spatial Pattern Analysis in the Zagros Mountains, Iran: A Comparative Study of Decision Tree Based Classifiers. Ecol. Inform. 2018, 43, 200–211. [Google Scholar] [CrossRef]
- Coffield, S.R.; Graff, C.A.; Chen, Y.; Smyth, P.; Foufoula-Georgiou, E.; Randerson, J.T. Machine Learning to Predict Final Fire Size at the Time of Ignition. Int. J. Wildland Fire 2019, 28, 861–873. [Google Scholar] [CrossRef]
- Hong, H.; Tsangaratos, P.; Ilia, I.; Liu, J.; Zhu, A.X.; Xu, C. Applying Genetic Algorithms to Set the Optimal Combination of Forest Fire Related Variables and Model Forest Fire Susceptibility Based on Data Mining Models. The Case of Dayu County, China. Sci. Total Environ. 2018, 630, 1044–1056. [Google Scholar] [CrossRef] [PubMed]
- Sokolova, M.; Lapalme, G. A Systematic Analysis of Performance Measures for Classification Tasks. Inf. Process. Manag. 2009, 45, 427–437. [Google Scholar] [CrossRef]
- Adab, H.; Atabati, A.; Oliveira, S.; Moghaddam Gheshlagh, A. Assessing Fire Hazard Potential and Its Main Drivers in Mazandaran Province, Iran: A Data-Driven Approach. Environ. Monit. Assess. 2018, 190, 1–20. [Google Scholar] [CrossRef]
- Vacchiano, G.; Foderi, C.; Berretti, R.; Marchi, E.; Motta, R. Modeling Anthropogenic and Natural Fire Ignitions in an Inner-Alpine Valley. Nat. Hazards Earth Syst. Sci. 2018, 18, 935–948. [Google Scholar] [CrossRef]
- Chicas, S.D.; Østergaard Nielsen, J. Who Are the Actors and What Are the Factors That Are Used in Models to Map Forest Fire Susceptibility? A Systematic Review. Nat. Hazards 2022, 114, 2417–2434. [Google Scholar] [CrossRef]
- Abatzoglou, J.T.; Williams, A.P.; Barbero, R. Global Emergence of Anthropogenic Climate Change in Fire Weather Indices. Geophys. Res. Lett. 2019, 46, 326–336. [Google Scholar] [CrossRef]
- Statistics South Africa (StatisticsSA). Natural Capital Series 2: Accounts for Protected Areas, 1900 to 2020; Fisheries and the Environment The South African National Biodiversity Institute and the Department of Forestry, Statistics South Africa: Pretoria, South Africa, 2021.
- South African National Parks (SANParks). Golden Gate Highlands National Park Management Plan 2020–2029. Available online: https://www.sanparks.org/assets/docs/conservation/park_man/gghnp_approved_plan.pdf (accessed on 10 March 2021).
- Russell, I.A.; Skelton, P.H. Freshwater Fishes of Golden Gate Highlands National Park. Koedoe 2005, 48, 87–94. [Google Scholar] [CrossRef]
- Moloi, M.; Ogbeide, O.; Otomo, P.V. Probabilistic Health Risk Assessment of Heavy Metals at Wastewater Discharge Points within the Vaal River Basin, South Africa. Int. J. Hyg. Environ. Health 2020, 224, 113421. [Google Scholar] [CrossRef]
- Spatial Temporal Evidence for Planning South Africa (stepSA). Climate Indicators: Köppen-Geiger Climate Classification. CSIR. Available online: http://stepsatest.csir.co.za/climate_koppen_geiger.html (accessed on 10 March 2021).
- Climate Engine. Cloud Computing of Climate and Remote Sensing Data.Desert Research Institute and University of Idaho. 2023. Available online: https://app.climateengine.org/climateEnginehttps://app.climateengine.org/climateEngine (accessed on 10 March 2021).
- Schroeder, W.; Giglio, L. Visible Infrared Imaging Radiometer Suite (Viirs) 375 M & 750 M Active Fire Detection Data Sets Based on Nasa Viirs Land Science Investigator Processing System (Sips) Reprocessed Data—Version 1; NASA: Washington, DC, USA, 2017.
- Duff, T.J.; Bessell, R.; Cruz, M.G. Grass curing/cured fuels. In Encyclopedia of Wildfires and Wildland-Urban Interface (Wui) Fires; Springer: Berlin/Heidelberg, Germany, 2020; pp. 551–557. [Google Scholar]
- Martin, D.; Chen, T.; Nichols, D.; Bessell, R.; Kidnie, S.; Alexander, J. Integrating Ground and Satellite-Based Observations to Determine the Degree of Grassland Curing. Int. J. Wildland Fire 2015, 24, 329–339. [Google Scholar] [CrossRef]
- Cruz, M.G.; Gould, J.S.; Kidnie, S.; Bessell, R.; Nichols, D.; Slijepcevic, A. Effects of Curing on Grassfires: II. Effect of Grass Senescence on the Rate of Fire Spread. Int. J. Wildland Fire 2015, 24, 838–848. [Google Scholar] [CrossRef]
- Zacharakis, I.; Tsihrintzis, V.A. Environmental Forest Fire Danger Rating Systems and Indices around the Globe: A Review. Land 2023, 12, 194. [Google Scholar] [CrossRef]
- Ceccato, P.; Gobron, N.; Flasse, S.; Pinty, B.; Tarantola, S. Designing a Spectral Index to Estimate Vegetation Water Content from Remote Sensing Data: Part 1: Theoretical Approach. Remote Sens. Environ. 2002, 82, 188–197. [Google Scholar] [CrossRef]
- Wang, L.; Zhou, Y.; Zhou, W.; Wang, S. Fire Danger Assessment with Remote Sensing: A Case Study in Northern China. Nat. Hazards 2013, 65, 819–834. [Google Scholar] [CrossRef]
- Misra, G.; Cawkwell, F.; Wingler, A. Status of Phenological Research Using Sentinel-2 Data: A Review. Remote Sens. 2020, 12, 2760. [Google Scholar] [CrossRef]
- Vermote, E. “Mod09a1 Modis/Terra Surface Reflectance 8-Day L3 Global 500m Sin Grid V006.” NASA EODIS Land Processes DAAC. Available online: http://doi.org/10.5067/MODIS/MOD09A1.006 (accessed on 10 June 2019).
- Strydom, S.; Savage, M.J. A Spatio-Temporal Analysis of Fires in South Africa. S. Afr. J. Sci. 2016, 112, 2760. [Google Scholar] [CrossRef] [PubMed]
- Clarke, H.; Gibson, R.; Cirulis, B.; Bradstock, R.A.; Penman, T.D. Developing and Testing Models of the Drivers of Anthropogenic and Lightning-Caused Wildfire Ignitions in South-Eastern Australia. J. Environ. Manag. 2019, 235, 34–41. [Google Scholar] [CrossRef] [PubMed]
- Martín, Y.; Zúñiga-Antón, M.; Rodrigues Mimbrero, M. Modelling Temporal Variation of Fire-Occurrence towards the Dynamic Prediction of Human Wildfire Ignition Danger in Northeast Spain. Geomat. Nat. Hazards Risk 2019, 10, 385–411. [Google Scholar] [CrossRef]
- Moreira, F.; Viedma, O.; Arianoutsou, M.; Curt, T.; Koutsias, N.; Rigolot, E.; Barbati, A.; Corona, P.; Vaz, P.; Xanthopoulos, G. Landscape–Wildfire Interactions in Southern Europe: Implications for Landscape Management. J. Environ. Manag. 2011, 92, 2389–2402. [Google Scholar] [CrossRef]
- Morandini, F.; Silvani, X.; Dupuy, J.-L.; Susset, A. Fire Spread across a Sloping Fuel Bed: Flame Dynamics and Heat Transfers. Combust. Flame 2018, 190, 158–170. [Google Scholar] [CrossRef]
- The COMET Program. S-290 Unit 2: Topographic Influences on Wildland Fire Behaviour. The University Corporation for Atmospheric Research. Available online: https://www.meted.ucar.edu/fire/s290/unit2/index.htm (accessed on 11 September 2022).
- Weiss, A. Topographic Position and Landforms Analysis. In Proceedings of the ESRI User Conference, San Diego, CA, USA, 9–13 July 2001; pp. 227–245. [Google Scholar]
- De Reu, J.; Bourgeois, J.; Bats, M.; Zwertvaegher, A.; Gelorini, V.; De Smedt, P.; Chu, W.; Antrop, M.; De Maeyer, P.; Finke, P. Application of the Topographic Position Index to Heterogeneous Landscapes. Geomorphology 2013, 186, 39–49. [Google Scholar] [CrossRef]
- Bowman, D.M.J.S.; Williamson, G.J.; Gibson, R.K.; Bradstock, R.A.; Keenan, R.J. The Severity and Extent of the Australia 2019–20 Eucalyptus Forest Fires Are Not the Legacy of Forest Management. Nat. Ecol. Evol. 2021, 5, 1003–1010. [Google Scholar] [CrossRef] [PubMed]
- Viegas, D.X.; Pita, L.P. Fire Spread in Canyons. Int. J. Wildland Fire 2004, 13, 253–274. [Google Scholar] [CrossRef]
- Riley, S.J.; DeGloria, S.D.; Elliot, R. Index that Quantifies Topographic Heterogeneity. Intermt. J. Sci. 1999, 5, 23–27. [Google Scholar]
- Babu, K.V.S.; Roy, A. Static Fire Danger Estimation Based on the Historical Modis Hotspot Data Using Geospatial Techniques for the Uttarakhand State, India. Int. Soc. Environ. Inf. Sci. 2020, 4, 11–21. [Google Scholar] [CrossRef]
- Mattivi, P.; Franci, F.; Lambertini, A.; Bitelli, G. TWI Computation: A Comparison of Different open Source Giss. Open Geospat. Data Softw. Stand. 2019, 4, 1–12. [Google Scholar] [CrossRef]
- Zhao, L.; Yebra, M.; van Dijk, A.I.J.M.; Cary, G.J.; Matthews, S.; Sheridan, G. The Influence of Soil Moisture on Surface and Sub-Surface Litter Fuel Moisture Simulation at Five Australian Sites. Agric. For. Meteorol. 2021, 298, 108282. [Google Scholar] [CrossRef]
- Mathu, L.F.A. How Soil Texture and Groundwater Level Drive Wildfire Occurrence in North-Western Europe. Master’s Thesis, Wageningen University & Research, Wageningen, The Netherlands, 2020. [Google Scholar]
- Mulder, V.L.; van Eck, C.M.; Friedlingstein, P.; Arrouays, D.; Regnier, P. Controlling Factors for Land Productivity under Extreme Climatic Events in Continental Europe and the Mediterranean Basin. Catena 2019, 182, 104124. [Google Scholar] [CrossRef]
- Tanveera, A.; Kanth, T.A.; Tali, P.A.; Naikoo, M. Relation of Soil Bulk Density with Texture, Total Organic Matter Content and Porosity in the Soils of Kandi Area of Kashmir Valley, India. Int. Res. J. Earth Sci 2016, 4, 1–6. [Google Scholar]
- Mora, J.L.; Lázaro, R. Seasonal Changes in Bulk Density under Semiarid Patchy Vegetation: The Soil Beats. Geoderma 2014, 235, 30–38. [Google Scholar] [CrossRef]
- Biancari, L.; Aguiar, M.R.; Cipriotti, P.A. Grazing Impact on Structure and Dynamics of Bare Soil Areas in a Patagonian Grass-shrub Steppe. J. Arid. Environ. 2020, 179, 104197. [Google Scholar] [CrossRef]
- Novkovic, I.; Markovic, G.B.; Lukic, D.; Dragicevic, S.; Milosevic, M.; Djurdjic, S.; Samardzic, I.; Lezaic, T.; Tadic, M. Gis-Based Forest Fire Susceptibility Zonation with Iot Sensor Network Support, Case Study—Nature Park Golija, Serbia. Sensors 2021, 21, 6520. [Google Scholar] [CrossRef]
- Nguyen, C.T.; Chidthaisong, A.; Kieu Diem, P.; Huo, L.-Z. A Modified Bare Soil Index to Identify Bare Land Features during Agricultural Fallow-Period in Southeast Asia Using Landsat 8. Land 2021, 10, 231. [Google Scholar] [CrossRef]
- Huntington, J.L.; Hegewisch, K.C.; Daudert, B.; Morton, C.G.; Abatzoglou, J.T.; McEvoy, D.J.; Erickson, T. Climate Engine: Cloud Computing and visualIzation of Climate And Remote Sensing Data for Advanced Natural Resource Monitoring and Process Understanding. Bull. Am. Meteorol. Soc. 2017, 98, 2397–2410. [Google Scholar] [CrossRef]
- Hengl, T.; Mendes de Jesus, J.; Heuvelink, G.B.; Ruiperez Gonzalez, M.; Kilibarda, M.; Blagotić, A.; Shangguan, W.; Wright, M.N.; Geng, X.; Bauer-Marschallinger, B. oilgrids250m: Global Gridded Soil Information Based on Machine Learning. PLoS ONE 2017, 12, e0169748. [Google Scholar] [CrossRef] [PubMed]
- Dang, A.T.N.; Kumar, L.; Reid, M.; Mutanga, O. Fire Danger Assessment Using Geospatial Modelling in Mekong Delta, Vietnam: Effects on Wetland Resources. Remote Sens. Appl. Soc. Environ. 2021, 21, 100456. [Google Scholar] [CrossRef]
- Kondylatos, S.; Prapas, I.; Ronco, M.; Papoutsis, I.; Camps-Valls, G.; Piles, M.; Fernández-Torres, M.-Á.; Carvalhais, N. Wildfire Danger Prediction and Understanding with Deep Learning. Geophys. Res. Lett. 2022, 49, e2022GL099368. [Google Scholar] [CrossRef]
- Sayad, Y.O.; Mousannif, H.; Al Moatassime, H. Predictive Modeling of Wildfires: A New Dataset and Machine Learning Approach. Fire Saf. J. 2019, 104, 130–146. [Google Scholar] [CrossRef]
- Cruz, M.G.; Alexander, M.E. The 10% Wind Speed Rule of Thumb for Estimating a Wildfire’s Forward Rate of Spread in Forests and Shrublands. Ann. For. Sci. 2019, 76, 44. [Google Scholar] [CrossRef]
- Moon, K.; Duff, T.J.; Tolhurst, K.G. Characterising Forest Wind Profiles for Utilisation in Fire Spread Models. In Proceedings of the Twentieth International Congress on Modelling and Simulation, Adelaide, Australia, 1–6 December 2013. [Google Scholar]
- Ghodrat, M.; Shakeriaski, F.; Nelson, D.J.; Simeoni, A. Existing Improvements in Simulation of Fire–Wind Interaction and Its Effects on Structures. Fire 2021, 4, 27. [Google Scholar] [CrossRef]
- Evert, C.; Gijben, M. Official South African Lightning Ground Flash Density Map 2006 to 2017. In Inaugural Earthing Africa Symposium and Exhibition; Thaba Eco Hotel: Johannesburg, South Africa, 2017; pp. 5–9. [Google Scholar]
- Bhavika, B. The Influence of Terrain Elevation on Lightning Density in South Africa; University of Johannesburg: Johannesburg, South Africa, 2010. [Google Scholar]
- Gijben, M.; Dyson, L.L.; Loots, M.T. A Statistical Scheme to Forecast the Daily Lightning Threat over Southern Africa Using the Unified Model. Atmos. Res. 2017, 194, 78–88. [Google Scholar] [CrossRef]
- Javor, V.; Stoimenov, L.; Džaković, N.; Dinkić, N.; Javor, D.; Betz, H.D. Linetgis Analysis of Lightning Flash Density in Serbia Based on Ten Years Data. Serbian J. Electr. Eng. 2018, 15, 201–211. [Google Scholar] [CrossRef]
- Daoud, J.I. Multicollinearity and Regression Analysis. J. Phys. Conf. Ser. 2017, 949, 012009. [Google Scholar] [CrossRef]
- Akinwande, M.O.; Dikko, H.G.; Samson, A. Variance Inflation Factor: As a Condition for the Inclusion of Suppressor Variable(s) in Regression Analysis. Open J. Stat. 2015, 5, 754. [Google Scholar] [CrossRef]
- Titti, G.; Alessandro, S. Cnr-Irpi-Padova/Sz: Sz Plugin. Available online: https://zenodo.org/record/3843276 (accessed on 1 February 2022).
- Titti, G.; Sarretta, A.; Lombardo, L.; Crema, S.; Pasuto, A.; Borgatti, L. Mapping Susceptibility with Open-Source Tools: A New Plugin for Qgis. Front. Earth Sci. 2022, 10, 842425. [Google Scholar] [CrossRef]
- Bonham-Carter, G. Geographic Information Systems for Geoscientists: Modelling with Gis; Elsevier: Amsterdam, The Netherlands, 1994. [Google Scholar]
- Phelps, N.; Woolford, D.G. Comparing Calibrated Statistical and Machine Learning Methods for Wildland Fire Occurrence Prediction: A Case Study of Human-Caused Fires in Lac La Biche, Alberta, Canada. Int. J. Wildland Fire 2021, 30, 850–870. [Google Scholar] [CrossRef]
- Pham, B.T.; Jaafari, A.; Avand, M.; Al-Ansari, N.; Dinh Du, T.; Yen, H.P.H.; Phong, T.V.; Nguyen, D.H.; Le, H.V.; Mafi-Gholami, D. Performance Evaluation of Machine Learning Methods for Forest Fire Modeling and Prediction. Symmetry 2020, 12, 1022. [Google Scholar] [CrossRef]
- Debeljak, M.; Džeroski, S. Decision Trees in Ecological Modelling. In Modelling Complex Ecological Dynamics: An Introduction into Ecological Modelling for Students, Teachers & Scientists; Jopp, F., Reuter, H., Breckling, B., Eds.; Springer: Berlin/Heidelberg, Germany, 2011; pp. 197–209. [Google Scholar] [CrossRef]
- Tang, Z.; Maclennan, J. Data Mining with SQL Server 2005; John Wiley & Sons: Hoboken, NJ, USA, 2005. [Google Scholar]
- Gholamnia, K.; Gudiyangada Nachappa, T.; Ghorbanzadeh, O.; Blaschke, T. Comparisons of Diverse Machine Learning Approaches for Wildfire Susceptibility Mapping. Symmetry 2020, 12, 604. [Google Scholar] [CrossRef]
- Breiman, L. Random Forests. Mach. Learn. 2001, 45, 5–32. [Google Scholar] [CrossRef]
- Su, Z.; Hu, H.; Wang, G.; Ma, Y.; Yang, X.; Guo, F. Using Gis and Random Forests to Identify Fire Drivers in a Forest City, Yichun, China. Geomat. Nat. Hazards Risk 2018, 9, 1207–1229. [Google Scholar] [CrossRef]
- Tan, C.; Feng, Z. Mapping Forest Fire Risk Zones Using Machine Learning Algorithms in Hunan Province, China. Sustainability 2023, 15, 6292. [Google Scholar] [CrossRef]
- Pang, Y.; Li, Y.; Feng, Z.; Feng, Z.; Zhao, Z.; Chen, S.; Zhang, H. Forest Fire Occurrence Prediction in China Based on Machine Learning Methods. Remote Sens. 2022, 14, 5546. [Google Scholar] [CrossRef]
- Eskandari, S.; Pourghasemi, H.R.; Tiefenbacher, J.P. Fire-Susceptibility Mapping in the Natural Areas of Iran Using New and Ensemble Data-Mining Models. Environ. Sci. Pollut. Res. 2021, 28, 47395–47406. [Google Scholar] [CrossRef] [PubMed]
- Titti, G.; van Westen, C.; Borgatti, L.; Pasuto, A.; Lombardo, L. When Enough is Really Enough? On the Minimum Number of Landslides to Build Reliable Susceptibility Models. Geosciences 2021, 11, 469. [Google Scholar] [CrossRef]
- Bustillo Sánchez, M.; Tonini, M.; Mapelli, A.; Fiorucci, P. Spatial Assessment of Wildfires Susceptibility in Santa Cruz (Bolivia) Using Random Forest. Geosciences 2021, 11, 224. [Google Scholar] [CrossRef]
- Adelabu, S.A.; Adepoju, K.A.; Mofokeng, O.D. Estimation of Fire Potential Index in Mountainous Protected Region Using Remote Sensing. Geocarto Int. 2020, 35, 29–46. [Google Scholar] [CrossRef]
- Zhang, G.; Wang, M.; Liu, K. Forest Fire Susceptibility Modeling Using a Convolutional Neural Network for Yunnan Province of China. Int. J. Disaster Risk Sci. 2019, 10, 386–403. [Google Scholar] [CrossRef]
- Pourtaghi, Z.S.; Pourghasemi, H.R.; Aretano, R.; Semeraro, T. Investigation of General Indicators Influencing on Forest Fire and Its Susceptibility Modeling Using Different Data Mining Techniques. Ecol. Indic. 2016, 64, 72–84. [Google Scholar] [CrossRef]
- Molina, J.R.; Lora, A.; Prades, C.; Silva, F.R. Roadside Vegetation Planning and Conservation: New Approach to Prevent and Mitigate Wildfires Based on Fire Ignition Potential. For. Ecol. Manag. 2019, 444, 163–173. [Google Scholar] [CrossRef]
- Mpakairi, K.S.; Tagwireyi, P.; Ndaimani, H.; Madiri, H.T. Distribution of Wildland Fires and Possible Hotspots for the Zimbabwean Component of Kavango-Zambezi Transfrontier Conservation Area. S. Afr. Geogr. J. 2019, 101, 110–120. [Google Scholar] [CrossRef]
- Phillips, S.J.; Anderson, R.P.; Schapire, R.E. Maximum Entropy Modeling of Species Geographic Distributions. Ecol. Model. 2006, 190, 231–259. [Google Scholar] [CrossRef]
- Milanović, S.; Marković, N.; Pamučar, D.; Gigović, L.; Kostić, P.; Milanović, S.D. Forest Fire Probability Mapping in Eastern Serbia: Logistic Regression Versus Random Forest Method. Forests 2021, 12, 5. [Google Scholar] [CrossRef]
- Eskandari, S.; Pourghasemi, H.R.; Tiefenbacher, J.P. Relations of Land Cover, Topography, and Climate to Fire Occurrence in Natural Regions of Iran: Applying New Data Mining Techniques for Modeling and Mapping Fire Danger. For. Ecol. Manag. 2020, 473, 118338. [Google Scholar] [CrossRef]
- Lee, S.; Pradhan, B. Landslide Hazard Mapping at Selangor, Malaysia Using Frequency Ratio and Logistic Regression Models. Landslides 2007, 4, 33–41. [Google Scholar] [CrossRef]
- Dube, F.; Nhapi, I.; Murwira, A.; Gumindoga, W.; Goldin, J.; Mashauri, D.A. Potential of Weight of Evidence Modelling for Gully Erosion Hazard Assessment in Mbire District–Zimbabwe. Phys. Chem. Earth Parts A/B/C 2014, 67, 145–152. [Google Scholar] [CrossRef]
- Dutta, R.; Das, A.; Aryal, J. Big Data Integration Shows Australian Bush-Fire Frequency is Increasing Significantly. R. Soc. Open Sci. 2016, 3, 150241. [Google Scholar] [CrossRef]
- Jafari Goldarag, Y.; Mohammadzadeh, A.; Ardakani, A.S. Fire Risk Assessment Using Neural Network and Logistic Regression. J. Indian Soc. Remote Sens. 2016, 44, 885–894. [Google Scholar] [CrossRef]
- Shmuel, A.; Heifetz, E. Global Wildfire Susceptibility Mapping Based on Machine Learning Models. Forests 2022, 13, 1050. [Google Scholar] [CrossRef]
- Gauriau, O.; Galárraga, L.; Brun, F.; Termier, A.; Davadan, L.; Joudelat, F. Comparing Machine-Learning Models of Different Levels of Complexity for Crop Protection: A Look into the Complexity-Accuracy Tradeoff. Smart Agric. Technol. 2024, 7, 100380. [Google Scholar] [CrossRef]
- Bell, A.; Solano-Kamaiko, I.; Nov, O.; Stoyanovich, J. It’s Just Not That Simple: An Empirical Study of the Accuracy-Explainability Trade-Off in Machine Learning for Public Policy. In Proceedings of the 2022 ACM Conference on Fairness, Accountability, and Transparency, Seoul, Republic of Korea, 21–24 June 2022. [Google Scholar]
- Wang, W.; Fang, X.; Wei, X.; Ye, J. Optimized Stratification Approach Enhances the Weight-of-Evidence Method: Transparently Uncovering Wildfire Probability and Drivers-Wildfire Relationships in the Southwest Mountains of China. Ecol. Indic. 2024, 158, 111500. [Google Scholar] [CrossRef]
- Jaafari, A.; Mafi-Gholami, D.; Thai Pham, B.; Tien Bui, D. Wildfire Probability Mapping: Bivariate vs. Multivariate Statistics. Remote Sens. 2019, 11, 618. [Google Scholar] [CrossRef]
- Li, Y.; Feng, Z.; Chen, S.; Zhao, Z.; Wang, F. Application of the Artificial Neural Network and Support Vector Machines in Forest Fire Prediction in the Guangxi Autonomous Region, China. Discret. Dyn. Nat. Soc. 2020, 2020, 5612650. [Google Scholar] [CrossRef]
- Dickson, B.G.; Prather, J.W.; Xu, Y.; Hampton, H.M.; Aumack, E.N.; Sisk, T.D. Mapping the Probability of Large Fire Occurrence in Northern Arizona, USA. Landsc. Ecol. 2006, 21, 747–761. [Google Scholar] [CrossRef]
- Ye, J.; Wu, M.; Deng, Z.; Xu, S.; Zhou, R.; Clarke, K.C. Modeling the Spatial Patterns of Human Wildfire Ignition in Yunnan Province, China. Appl. Geogr. 2017, 89, 150–162. [Google Scholar] [CrossRef]
- Yu, Y.; Mao, J.; Wullschleger, S.D.; Chen, A.; Shi, X.; Wang, Y.; Hoffman, F.M.; Zhang, Y.; Pierce, E. Machine Learning–Based Observation-Constrained Projections Reveal Elevated Global Socioeconomic Risks from Wildfire. Nat. Commun. 2022, 13, 1250. [Google Scholar] [CrossRef] [PubMed]
- Bowman, D.M.J.S.; Balch, J.; Artaxo, P.; Bond, W.J.; Cochrane, M.A.; D’antonio, C.M.; DeFries, R.; Johnston, F.H.; Keeley, J.E.; Krawchuk, M.A. The Human Dimension of Fire Regimes on Earth. J. Biogeogr. 2011, 38, 2223–2236. [Google Scholar] [CrossRef] [PubMed]
- Costafreda-Aumedes, S.; Comas, C.; Vega-Garcia, C. Human-Caused Fire Occurrence Modelling in Perspective: A Review. Int. J. Wildland Fire 2017, 26, 983–998. [Google Scholar] [CrossRef]
- Dorph, A.; Marshall, E.; Parkins, K.A.; Penman, T.D. Modelling Ignition Probability for Human-and Lightning-Caused Wildfires in Victoria, Australia. Nat. Hazards Earth Syst. Sci. 2022, 22, 3487–3499. [Google Scholar] [CrossRef]
- Mofokeng, D.O.; Olusola, A.; Adelabu, S. Development of Lightning Hazard Map for Fire Danger Assessment over Mountainous Protected Area Using Geospatial Technology. In Remote Sensing of African Mountains: Geospatial Tools toward Sustainability; Springer: Berlin/Heidelberg, Germany, 2022; pp. 131–156. [Google Scholar]
- Catry, F.X.; Rego, F.C.; Bação, F.L.; Moreira, F. Modeling and Mapping Wildfire Ignition Risk in Portugal. Int. J. Wildland Fire 2009, 18, 921–931. [Google Scholar] [CrossRef]
- Fang, L.; Yang, J.; Zu, J.; Li, G.; Zhang, J. Quantifying Influences and Relative Importance of Fire Weather, Topography, and Vegetation on Fire Size and Fire Severity in a Chinese Boreal Forest Landscape. For. Ecol. Manag. 2015, 356, 2–12. [Google Scholar] [CrossRef]
- Alizadeh, M.R.; Abatzoglou, J.T.; Adamowski, J.; Modaresi Rad, A.; AghaKouchak, A.; Pausata, F.S.R.; Sadegh, M. Elevation-Dependent Intensification of Fire Danger in the Western United States. Nat. Commun. 2023, 14, 1773. [Google Scholar] [CrossRef] [PubMed]
- Alizadeh, M.R.; Abatzoglou, J.T.; Luce, C.H.; Adamowski, J.F.; Farid, A.; Sadegh, M. Warming Enabled Upslope Advance in Western US Forest Fires. Proc. Natl. Acad. Sci. USA 2021, 118, e2009717118. [Google Scholar] [CrossRef]
- Chafer, C.J.; Noonan, M.; Macnaught, E. The Post-Fire Measurement of Fire Severity and Intensity in the Christmas 2001 Sydney Wildfires. Int. J. Wildland Fire 2004, 13, 227–240. [Google Scholar] [CrossRef]
- Argañaraz, J.P.; Gavier Pizarro, G.; Zak, M.; Landi, M.A.; Bellis, L.M. Human and Biophysical Drivers of Fires in Semiarid Chaco Mountains of Central Argentina. Sci. Total Environ. 2015, 520, 1–12. [Google Scholar] [CrossRef] [PubMed]
- Oliveira, S.; Moreira, F.; Boca, R.; San-Miguel-Ayanz, J.; Pereira, J.M.C. Assessment of Fire Selectivity in Relation to Land Cover and Topography: A Comparison between Southern European Countries. Int. J. Wildland Fire 2013, 23, 620–630. [Google Scholar] [CrossRef]
- Fernandes, P.M. Variation in the Canadian Fire Weather Index Thresholds for Increasingly Larger Fires in Portugal. Forests 2019, 10, 838. [Google Scholar] [CrossRef]
- Krawchuk, M.A.; Moritz, M.A. Constraints on Global Fire Activity Vary across a Resource Gradient. Ecology 2011, 92, 121–132. [Google Scholar] [CrossRef]
- Kelley, D.I.; Bistinas, I.; Whitley, R.; Burton, C.; Marthews, T.R.; Dong, N. How Contemporary Bioclimatic and Human Controls Change Global Fire Regimes. Nat. Clim. Chang. 2019, 9, 690–696. [Google Scholar] [CrossRef]
- Bowman, D.; Williamson, G.; Yebra, M.; Lizundia-Loiola, J.; Pettinari, M.L.; Shah, S.; Bradstock, R.; Chuvieco, E. Wildfires: Australia Needs National Monitoring Agency. Nature 2020, 584, 188–191. [Google Scholar] [CrossRef]
- McColl-Gausden, S.C.; Bennett, L.T.; Duff, T.J.; Cawson, J.G.; Penman, T.D. Climatic and Edaphic Gradients Predict Variation in Wildland Fuel Hazard in South-Eastern Australia. Ecography 2020, 43, 443–455. [Google Scholar] [CrossRef]
- Leenaars, J.G.B.; Kempen, B.; van Oostrum, A.J.M.; Batjes, N.H. Africa Soil Profiles Database: A Compilation of Georeferenced and Standardised Legacy Soil Profile Data for Sub-Saharan Africa; Africa Soil Information Service (AfSIS) and ISRIC-World Soil Information: Wageningen, The Netherlands, 2014. [Google Scholar]
- Krueger, E.S.; Levi, M.R.; Achieng, K.O.; Bolten, J.D.; Carlson, J.; Coops, N.C.; Holden, Z.A.; Magi, B.I.; Rigden, A.J.; Ochsner, T.E. Using Soil Moisture Information to Better Understand and Predict Wildfire Danger: A Review of Recent Developments and Outstanding Questions. Int. J. Wildland Fire 2022, 32, 111–132. [Google Scholar] [CrossRef]
- Krueger, E.S.; Ochsner, T.E.; Engle, D.M.; Carlson, J.; Twidwell, D.; Fuhlendorf, S.D. Soil Moisture Affects Growing-Season Wildfire Size in the Southern Great Plains. Soil Sci. Soc. Am. J. 2015, 79, 1567–1576. [Google Scholar] [CrossRef]
- Krueger, E.S.; Ochsner, T.E.; Carlson, J.D.; Engle, D.M.; Twidwell, D.; Fuhlendorf, S.D. Concurrent and Antecedent Soil Moisture Relate Positively or Negatively to Probability of Large Wildfires Depending on Season. Int. J. Wildland Fire 2016, 25, 657–668. [Google Scholar] [CrossRef]
- Turco, M.; von Hardenberg, J.; AghaKouchak, A.; Llasat, M.C.; Provenzale, A.; Trigo, R.M. On the Key Role of Droughts in the Dynamics of Summer Fires in Mediterranean Europe. Sci. Rep. 2017, 7, 81. [Google Scholar] [CrossRef]
- Knight, J. Scientists’ Warning of the Impacts of Climate Change on Mountains. PeerJ 2022, 10, e14253. [Google Scholar] [CrossRef]
Figure 1.
Location of the Golden Gate Highlands National Park (GGHNP) in Free State Province, South Africa.
Figure 1.
Location of the Golden Gate Highlands National Park (GGHNP) in Free State Province, South Africa.

Figure 2.
Climate of the study area (a) mean monthly precipitation and actual evapotranspiration rate (b); mean monthly minimum and maximum temperature adapted from [84].
Figure 2.
Climate of the study area (a) mean monthly precipitation and actual evapotranspiration rate (b); mean monthly minimum and maximum temperature adapted from [84].

Figure 3.
Percentage of area of fire-danger classes in the Golden Gate Highlands National Park (GGHNP) generated using decision tree (DT), frequency ratio (FR), logistic regression (LR), random forest (RF), support vector machines (SVM), and weight of evidence (WoE) models.
Figure 3.
Percentage of area of fire-danger classes in the Golden Gate Highlands National Park (GGHNP) generated using decision tree (DT), frequency ratio (FR), logistic regression (LR), random forest (RF), support vector machines (SVM), and weight of evidence (WoE) models.

Figure 4.
Fire-danger mapping in the Golden Gate Highlands National Park (GGHNP) using (a) decision tree (DT); (b) frequency ratio (FR); (c) logistic regression (LR); (d) random forest (RF); (e) support vector machines (SVM); and (f) weight of evidence (WoE) models.
Figure 4.
Fire-danger mapping in the Golden Gate Highlands National Park (GGHNP) using (a) decision tree (DT); (b) frequency ratio (FR); (c) logistic regression (LR); (d) random forest (RF); (e) support vector machines (SVM); and (f) weight of evidence (WoE) models.

Figure 5.
ROC/AUC (area under the receiver operating characteristic curve) results of the (a) decision tree (DT), (b) frequency ratio (FR), (c) logistic regression (LR), (d) random forest (RF), (e) support vector machines (SVM), and (f) weight of evidence (WoE) models used in the wildfire-danger assessment in the Golden Gate Highlands National Park (GGHNP).

Figure 6.
Jack-knife of regularized training gains for modelling wildfire danger in the Golden Gate Highlands National Park (GGHNP); BSI (bare soil index), coarse (coarse fragments), GCI (grass curing index), GVMI (global vegetation moisture index), LST (land surface temperature), prox_structures (proximity from other infrastructure, e.g., built environment and tourist facilities), SMC (soil moisture content), TAWCP (total plant available water-holding capacity), TPI (topographic position index), TRI (topographic ruggedness index), TWI (topographic water index), VCI (vegetation condition index), prox_river (proximity from river), and prox_road (proximity from road).

Figure 7.
Pearson correlation graph between wildfire-driving factors and fire danger index (SI).


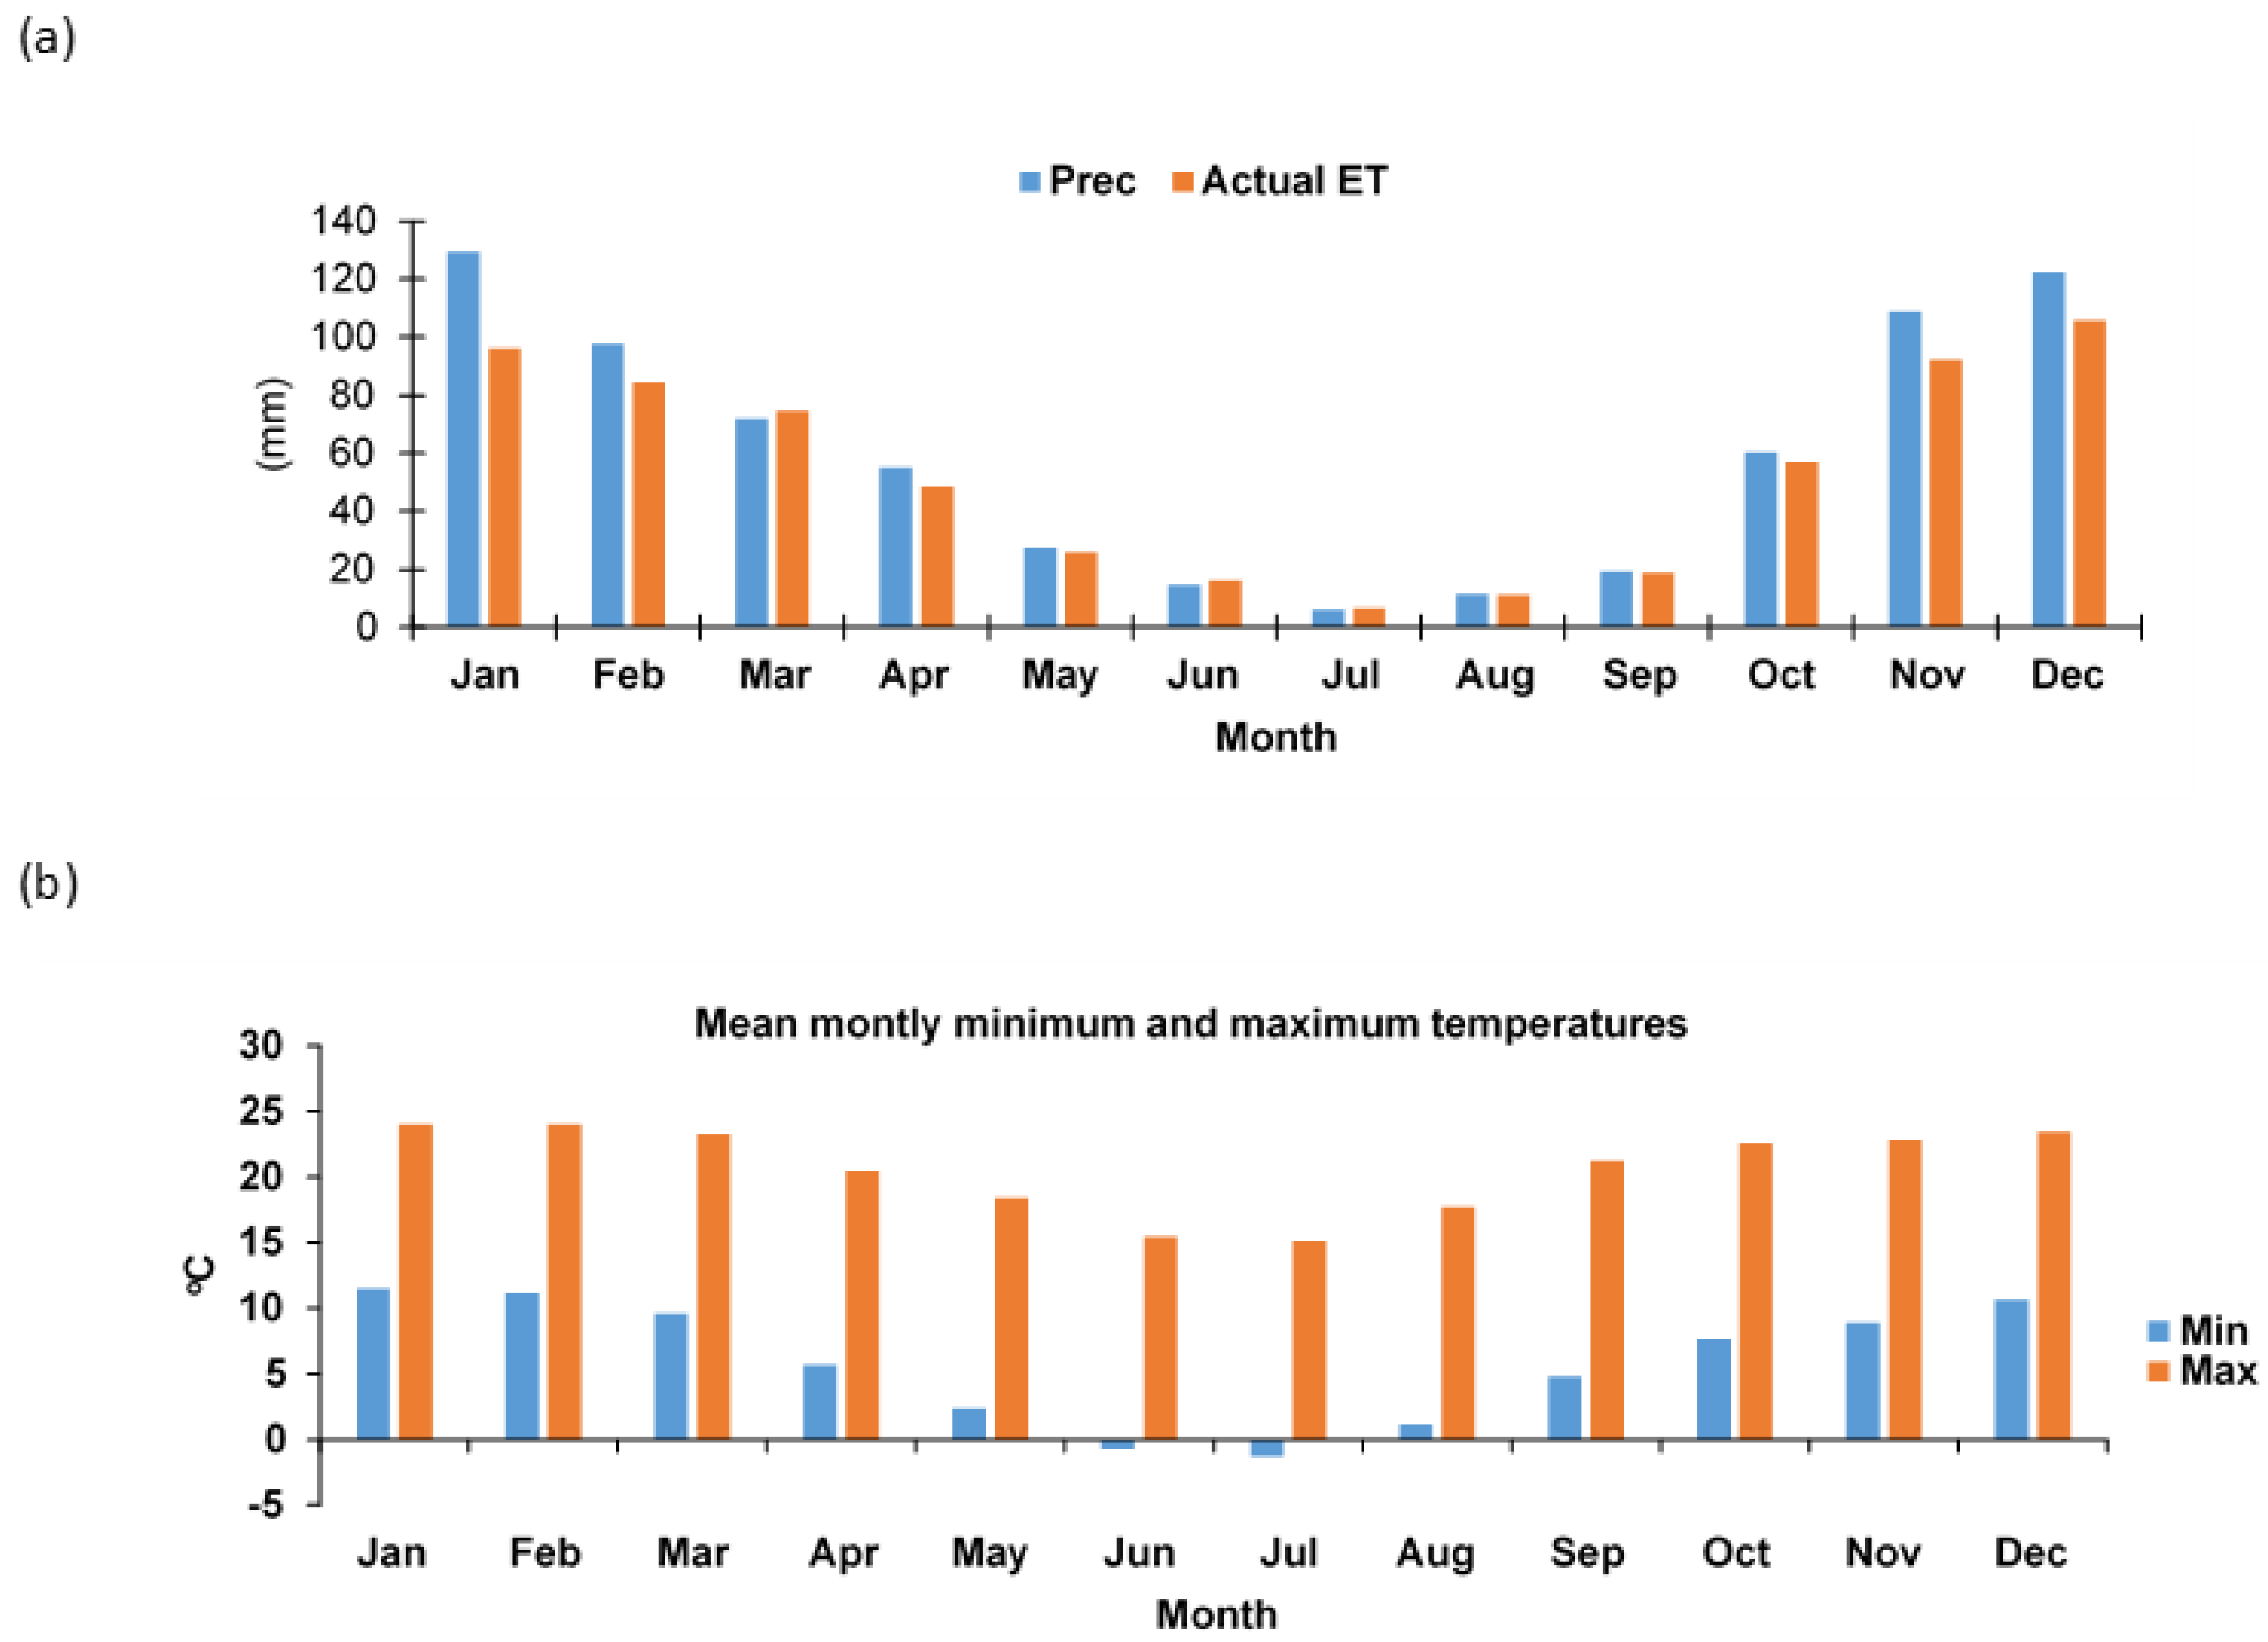
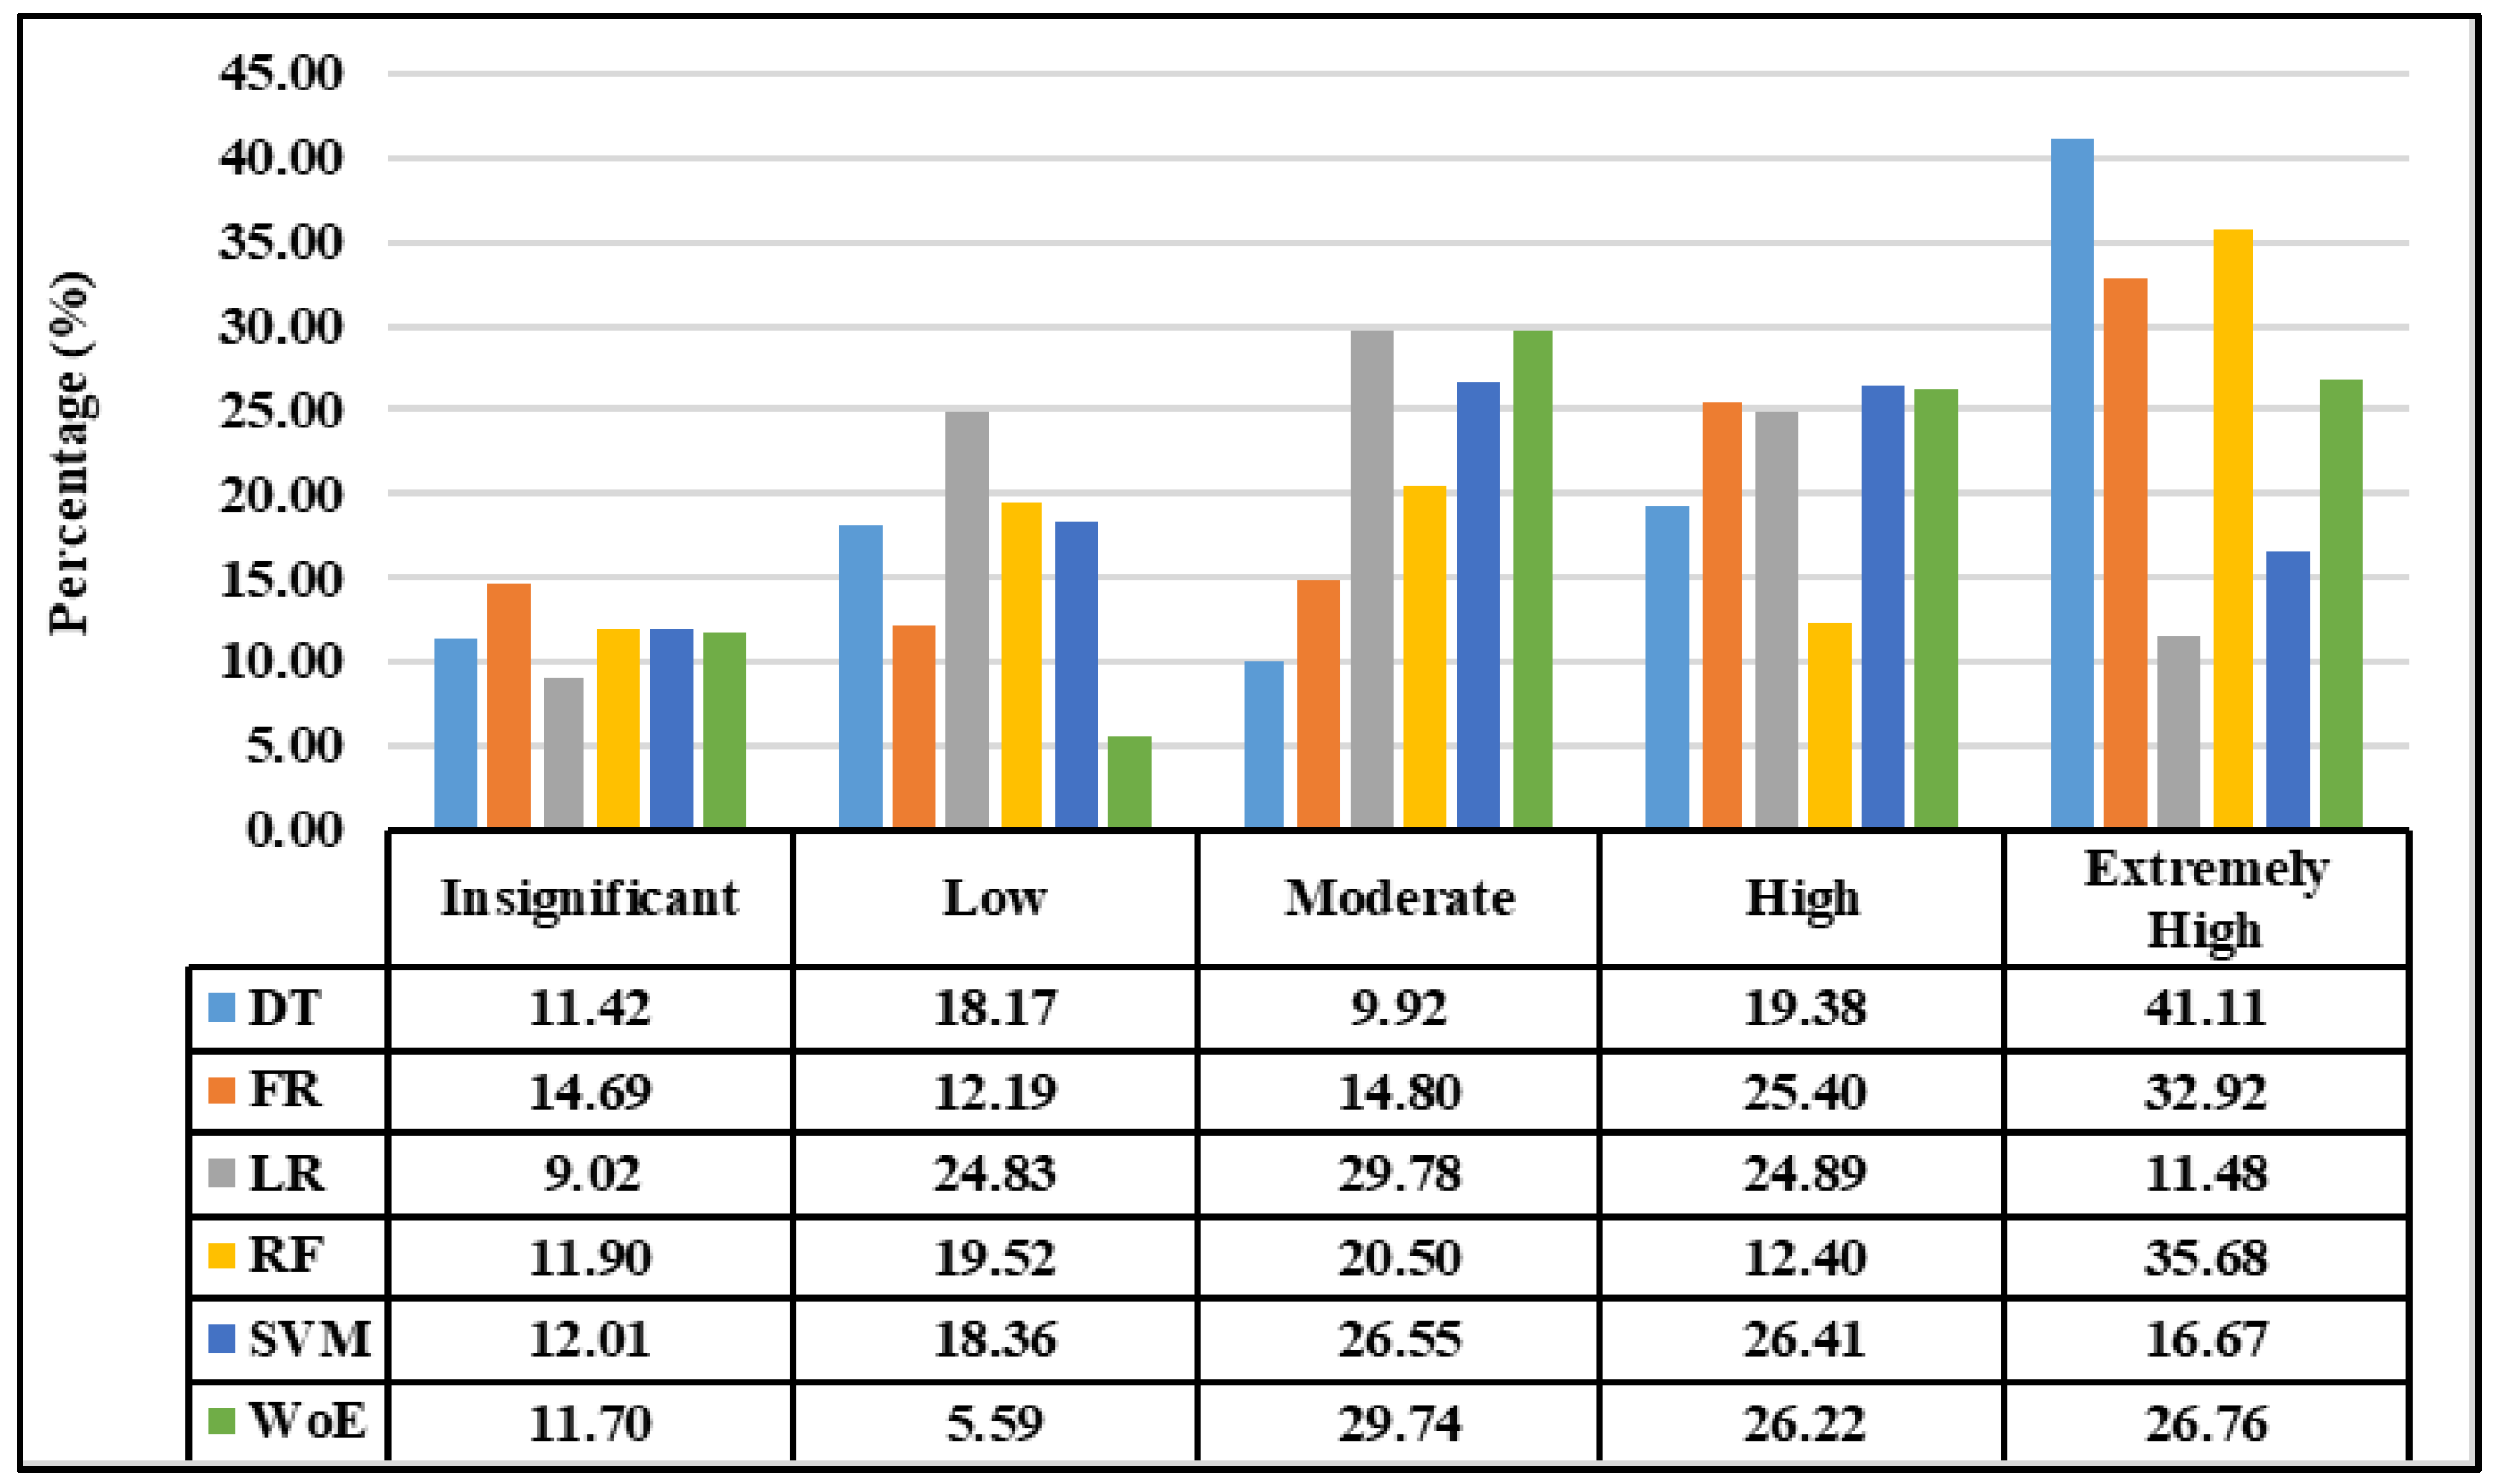
Table 1.
List of data type, satellite sensor or product, spatial resolution, and data source.
| Category | Driving Factor | Sensor/Product | Resolution | Data Download Source (Accessed on 15 December 2023) |
|---|---|---|---|---|
| Fire | Fire Points | VIIRS-NPP | 350 m | https://firms.modaps.eosdis.nasa.gov/download/ |
| Topographic | Elevation (m) | DEM | 30 m | https://earthexplorer.usgs.gov/ |
| Aspect (degrees) | ||||
| Slope | ||||
| Topographic position index (TPI) | ||||
| Topographic ruggedness index (TRI) | ||||
| Topographic wetness index (TWI) | ||||
| Fuel | Grass curing index (GCI) | MOD09A1; Sentinel-2 | 500 m 10 m | https://developers.google.com/earth-engine/datasets |
| Global vegetation moisture index (GVMI) | ||||
| Vegetation condition index (VCI) | ||||
| Proximity from river (prox_river) (m) | DEM | https://earthexplorer.usgs.gov/ | ||
| Soil | Bare Soil Index (BSI) | Sentinel-2 | 10 m | https://developers.google.com/earth-engine/datasets |
| Soil bulk density (BD) (cg/kg) | International Soil Reference and Information Centre (ISRIC), SoilGrids | 250 m | https://soilgrids.org/ | |
| Clay content (g/kg) | ||||
| Coarse fragments (cm3/dm3) | ||||
| Sand (g/kg) | ||||
| Silt (g/kg) | ||||
| Soil Moisture Content (SMC) (mm) | TerraClimate | 4000 m | https://app.climateengine.org/climateEngine | |
| Total Plant Available Water-Holding Capacity (TAWCP) | African SoilGrids of ISRIC World Soil Information | 1000 m | http://africasoils.net/services/data/soil-databases | |
| Weather | Land Surface Temperature (LST) (°C) | MODIS MOD11A2 | 100 m | https://developers.google.com/earth-engine/datasets |
| Lightning | South African Weather Services | 500 m | ||
| Wind speed (m/s) | TerraClimate | 4000 m | https://app.climateengine.org/climateEngine | |
| Anthropogenic | Proximity from road (prox_road) (m) | Open Street Map; SANParks | https://download.geofabrik.de/africa/south-africa.html | |
| Proximity from other infrastructure (built Environment, tourist facilities) (Prox_structure) (m) |
Table 2.
Fire-danger maps classified into five classes and their descriptions.
| Normalized FDI Value | Numerical Rating | Fire-Danger Class | Fire-Danger Rating |
|---|---|---|---|
| 0–0.2 | 1 | Low | Insignificant |
| 0.2–0.35 | 2 | Moderate | Low |
| 0.35–0.5 | 3 | Dangerous | Moderate |
| 0.5–0.7 | 4 | Very dangerous | High |
| 0.7–1 | 5 | Extremely dangerous | Extremely High |
Table 3.
Variable inflation factor (VIF) for selected factors influencing fire-danger-assessment modelling.
Table 3.
Variable inflation factor (VIF) for selected factors influencing fire-danger-assessment modelling.
| Variable | Abbreviation | VIF | Variable | Abbreviation | VIF |
|---|---|---|---|---|---|
| Aspect | A | 1.06 | Proximity from river | Prox_river | 1.52 |
| Bare soil index | BSI | 1.68 | Proximity from road | Prox_road | 1.23 |
| Soil bulk density | BD | 6.14 | Slope | S | 6.13 |
| Coarse fragments | CF | 2.43 | Soil moisture content | SMC | 2.75 |
| Elevation | E | 8.91 | Total Plant Available Water-Holding Capacity | TAWCP | 1.09 |
| Grass curing index | GCI | 5.99 | Topographic position index | TPI | 1.10 |
| GVMI | 3.64 | Topographic rugedness index | TRI | 6.43 | |
| Proximity from other infrastructure | Prox_structures | 1.15 | Topographic water index | TWI | 1.47 |
| Lightning | L | 1.66 | Vegetation condition index | VCI | 2.48 |
| Land surface temperature | LST | 2.77 | Wind speed | WS | 1.95 |
Table 4.
Results of AUC (area under the curve) index of the decision tree (DT), frequency ratio (FR), logistic regression (LR), random forest (RF), support vector machines (SVM), and weight of evidence (WoE) models used in the wildfire-danger assessment in the Golden Gate Highlands National Park (GGHNP).
| Model | Abbreviation | Accuracy/ Model Fit | Success Rate | Prediction Rate |
|---|---|---|---|---|
| Decision tree | DT | 0.93 | 0.96 | 0.5 |
| Frequency ratio | FR | 0.92 | 0.95 | 0.66 |
| Logistic regression | LR | 0.63 | 0.65 | 0.6 |
| Random forest | RF | 0.91 | 0.94 | 0.53 |
| Support vector machines | SVM | 0.63 | 0.64 | 0.59 |
| Weight of evidence | WoE | 0.83 | 0.83 | 0.74 |
Table 5.
Variables sorted in order of importance in influencing fire-danger-assessment modelling in Golden Gate Highlands National Park (GGHNP).
Table 5.
Variables sorted in order of importance in influencing fire-danger-assessment modelling in Golden Gate Highlands National Park (GGHNP).
| Variable | Unit of Measurement | Abbreviation | Percent Contribution | Permutation Importance |
|---|---|---|---|---|
| Bulk density | Cg/kg | BD | 7.7 | 11.8 |
| Global vegetation moisture index | GVMI | 3.8 | 10.4 | |
| Land surface temperature | °C | LST | 19.9 | 9 |
| Proximity from road | M | prox_road | 4.7 | 8.5 |
| Aspect | ° | A | 11.4 | 8 |
| Proximity from river | M | prox_river | 5.6 | 7.2 |
| Grass curing index | GCI | 2 | 6.9 | |
| Soil moisture content | Mm | SMC | 9.1 | 6.7 |
| Wind speed | m/s | WS | 7.3 | 5.3 |
| Proximity from other infrastructure, e.g., built environment and tourist facilities | prox_structures | 3.6 | 4.1 | |
| Vegetation condition index | VCI | 4.3 | 3.9 | |
| Topographic ruggedness index | TRI | 2.4 | 3.7 | |
| Topographic water index | TWI | 3.4 | 3.7 | |
| Elevation | M | E | 1.3 | 3.2 |
| Slope | S | 1.8 | 2.4 | |
| Bare soil index | BSI | 1.2 | 2.2 | |
| Topographic position index | TPI | 2.6 | 1.6 | |
| Coarse fragments | Cm3/dm3 | CF | 1.9 | 1 |
| Lightning | MJ/m | L | 5.8 | 0.6 |
| Total plant available water-holding capacity | TAWCP | 0.3 | 0 |
Disclaimer/Publisher’s Note: The statements, opinions and data contained in all publications are solely those of the individual author(s) and contributor(s) and not of MDPI and/or the editor(s). MDPI and/or the editor(s) disclaim responsibility for any injury to people or property resulting from any ideas, methods, instructions or products referred to in the content. |
© 2024 by the authors. Licensee MDPI, Basel, Switzerland. This article is an open access article distributed under the terms and conditions of the Creative Commons Attribution (CC BY) license (https://creativecommons.org/licenses/by/4.0/).
Share and Cite
MDPI and ACS Style
Mofokeng, O.D.; Adelabu, S.A.; Jackson, C.M. An Integrated Grassland Fire-Danger-Assessment System for a Mountainous National Park Using Geospatial Modelling Techniques. Fire 2024, 7, 61. https://doi.org/10.3390/fire7020061
AMA Style
Mofokeng OD, Adelabu SA, Jackson CM. An Integrated Grassland Fire-Danger-Assessment System for a Mountainous National Park Using Geospatial Modelling Techniques. Fire. 2024; 7(2):61. https://doi.org/10.3390/fire7020061
Chicago/Turabian StyleMofokeng, Olga D., Samuel A. Adelabu, and Colbert M. Jackson. 2024. "An Integrated Grassland Fire-Danger-Assessment System for a Mountainous National Park Using Geospatial Modelling Techniques" Fire 7, no. 2: 61. https://doi.org/10.3390/fire7020061