
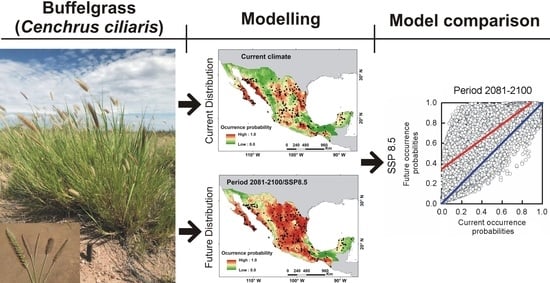
Distribution Patterns of Invasive Buffelgrass (Cenchrus ciliaris) in Mexico Estimated with Climate Niche Models under the Current and Future Climate

 , , , , , , and
Abstract
:
1. Introduction
2. Results
3. Discussion
4. Materials and Methods
5. Conclusions
Supplementary Materials
Author Contributions
Funding
Data Availability Statement
Acknowledgments
Conflicts of Interest
References
- Marshall, V.M.; Lewis, M.M.; Ostendorf, B. Buffel grass (Cenchrus ciliaris) as an invader and threat to biodiversity in arid environments: A review. J. Arid Environ. 2012, 78, 1–12. [Google Scholar] [CrossRef]
- de la Barrera, E. Recent invasion of buffel grass (Cenchrus ciliaris) of a natural protected area from the southern Sonoran Desert. Rev. Mex. Biodivers. 2008, 79, 385–392. [Google Scholar]
- Ibarra-Flores, F.A.; Marín-Rivera, M.H.; Quero-Carrillo, A.R. Pasto buffel Cenchrus ciliaris L. Link. (Pennisetum ciliare Lam.). In Gramíneas Introducidas: Importancia e Impacto En Ecosistemas Ganaderos, 1st ed.; Quero-Carrillo, A.R., Ed.; Colegio de Postgraduados: Texcoco, México, 2013; Volume 1, pp. 73–102. [Google Scholar]
- Arriaga, L.; Castellanos, V.A.E.; Moreno, E.; Alarcón, J. Potential ecological distribution of alien invasive species and risk assessment: A case study of buffel grass in arid regions of Mexico. Conserv. Biol. 2004, 18, 1504–1514. [Google Scholar] [CrossRef]
- Brenner, J.C.; Kanda, L.L. Buffelgrass (Pennisetum ciliare) invades lands surrounding cultivated pastures in Sonora, Mexico. Invasive Plant. Sci. Manag. 2013, 6, 187–195. [Google Scholar] [CrossRef]
- Blanco, L.J.; Ferrando, C.A.; Biurrun, F.N.; Orionte, E.L.; Namur, P.; Recalde, D.J.; Berone, G.D. Vegetation responses to roller chopping and buffelgrass seeding in Argentina. Rangel. Ecol. Manag. 2005, 58, 219–224. [Google Scholar] [CrossRef]
- Saucedo-Monarque, E.; García-Moya, E.; Castellanos-Villegas, A.E.; Flores-Flores, J.L. La riqueza, una variable de respuesta de la vegetación a la introducción del zacate buffel. Agrociencia 1997, 31, 83–90. [Google Scholar]
- Williams, D.G.; Baruch, Z. African grass invasion in the Americas: Ecosystem consequences and the role of ecophysiology. Biol. Invasions 2000, 2, 123–140. [Google Scholar] [CrossRef]
- Chaffin, B.C.; Garmestani, A.S.; Angeler, D.G.; Herrmann, D.L.; Stow, C.A.; Nyström, M.; Sendzimir, J.; Hopton, M.E.; Kolasa, J.; Allen, C.R. Biological invasions, ecological resilience and adaptive governance. Environ. Manag. 2016, 183, 399–407. [Google Scholar] [CrossRef] [Green Version]
- Seipel, T.; Rew, L.J.; Taylor, K.T.; Maxwell, B.D. Disturbance type influences plant community resilience and resistance to Bromus tectorum invasion in the sagebrush steppe. Appl. Veg. Sci. 2018, 21, 385–394. [Google Scholar] [CrossRef] [Green Version]
- Lien, A.M.; Baldwin, E.; Franklin, K. Collective action and invasive species governance in Southern Arizona. Range Ecol. Manag. 2021, 74, 151–164. [Google Scholar] [CrossRef]
- Kumar, R.P.; Singh, J.S. Invasive alien plant species: Their impact on environmental, ecosystem services and human health. Ecol. Indic. 2020, 111, 106020. [Google Scholar] [CrossRef]
- Brooks, M.L.; Chambers, J.C. Resistance to invasion and resilience to fire in desert shrublands of North America. Rangeland Ecol. Manag. 2011, 64, 431–438. [Google Scholar] [CrossRef]
- Diario Oficial de la Federación. Available online: https://www.dof.gob.mx/nota_detalle.php?codigo=5464456&fecha=07/12/2016 (accessed on 31 March 2022).
- Método de Evaluación Rápida de Invasibidad (MERI) para Especies Exóticas en México. Cenchrus ciliaris L. Available online: http://sivicoff.cnf.gob.mx/ContenidoPublico/MenuPrincipal/07Fichas%20tecnicas_OK/02Fichas%20tecnicas/Fichas%20t%C3%A9cnicas%20SEMARNAT_especies%20ex%C3%B3ticas/Cenchrus%20ciliaris.pdf (accessed on 31 March 2022).
- Hui, C.; Krug, R.M.; Richardson, D.M. Modelling spread in invasion ecology: A synthesis. In Fifty Years of Invasion Ecology: The Legacy of Charles Elton, 1st ed.; Richardson, D.M., Ed.; Wiley: Oxford, UK, 2010; Volume 1, pp. 329–343. [Google Scholar] [CrossRef]
- Ramírez-Albores, J.E.; Bustamante, R.O.; Badano, E.I. Improved predictions of the geographic distribution of invasive plants using climatic niche models. PLoS ONE 2016, 11, e0156029. [Google Scholar] [CrossRef]
- Guerra-Coss, F.A.; Badano, E.I.; Cedillo-Rodríguez, I.E.; Ramírez-Albores, J.E.; Flores, J.; Barragán-Torres, F.; Flores-Cano, J.A. Modelling and validation of the spatial distribution of suitable habitats for the recruitment of invasive plants on climate change scenarios: An approach from the regeneration niche. Sci. Total Environ. 2021, 777, 146007. [Google Scholar] [CrossRef]
- Guisan, A.; Thuiller, W. Predicting species distribution: Offering more than simple habitat models. Ecol. Lett. 2005, 8, 993–1009. [Google Scholar] [CrossRef]
- Phillips, S.J.; Dudík, M. Modeling of species distributions with Maxent: New extensions and a comprehensive evaluation. Ecography 2008, 31, 161–175. [Google Scholar] [CrossRef]
- Peterson, A.T.; Soberón, J.; Pearson, R.G.; Anderson, R.P.; Martínez-Meyer, E.; Nakamura, M.; Araújo, M.B. Ecological Niches and Geographic Distributions, 1st ed.; Princeton University Press: Princeton, NJ, USA, 2011; Volume 328, pp. 97–137. [Google Scholar]
- Elith, J.; Phillips, S.J.; Hastie, T.; Dudík, M.; Chee, Y.E.; Yates, C.J. A statistical explanation of MaxEnt for ecologists. Divers. Distrib. 2011, 17, 43–57. [Google Scholar] [CrossRef]
- Forster, P.M.; Maycock, A.C.; McKenna, C.M.; Smith, C.J. Latest climate models confirm need for urgent mitigation. Nat. Clim. Chang. 2019, 10, 7–10. [Google Scholar] [CrossRef]
- Cook, B.I.; Mankin, J.S.; Marvel, K.; Williams, A.P.; Smerdon, J.E.; Anchukaitis, K.J. Twenty-first century drought projections in the CMIP6 forcing scenarios. Earths Future 2020, 8, e2019EF001461. [Google Scholar] [CrossRef] [Green Version]
- O’Neill, B.C.; Kriegler, E.; Riahi, K.; Ebi, K.L.; Hallegatte, S.; Carter, T.R.; Mathur, R.; van Vuuren, D.P. A new scenario framework for climate change research: The concept of shared socioeconomic pathways. Clim. Chang. 2014, 122, 387–400. [Google Scholar] [CrossRef] [Green Version]
- Riahi, K.; van Vuuren, D.P.; Kriegler, E.; Edmonds, J.; O’Neill, B.C.; Fujimori, S.; Bauer, N.; Calvin, K.; Dellink, R.; Fricko, O.; et al. The Shared Socioeconomic Pathways and their energy, land use, and greenhouse gas emissions implications: An overview. Glob. Environ. Chang. 2017, 42, 153–168. [Google Scholar] [CrossRef] [Green Version]
- Elith, J.; Kearney, M.; Phillips, S. The art of modelling range-shifting species. Methods Ecol. Evol. 2010, 1, 330–342. [Google Scholar] [CrossRef]
- Lonsdale, W.M. Global patterns of plant invasions and the concept of invasibility. Ecology 1999, 80, 1522–1536. [Google Scholar] [CrossRef]
- Bradley, B.A.; Blumenthal, D.M.; Wilcove, D.S.; Ziska, L.H. Predicting plant invasions in an era of global change. Trends Ecol. Evol. 2010, 25, 310–318. [Google Scholar] [CrossRef] [PubMed]
- Petitpierre, B.; Kueffer, C.; Broennimann, O.; Randin, C.; Daehler, C.; Guisan, A. Climatic niche shifts are rare among terrestrial plant invaders. Science 2012, 335, 344–1348. [Google Scholar] [CrossRef] [PubMed] [Green Version]
- Araújo, M.B.; Pearson, R.G.; Thuiller, W.; Erhard, M. Validation of species–climate impact models under climate change. Glob. Chang. Biol. 2005, 11, 1504–1513. [Google Scholar] [CrossRef] [Green Version]
- Peña-Gómez, F.T.; Guerrero, P.C.; Bizama, G.; Duarte, M.; Bustamante, R.O. Climatic niche conservatism and biogeographical non-equilibrium in Eschscholzia californica (Papaveraceae), an invasive plant in the Chilean Mediterranean region. PLoS ONE 2014, 9, e105025. [Google Scholar] [CrossRef] [Green Version]
- Wan, J.Z.; Wang, C.J.; Yu, F.H. Effects of occurrence record number, environmental variable number, and spatial scales on MaxEnt distribution modelling for invasive plants. Biology 2019, 74, 757–766. [Google Scholar] [CrossRef]
- Suzart de Albuquerque, F.; Macías-Rodríguez, M.Á.; Búrquez, A.; Astudillo-Scalia, Y. Climate change and the potential expansion of buffelgrass (Cenchrus ciliaris L., Poaceae) in biotic communities of Southwest United States and northern Mexico. Biol. Invasions 2019, 21, 3335–3347. [Google Scholar] [CrossRef]
- Stankowski, P.A.; Parker, W.H. Species distribution modelling: Does one size fit all? A phytogeographic analysis of Salix in Ontario. Ecol. Modell. 2010, 221, 1655–1664. [Google Scholar] [CrossRef]
- Agustín Breña-Naranjo, J.; Pedrozo-Acuña, A.; Pozos-Estrada, O.; Jiménez-López, S.A.; López-López, M.R. The contribution of tropical cyclones to rainfall in Mexico. Phys. Chem. Earth Parts A/B/C 2015, 83–84, 111–122. [Google Scholar] [CrossRef]
- González-Medrano, F. Las Zonas Áridas y Semiáridas de México y Su Vegetación, 1st ed.; Instituto Nacional de Ecología: México City, Mexico, 2012; pp. 9–159. [Google Scholar]
- De la Barrera, E.; Castellanos, A.E. High temperature effects on gas exchange for the invasive buffel grass (Pennisetum ciliare [L.] Link). Weed Biol. Manag. 2007, 7, 128–131. [Google Scholar] [CrossRef]
- Karmalkar, A.V.; Bradley, R.S.; Diaz, H.F. Climate change in Central America and Mexico: Regional climate model validation and climate change projections. Clim. Dyn. 2011, 37, 605. [Google Scholar] [CrossRef] [Green Version]
- Colorado-Ruiz, G.; Cavazos, T.; Salinas, J.A.; De Grau, P.; Ayala, R. Climate change projections from Coupled Model Intercomparison Project phase 5 multi-model weighted ensembles for Mexico, the North American monsoon, and the mid-summer drought region. Int. J. Climatol. 2018, 38, 5699–5716. [Google Scholar] [CrossRef]
- Araújo, M.B.; Pearson, R.G. Equilibrium of species’ distributions with climate. Ecography 2005, 28, 693–695. [Google Scholar] [CrossRef]
- Václavík, T.; Meentemeyer, R.K. Equilibrium or not? Modelling potential distribution of invasive species in different stages of invasion. Divers. Distrib. 2012, 18, 73–83. [Google Scholar] [CrossRef]
- Sol, D. Do successful invaders exist? Pre-adaptations to novel environments in terrestrial vertebrates. In Biological Invasions, 1st ed.; Nentwig, W., Ed.; Springer: Berlin, Germany, 2007; Volume 193, pp. 127–144. [Google Scholar] [CrossRef]
- Coutts, S.R.; van Klinken, R.D.; Yokomizo, H.; Buckley, Y.M. What are the key drivers of spread in invasive plants: Dispersal, demography or landscape: And how can we use this knowledge to aid management? Biol. Invasions 2011, 13, 1649–1661. [Google Scholar] [CrossRef]
- Meijer, K.; Schilthuizen, M.; Beukeboom, L.; Smit, C. A review and meta-analysis of the enemy release hypothesis in plant-herbivorous insect systems. PeerJ 2016, 4, e2778. [Google Scholar] [CrossRef] [Green Version]
- Ibarra-Flores, F.A.; Martin-Rivera, M.H.; Moreno-Medina, S.; Ibarra-Martín, F.A.; Retes-López, R. Impacto económico asociado con los daños del tizón foliar en la producción de semilla del zacate buffel en el centro de Sonora, México. Rev. Mex. Agronegocios 2019, 45, 313–324. [Google Scholar]
- Morales-Romero, D.; Lopez-Garcia, H.; Martinez-Rodriguez, J.; Molina-Freaner, F. Documenting a plant invasion: The influence of land use on buffelgrass invasion along roadsides in Sonora, Mexico. J. Arid Environ. 2019, 164, 53–59. [Google Scholar] [CrossRef]
- Pyšek, P.; Richardson, D.M. Traits associated with invasiveness in alien plants: Where do we stand? In Biological Invasions, 1st ed.; Nentwig, W., Ed.; Springer: Berlin, Germany, 2007; Volume 193, pp. 97–125. [Google Scholar] [CrossRef]
- Stevens, J.; Falk, D.A. Can buffelgrass invasions be controlled in the American Southwest? Using invasion ecology theory to understand buffelgrass success and develop comprehensive restoration and management. Ecol. Restor. 2009, 27, 417–427. [Google Scholar] [CrossRef]
- James, S.A.; Soltis, P.S.; Belbin, L.; Chapman, A.D.; Nelson, G.; Paul, D.L.; Collins, M. Herbarium data: Global biodiversity and societal botanical needs for novel research. Appl. Plant. Sci. 2018, 6, e1024. [Google Scholar] [CrossRef]
- Fick, S.E.; Hijmans, R.J. WorldClim 2: New 1-km spatial resolution climate surfaces for global land areas. Int. J. Climatol. 2017, 37, 4302–4315. [Google Scholar] [CrossRef]
- Barry, S.; Elith, J.; Barry, S.; Elith, J. Error and uncertainty in habitat models. J. Appl. Ecol. 2006, 43, 413–423. [Google Scholar] [CrossRef]
- Elith, J.; Graham, C.H.; Anderson, R.P.; Dudík, M.; Ferrier, S.; Guisan, A.; Hijmans, R.J.; Huettmann, F.; Leathwick, J.R.; Lehmann, A.; et al. Novel methods improve prediction of species’ distributions from occurrence data. Ecography 2006, 29, 129–151. [Google Scholar] [CrossRef] [Green Version]
- Merow, C.; Smith, M.J.; Silander, J.A. A practical guide to MaxEnt for modeling species’ distributions: What it does, and why inputs and settings matter. Ecography 2013, 36, 1058–1069. [Google Scholar] [CrossRef]
- Beaumont, L.J.; Hughes, L.; Poulsen, M. Predicting species distributions: Use of climatic parameters in BIOCLIM and its impact on predictions of species’ current and future distributions. Ecol. Modell. 2005, 186, 251–270. [Google Scholar] [CrossRef]
- Phillips, S.J.; Anderson, R.P.; Dudík, M.; Schapire, R.E.; Blair, M.E. Opening the black box: An open-source release of Maxent. Ecography 2017, 40, 887–893. [Google Scholar] [CrossRef]
- Phillips, S.J.; Anderson, R.P.; Schapire, R.E. Maximum entropy modeling of species geographic distributions. Ecol. Modell. 2006, 190, 231–259. [Google Scholar] [CrossRef] [Green Version]
- Swart, N.C.; Cole, J.N.S.; Kharin, V.V.; Lazare, M.; Scinocca, J.F.; Gillett, N.P.; Anstey, J.; Arora, V.; Christian, J.R.; Hanna, S.; et al. The Canadian Earth System Model version 5 (CanESM5.0.3). Geosci. Model. Dev. 2019, 12, 4823–4873. [Google Scholar] [CrossRef] [Green Version]
- Meehl, G.A.; Senior, C.A.; Eyring, V.; Flato, G.; Lamarque, J.F.; Stouffer, R.J.; Taylor, K.E.; Schlund, M. Context for interpreting equilibrium climate sensitivity and transient climate response from the CMIP6 Earth system models. Sci. Adv. 2020, 6, eaba1981. [Google Scholar] [CrossRef]
- Zelinka, M.D.; Myers, T.A.; McCoy, D.T.; Po-Chedley, S.; Caldwell, P.M.; Ceppi, P.; Klein, S.A.; Taylor, K.E. Causes of higher climate sensitivity in CMIP6 models. Geophys. Res. Lett. 2020, 47, e2019GL085782. [Google Scholar] [CrossRef] [Green Version]
- Kutner, M.H.; Nachtsheim, C.J.; Neter, J.; Li, W. Applied Linear Statistical Models, 5th ed.; McGraw-Hill Irwin: New York, NY, USA, 2005; pp. 2–39. [Google Scholar]


| Climate Unit | Highly Suitable Habitats | Moderately Suitable Habitats | Unsuitable Habitats |
|---|---|---|---|
| Cold | 0% | 8% | 92% |
| Semi-cold semi-dry | 0% | 48% | 52% |
| Semi-cold sub-humid | 0% | 31% | 69% |
| Temperate dry | 30% | 65% | 5% |
| Temperate highly dry | 3% | 72% | 26% |
| Temperate humid | 1% | 54% | 45% |
| Temperate semi-dry | 45% | 53% | 3% |
| Temperate sub-humid | 37% | 54% | 9% |
| Semi-warm dry | 66% | 34% | 0% |
| Semi-warm highly dry | 51% | 47% | 2% |
| Semi-warm humid | 10% | 43% | 46% |
| Semi-warm semi-dry | 62% | 38% | 0% |
| Semi-warm sub-humid | 73% | 27% | 0% |
| Warm dry | 89% | 11% | 0% |
| Warm highly dry | 84% | 15% | 2% |
| Warm semi-dry | 94% | 6% | 0% |
| Warm sub-humid | 37% | 60% | 2% |
| Warm wet | 0% | 14% | 86% |
| Highly warm highly dry | 100% | 0% | 0% |
| Highly warm semi-dry | 85% | 15% | 0% |
| Highly warm dry | 91% | 9% | 0% |
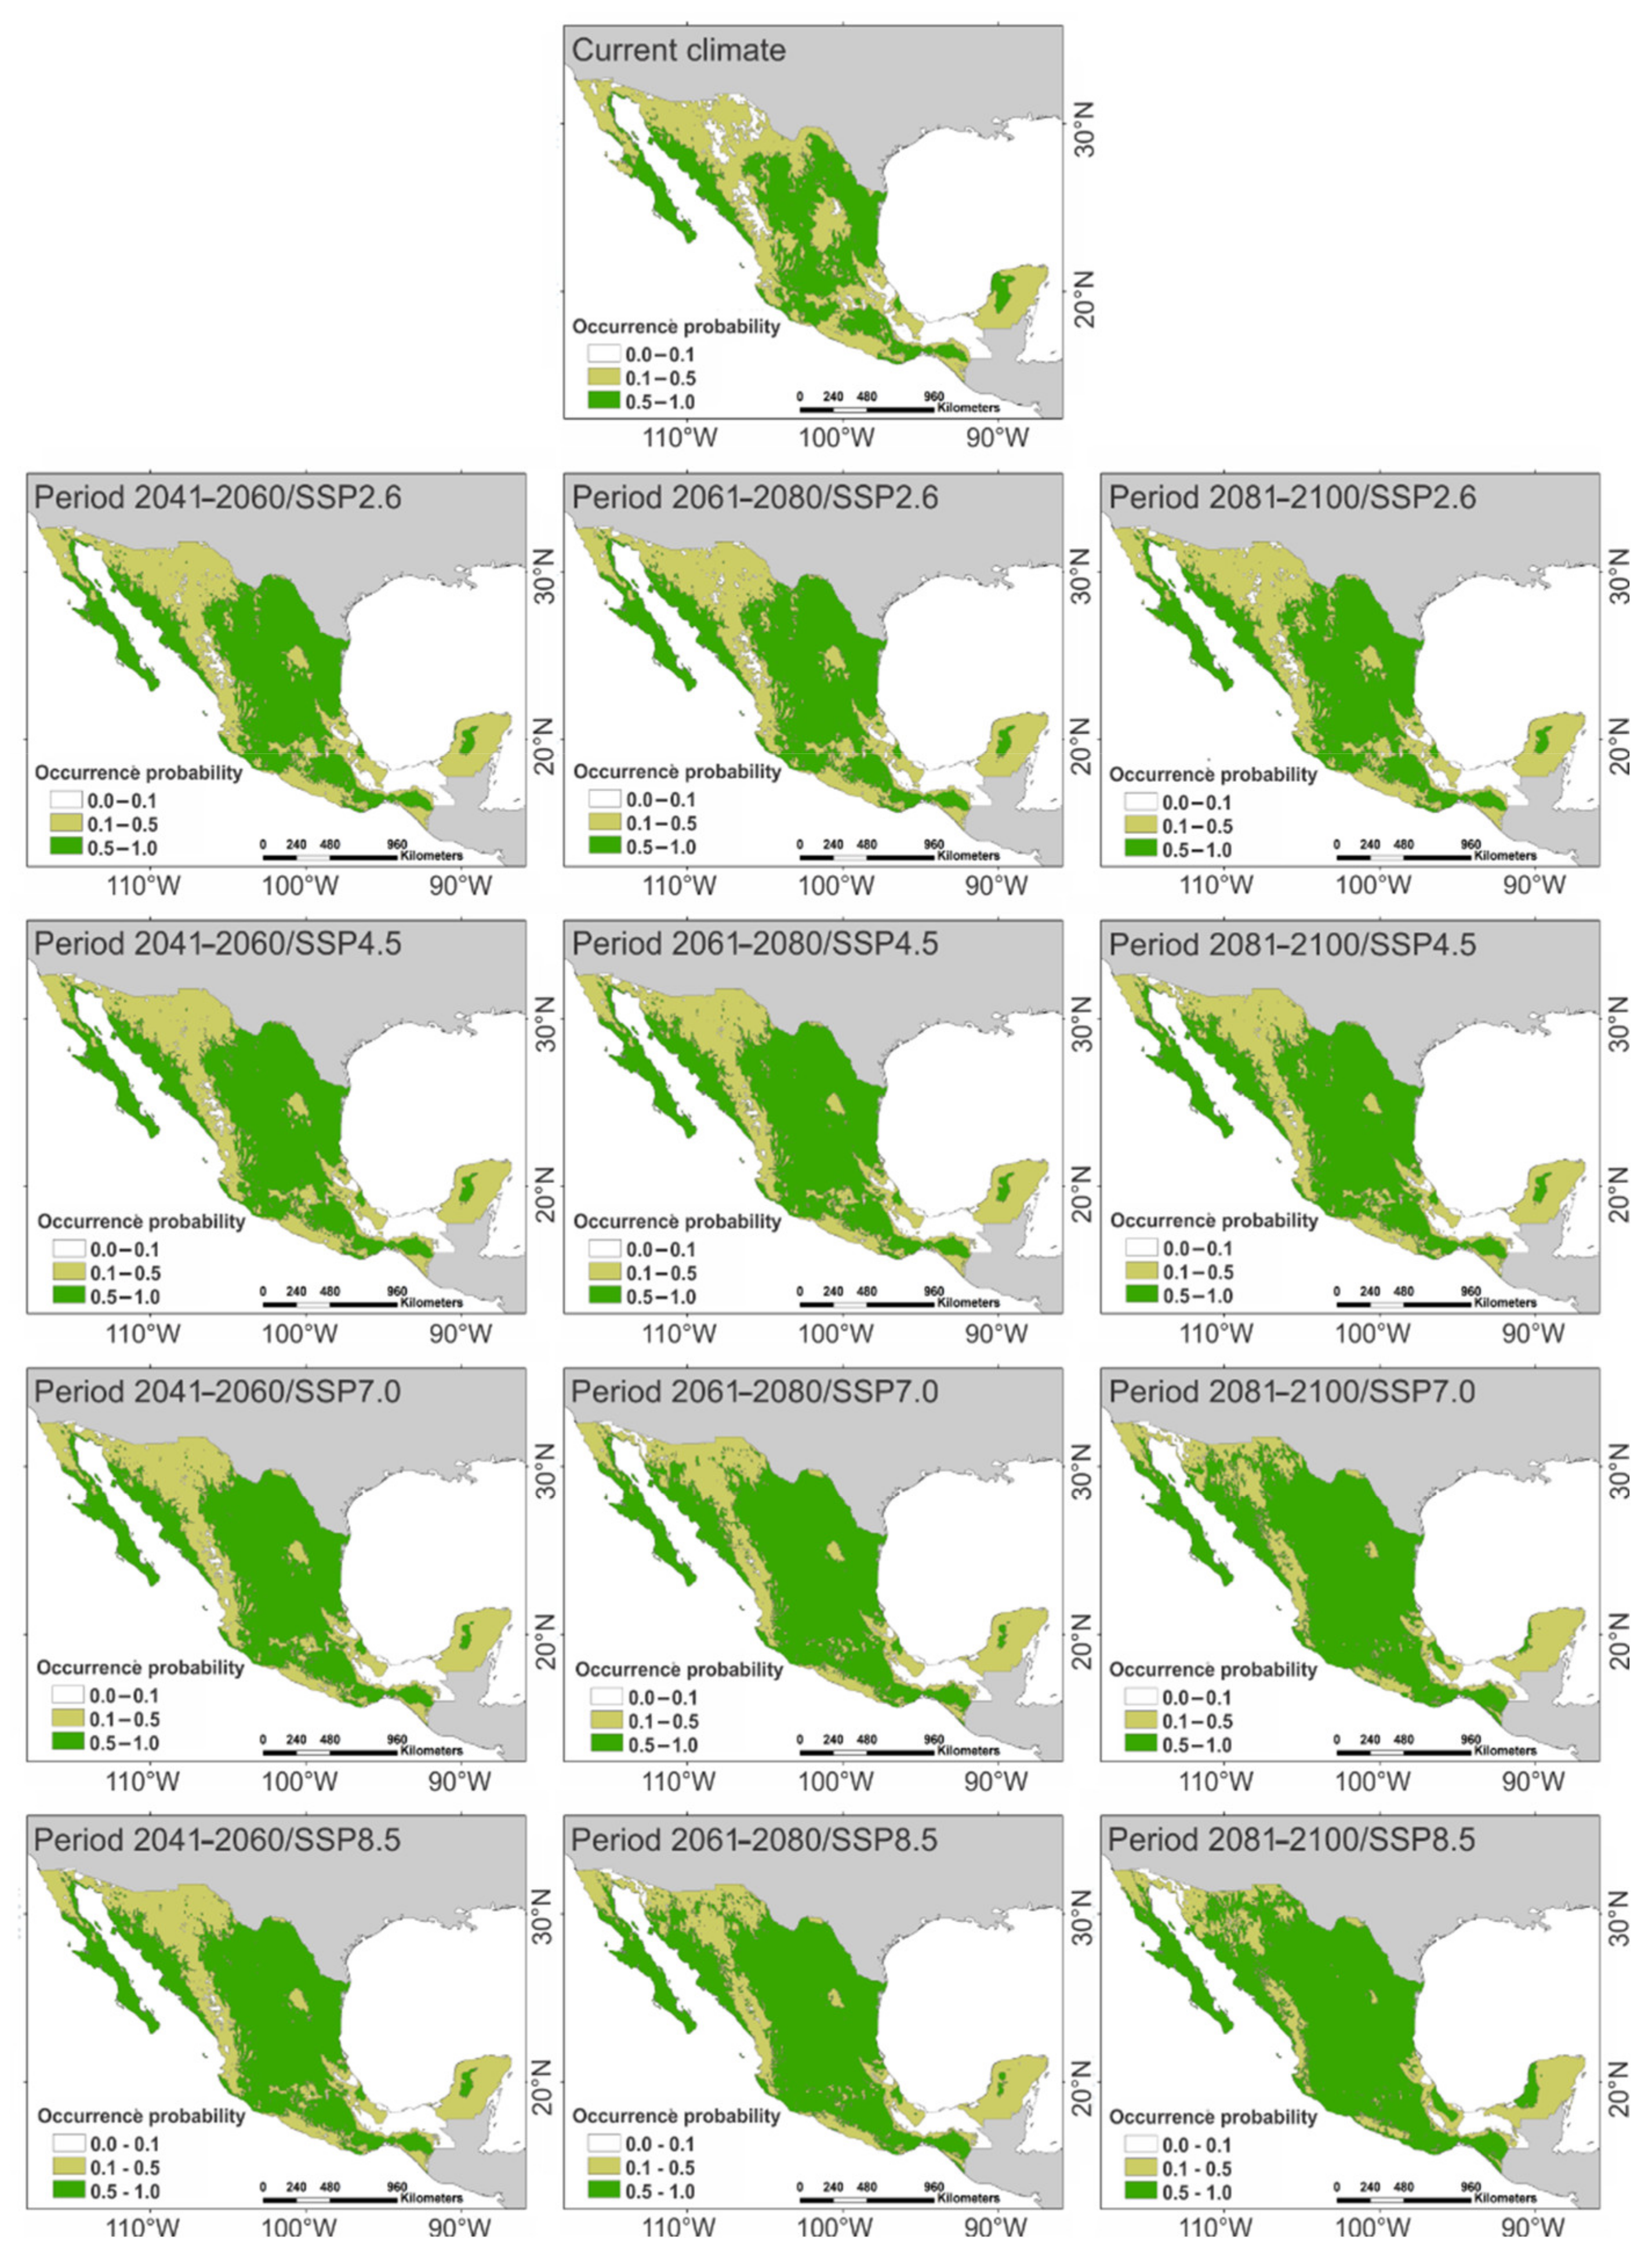
| Climate Scenario | Highly Suitable Habitats | Moderately Suitable Habitats | Unsuitable Habitats | Overlapping with Negative MESS Areas | |
|---|---|---|---|---|---|
| Current climate | 42.2% | 45.6% | 12.3% | – | |
| 2041–2060 | SSP2.6 | SSP2.6 | 52.4% | 39.2% | 8.4% |
| SSP4.5 | SSP4.5 | 54.5% | 37.6% | 7.9% | |
| SSP7.0 | SSP7.0 | 56.8% | 35.8% | 7.4% | |
| SSP8.5 | SSP8.5 | 58.1% | 34.6% | 7.3% | |
| 2061–2080 | SSP2.6 | SSP2.6 | 52.1% | 39.1% | 8.7% |
| SSP4.5 | SSP4.5 | 57.2% | 35.4% | 7.5% | |
| SSP7.0 | SSP7.0 | 62.2% | 31.0% | 6.9% | |
| SSP8.5 | SSP8.5 | 64.2% | 29.3% | 6.6% | |
| 2081–2100 | SSP2.6 | SSP2.6 | 51.4% | 39.8% | 8.8% |
| SSP4.5 | SSP4.5 | 57.9% | 34.6% | 7.5% | |
| SSP7.0 | SSP7.0 | 68.1% | 25.9% | 6.1% | |
| SSP8.5 | SSP8.5 | 72.0% | 22.7% | 5.2% | |
| Climate Scenario | Results of Regression Analyses | Empirical Linear Regression Function | |
|---|---|---|---|
| 2041–2060 | SSP2.6 | F(1, 9998) = 80,688.383, p < 0.001, R2 = 0.890 | = 0.069 * + 1.032 * Pc |
| SSP4.5 | F(1, 9998) = 59,827.316, p < 0.001, R2 = 0.857 | Pf = 0.090 * + 1.025 * Pc | |
| SSP7.0 | F(1, 9998) = 43,507.023, p < 0.001, R2 = 0.813 | Pf = 0.119 * + 1.013 * Pc | |
| SSP8.5 | F(1, 9998) = 40,987.125, p < 0.001, R2 = 0.804 | Pf = 0.132 * + 0.988 * Pc | |
| 2061–2080 | SSP2.6 | F(1, 9998) = 80,439.742, p < 0.001, R2 = 0.889 | Pf = 0.063 * + 1.036 * Pc |
| SSP4.5 | F(1, 9998) = 41,775.102, p < 0.001, R2 = 0.807 | Pf = 0.121 * + 1.010 * Pc | |
| SSP7.0 | F(1, 9998) = 24,058.211, p < 0.001, R2 = 0.706 | Pf = 0.198 * + 0.931 * Pc | |
| SSP8.5 | F(1, 9998) = 19,815.479, p < 0.001, R2 = 0.665 | Pf = 0.234 * + 0.884 * Pc | |
| 2081–2100 | SSP2.6 | F(1, 9998) = 84,131.766, p < 0.001, R2 = 0.894 | Pf = 0.058 * + 1.038 * Pc |
| SSP4.5 | F(1, 9998) = 36,641.332, p < 0.001, R2 = 0.786 | Pf = 0.133 * + 0.981 * Pc | |
| SSP7.0 | F(1, 9998) = 13,323.927, p < 0.001, R2 = 0.571 | Pf = 0.293 * + 0.804 * Pc | |
| SSP8.5 | F(1, 9998) = 10,316.182, p < 0.001, R2 = 0.508 | Pf = 0.344 * + 0.738 * Pc | |
Publisher’s Note: MDPI stays neutral with regard to jurisdictional claims in published maps and institutional affiliations. |
© 2022 by the authors. Licensee MDPI, Basel, Switzerland. This article is an open access article distributed under the terms and conditions of the Creative Commons Attribution (CC BY) license (https://creativecommons.org/licenses/by/4.0/).
Share and Cite
Siller-Clavel, P.; Badano, E.I.; Villarreal-Guerrero, F.; Prieto-Amparán, J.A.; Pinedo-Alvarez, A.; Corrales-Lerma, R.; Álvarez-Holguín, A.; Hernández-Quiroz, N.S. Distribution Patterns of Invasive Buffelgrass (Cenchrus ciliaris) in Mexico Estimated with Climate Niche Models under the Current and Future Climate. Plants 2022, 11, 1160. https://doi.org/10.3390/plants11091160
Siller-Clavel P, Badano EI, Villarreal-Guerrero F, Prieto-Amparán JA, Pinedo-Alvarez A, Corrales-Lerma R, Álvarez-Holguín A, Hernández-Quiroz NS. Distribution Patterns of Invasive Buffelgrass (Cenchrus ciliaris) in Mexico Estimated with Climate Niche Models under the Current and Future Climate. Plants. 2022; 11(9):1160. https://doi.org/10.3390/plants11091160
Chicago/Turabian StyleSiller-Clavel, Pablo, Ernesto I. Badano, Federico Villarreal-Guerrero, Jesús A. Prieto-Amparán, Alfredo Pinedo-Alvarez, Raúl Corrales-Lerma, Alan Álvarez-Holguín, and Nathalie S. Hernández-Quiroz. 2022. "Distribution Patterns of Invasive Buffelgrass (Cenchrus ciliaris) in Mexico Estimated with Climate Niche Models under the Current and Future Climate" Plants 11, no. 9: 1160. https://doi.org/10.3390/plants11091160