
Comparative and Phylogenetic Analysis of Complete Plastomes among Aristidoideae Species (Poaceae)


Key Lab of Plant Stress Research, College of Life Science, Shandong Normal University, No. 88 Wenhuadong Road, Jinan 250014, China
*
Authors to whom correspondence should be addressed.
†
These authors contributed equally to this work.
Biology 2022, 11(1), 63; https://doi.org/10.3390/biology11010063
Submission received: 8 October 2021
/
Revised: 26 December 2021
/
Accepted: 29 December 2021
/
Published: 2 January 2022
Abstract
:Simple Summary
Aristidoideae is a subfamily of Poaceae, including three genera, Aristida, Stipagrostis, and Sartidia. In this study, the plastomes of Aristida adscensionis and Stipagrostis pennata were newly sequenced, and a total of 16 Aristidoideae plastomes were compared. All plastomes were conservative in genome size, gene number, structure, and IR boundary. Repeat sequence analysis showed that forward and palindrome repeats were the most common repeat types. The number of SSRs ranged from 30 (Sartidia isaloensis) to 54 (Aristida purpurea). Codon usage analysis showed that plastome genes preferred to use codons ending with A/T. A total of 12 highly variable regions were screened, including four protein coding sequences and eight non-coding sequences. All Maximum Likelihood and Bayesian Inference trees strongly support the monophyly of Aristidoideae and each of the three genera. Within Aristidoideae, Aristida is sister to the clade composed of Stipagrostis and Sartidia. The divergence between C4 Stipagrostis and C3 Sartidia was estimated at 11.04 Ma, which may be associated with the drought event in the Miocene period. Finally, the differences in carbon fixation patterns, geographical distributions, and ploidy may be related to the difference of species numbers among these three genera. This study provides insights into the phylogeny and evolution of the subfamily Aristidoideae.
Abstract
Aristidoideae is a subfamily in the PACMAD clade of family Poaceae, including three genera, Aristida, Stipagrostis, and Sartidia. In this study, the plastomes of Aristida adscensionis and Stipagrostis pennata were newly sequenced, and a total of 16 Aristidoideae plastomes were compared. All plastomes were conservative in genome size, gene number, structure, and IR boundary. Repeat sequence analysis showed that forward and palindrome repeats were the most common repeat types. The number of SSRs ranged from 30 (Sartidia isaloensis) to 54 (Aristida purpurea). Codon usage analysis showed that plastome genes preferred to use codons ending with A/T. A total of 12 highly variable regions were screened, including four protein coding sequences (matK, ndhF, infA, and rpl32) and eight non-coding sequences (rpl16-1-rpl16-2, ccsA-ndhD, trnY-GUA-trnD-GUC, ndhF-rpl32, petN-trnC-GCA, trnT-GGU-trnE-UUC, trnG-GCC-trnfM-CAU, and rpl32-trnL-UAG). Furthermore, the phylogenetic position of this subfamily and their intergeneric relationships need to be illuminated. All Maximum Likelihood and Bayesian Inference trees strongly support the monophyly of Aristidoideae and each of three genera, and the clade of Aristidoideae and Panicoideae was a sister to other subfamilies in the PACMAD clade. Within Aristidoideae, Aristida is a sister to the clade composed of Stipagrostis and Sartidia. The divergence between C4 Stipagrostis and C3 Sartidia was estimated at 11.04 Ma, which may be associated with the drought event in the Miocene period. Finally, the differences in carbon fixation patterns, geographical distributions, and ploidy may be related to the difference of species numbers among these three genera. This study provides insights into the phylogeny and evolution of the subfamily Aristidoideae.
1. Introduction
The subfamily Aristidoideae, together with Panicoideae, Chloridoideae, Micrairoideae, Arundinoideae, and Danthonioideae, forms the PACMAD clade of Poaceae [1]. The most striking feature of Aristidoideae is that they contain three awns at the top of their lemma. The inflorescence type of Aristidoideae has spread or contracted panicles, with only one fertile floret in one spikelet. Their leaves are narrow and usually rolled longitudinally, which is related to their adaptation to arid environments [2,3]. Three genera, Aristida, Stipagrostis, and Sartidia, are contained in Aristidoideae. The core genus is Aristida, with about 300 species, which are widely distributed in temperate and subtropical arid areas [4]. There are about 50 species in Stipagrostis, which distributed in deserts and semi-deserts [5,6]. Only six species are contained in Sartidia, and they often occur in grasslands and savannas [3,6]. In addition, research on this subfamily has focused on the origin of C3 and C4 [5,7,8,9]. Aristidoideae has twice-independent C4 origins, once in Aristida and the other in Stipagrostis. Aristida (except for A. longifolia, which is the earliest diverging taxa in Aristida and it’s a C3 plant) and Stipagrostis are C4 photosynthesis species, while Sartidia species are C3 plants [5].
The subfamily Aristidoideae is monophyletic, and each of the three genera in the subfamily is also monophyletic [10]. However, the relationship of Aristidoideae with other subfamilies in the PACMAD clade remains in question. In the molecular phylogenetic tree of Poaceae, updated by Grass Phylogeny Working Group (GPWG) in 2012, the subfamily Aristidoideae is the basal group of the PACMAD clade [1]. The phylogenetic study of the PACMAD clade, based on the chloroplast genome data, indicated that the subfamily Panicoideae is the basal group of this clade and Aristidoideae formed a sister group relationship with the rest of subfamilies, however, only one Aristidoideae species was included [11]. The phylogenetic study by Saarela, et al. [12] sampled more species in Aristidoideae, but the position of the Aristidoideae in PACMAD remains controversial. Two sets of chloroplast genome data support Panicoideae as being the basal group of PACMAD, and three sets of chloroplast genome data support that Aristidoideae is the basal group of PACMAD; the complete chloroplast genome coding region, excluding gapped sites but containing positively selected sites, approve that Panicoideae and Aristidoideae are sister groups. While the data based on the mitochondrial gene matR and seven highly variable mitochondrial gene intron sequences (cox2 intron, nad1 intron 2, nad4 intron 1, and nad7 introns 1, 2, 3, and 4.) support that Aristidoideae and Panicoideae are sister groups to each other and form the base group of PACMAD together [11].
The phylogenetic relationships of these three genera in Aristidoideae have always been controversial in grass taxonomy. The sister relationship of Aristida and Stipagrostis is supported by both six chloroplast gene fragments and the nuclear ppc multigene family [7,13]. However, neither study sampled Sartidia species, due to the low species number and narrow distribution of this genus. The combined analysis, based on chloroplast trnL-F, rpl16 and nuclear ITS sequences, support Aristida to be the sister to the clade composed of Stipagrostis and Sartidia [10]. The same conclusion was made by the Grass Phylogeny Working Group II [1], based on three chloroplast markers (rbcL, ndhF, trnK/matK). However, both studies included only one Sartidia species. Morphologically, the spikelets of Aristida are more similar to those of Sartidia, and there are no feathery hairs on their awns [10]. The embryo proportion (the ratio of embryo length to caryopsis length) of these two genera is 1/5–2/5, while it is 1/3–1/2 for Stipagrostis [14,15]. However, the caryopsis of Aristida and Stipagrostis are cylindrical, which have been laterally compressed, and the caryopsis of Sartidia is dorsally compressed [2,14,16]. In the anatomical structure, there are two layers of vascular bundle sheath cells in all Aristidoideae species. Only the outer layer of vascular bundle sheath are parenchyma cells in Sartidia and Stipagrostis, while in Aristida, two layers of vascular bundle sheath are parenchyma cells [3,5]. Therefore, neither molecular nor morphological evidence could explain the relationship between the three genera well. In this study, the whole plastomes were used to reconstruct the relationships among three genera of Aristidoideae. Representative species of three genera were sampled to test the phylogenetic resolution ability of plastome.
The chloroplast is a structure where green plants carry out photosynthesis and carbon fixation. It is a semi-autonomous organelle, which is ubiquitous in land plants, algae and some protists [17,18]. The first published plant plastome sequences were Nicotiana tabacum L. [19] and Marchantia polymorpha L. [20]. The plastome of angiosperms is a double-stranded ring with a highly conserved quadripartite structure: a large single-copy region (LSC), a small single-copy region (SSC), and two inverted repeat (IR) regions. The IR regions are the areas that expand or contract during the evolution of the plastome, which is also the main reason for the difference in the size of the plastomes [21]. The plastome usually contains 101–118 different genes [22], and the genome size ranges from 120 kb to 160 kb [17], but there are some exceptions [23,24,25]. The largest known angiosperm plastome is Pelargonium × hortorum, with a length of 217,942 bp [26]. The plastome is moderate in size and contains considerable genetic information. It has a good collinearity with plastome of various plant groups, and the nucleic acid replacement rate in chloroplast DNA is sufficient [27]. In addition, the significant difference of molecular evolution speed between the coding and non-coding regions of the plastome made it suitable for the phylogenetic study of different taxonomic levels [28]. Phylogenetic genomics based on plastomes has developed rapidly in recent years [29,30,31].
In the current study, the plastomes of two newly sequenced Aristidoideae species were reported. The aims of this study were to: (1) compare the plastome structure of the 16 Aristidoideae species; (2) screen the highly variable markers for Aristidoideae, especially within the genus Aristida; (3) explore the phylogenetic position of Aristidoideae, as well as the intergeneric relationships of Aristida, Stipagrostis, and Sartidia, and interspecific relationships of Aristida. All in all, this is the first comparative study in Aristidoideae based on plastid genomes data. The application of these results will contribute to the evaluation of phylogenetic relationships and biogeographical studies among close relatives of Aristidoideae.
2. Materials and Methods
2.1. Plant Material, DNA Extraction, and Sequencing
The plants of Aristida adscensionis Linnaeus and Stipagrostis pennata (Trinius) De Winter were collected from Taohuayu in Shandong Province, Chinaand Bu’erjin in Xinjiang Uygur Autonomous Region, China. The voucher specimens were deposited in the herbarium of Shandong Normal University (SDNU), where the voucher specimen of A. adscensionis was registered under the number 20061013-1, and the voucher specimen of St. pennata was registered under the number 608068. Total genomic DNA were isolated from silica-dried leaves using a modified CTAB method [32]. Agarose gel electrophoresis was used to detect the quality of extracted DNA. A NanoDrop 2000 spectrophotometer (Thermo Scientific, Wilmington, DE, USA) was used to determine the concentration of the isolated DNA.
A total of 0.2 μg DNA was used for the DNA library preparations. The sequencing library was generated using NEB Next® Ultra™ DNA Library Prep Kit for Illumina (NEB, Beijing, China) according to the manufacturer’s recommended instructions. The genomic DNA was broken into a size of ~350 bp. The resulting fragments were endpolished, A-tailed, and ligated with the full-length adapter for Illumina sequencing, followed by further PCR amplification. The 150 bp paired-end sequencing was performed with the Illumina NovaSeq 6000 platform in Novogene (Beijing, China).
2.2. Genome Assembly and Annotation
The plastomes of Aristida adscensionis and Stipagrostis pennata were assembled with Organelle Genome Assembler (OGA, https://github.com/quxiaojian/OGA (accessed on 6 February 2021)) [33]. The sequences of all 16 species were annotated with Plastid Genome Annotator (PGA, https://github.com/quxiaojian/PGA (accessed on 14 February 2021)) [34] and manually corrected in Geneious v8.0.2 (https://www.geneious.com (accessed on 9 March 2021)). OrganellarGenomeDRAW (OGDRAW) v1.3.1 (https://chlorobox.mpimp-golm.mpg.de/OGDraw.html (accessed on 28 May 2021)) [35] was used to draw the plastome map. The plastomes information, such as the number of genes, gene length, GC content, and intron number, etc., was counted by Geneious v8.0.2. The sequence data have been submitted to the GenBank database under accession number MZ373986 and MZ375985.
2.3. Repeat Sequences and SSR Analysis
Repeat sequence analysis, including forward, reverse, complement, and palindrome repeats, was carried out by the REPuter website (https://bibiserv.cebitec.unibielefeld.de/reputer/ (accessed on 13 September 2021)) [36]. The parameters used in the analysis were as follows: the hamming distance was three, the maximum computed repeats was 50 bp, and the minimal repeat size was 30 bp. Simple sequence repeats (SSR) or microsatellites in the plastomes were detected by Perl script MISA [37]. The repeat units were set to 10, 5, 4, 3, 3, and 3 for mono-, di-, tri-, tetra-, penta-, and hexa-nucleotides, respectively [38]. The correlation analysis between SSR and chloroplast genome length and GC content were completed by the software SPSS v18.0 (SPSS Inc., Chicago, IL, USA).
2.4. Codon Usage Analysis
The codon usage of 16 Aristidoideae species was compared. The assessments of codon usage preference included the relative usage of synonymous codons (RSCU) and the effective number of codons (ENC). If the RSCU value is greater than 1, it means that the codon is used more frequently. ENC can be used to measure the degree of codon preference. The lower the value is, the stronger the codon preference of the gene is [39,40]. CodonW v1.4.2 (http://sourceforge.net/projects/codonw/ (accessed on 1 June 2021)) was used for codon usage analysis. The aligned coding sequences (CDSs) longer than 300 bp were picked, to ensure accuracy [41].
2.5. Comparative Genome Analysis and Divergent Hotspot Regions
The conversion of GenBank annotation files to mVISTA format files was completed by Perl script (https://github.com/quxiaojian/Bioinformatic_Scripts/get_mVISTA_format_from_GenBank_annotation.pl (accessed on 31 May 2021)). Plastome sequence alignment was performed by the online genome alignment tool mVISTA (http://genome.lbl.gov/vista/index.shtml (accessed on 4 June 2021)), and the alignment program used was Shuffle-LAGAN [42]. St. pennata was selected as the reference. MEGA v7.0.26 was used for DNA sequence polymorphism analysis [43]. The percentage of parsimonious information sites (Pi%) of CDS and non-coding regions were calculated for those with sequence length greater than 200 bp [44].
2.6. Phylogenetic Analysis and Taxon Removal Test
To avoid data duplication, one IR region was deleted before phylogenetic analysis. Based on plastome data, the phylogenetic relationship of the PACMAD clade and the subfamily Aristidoideae were reconstructed, respectively. A total of 22 plastomes were used to study the phylogeny of the PACMAD clade with three species (Brachyelytrum aristosum, Bambusa bambos, and Oryza sativa) as the outgroup. About two or three representatives of each subfamily in PACMAD clade were selected, however, six Aristidoideae representatives were selected, to reconstruct the phylogenetic relationship of PACMAD. For reconstruction of the phylogeny of Aristidoideae, a total of 19 plastomes were used, including ten Aristida species, three Sartidia species, three Stipagrostis species, and three species as an outgroup (Sorghum bicolor, Zea mays, and Setaria viridis). The species and their accession numbers used for phylogenetic analysis were shown in Table 1. Three data matrices (complete plastome, CDS, and IGS) were selected for phylogenetic analysis. The sequence alignment was performed by MAFFT v7.313 with default parameters [45]. The software jModelTest v2.1.6 was used to select the best nucleotide substitution model, according to the Akaike Information Criterion [46,47]. Maximum Likelihood analyses were conducted by RAxML v 8.0.26 [48], with the substitution model of GTRGAMMAI and 1000 bootstrap replicates.
The software MrBayes v3.2.7 was used to reconstruct the Bayesian Inference (BI) tree [49]. The Markov Chain Monte Carlo (MCMC) was run for 1,000,000 steps with a random starting tree, birth–death default priors, and we sampled one tree every 1000 steps. The birth–death model has given a framework for studying the rate of species formation, extinction and net diversification. Finally, we referred to much of the literature about Bayesian tree inference of Poaceae based on chloroplast genome sequences, and “birth–death” prior is frequently used in these literatures. The first 25% of steps were discarded as burn-in. The molecular dating analysis was conducted by treePL and TreeAnnotator v1.8.945, with the relaxed molecular clock [50,51]. Rapid relaxed clock dating is frequently applied to analyze large data sets with hundreds of sequences in phylogenomics, due to its accuracy and efficiency. The relaxed molecular clock method can accommodate the changes of molecular evolutionary rate between lineages over time. The minimum and maximum age for the crown of Aristidoideae and Panicoideae was set to 36.9 and 51.9 Ma, respectively, based on previously analyzed results [52]. The minimum and maximum age for the crown of Aristidoideae was set to 10 and 20.4 Ma, respectively, based on results of a previous study [53].
3. Results
3.1. Plastome Characteristics of Aristidoideae
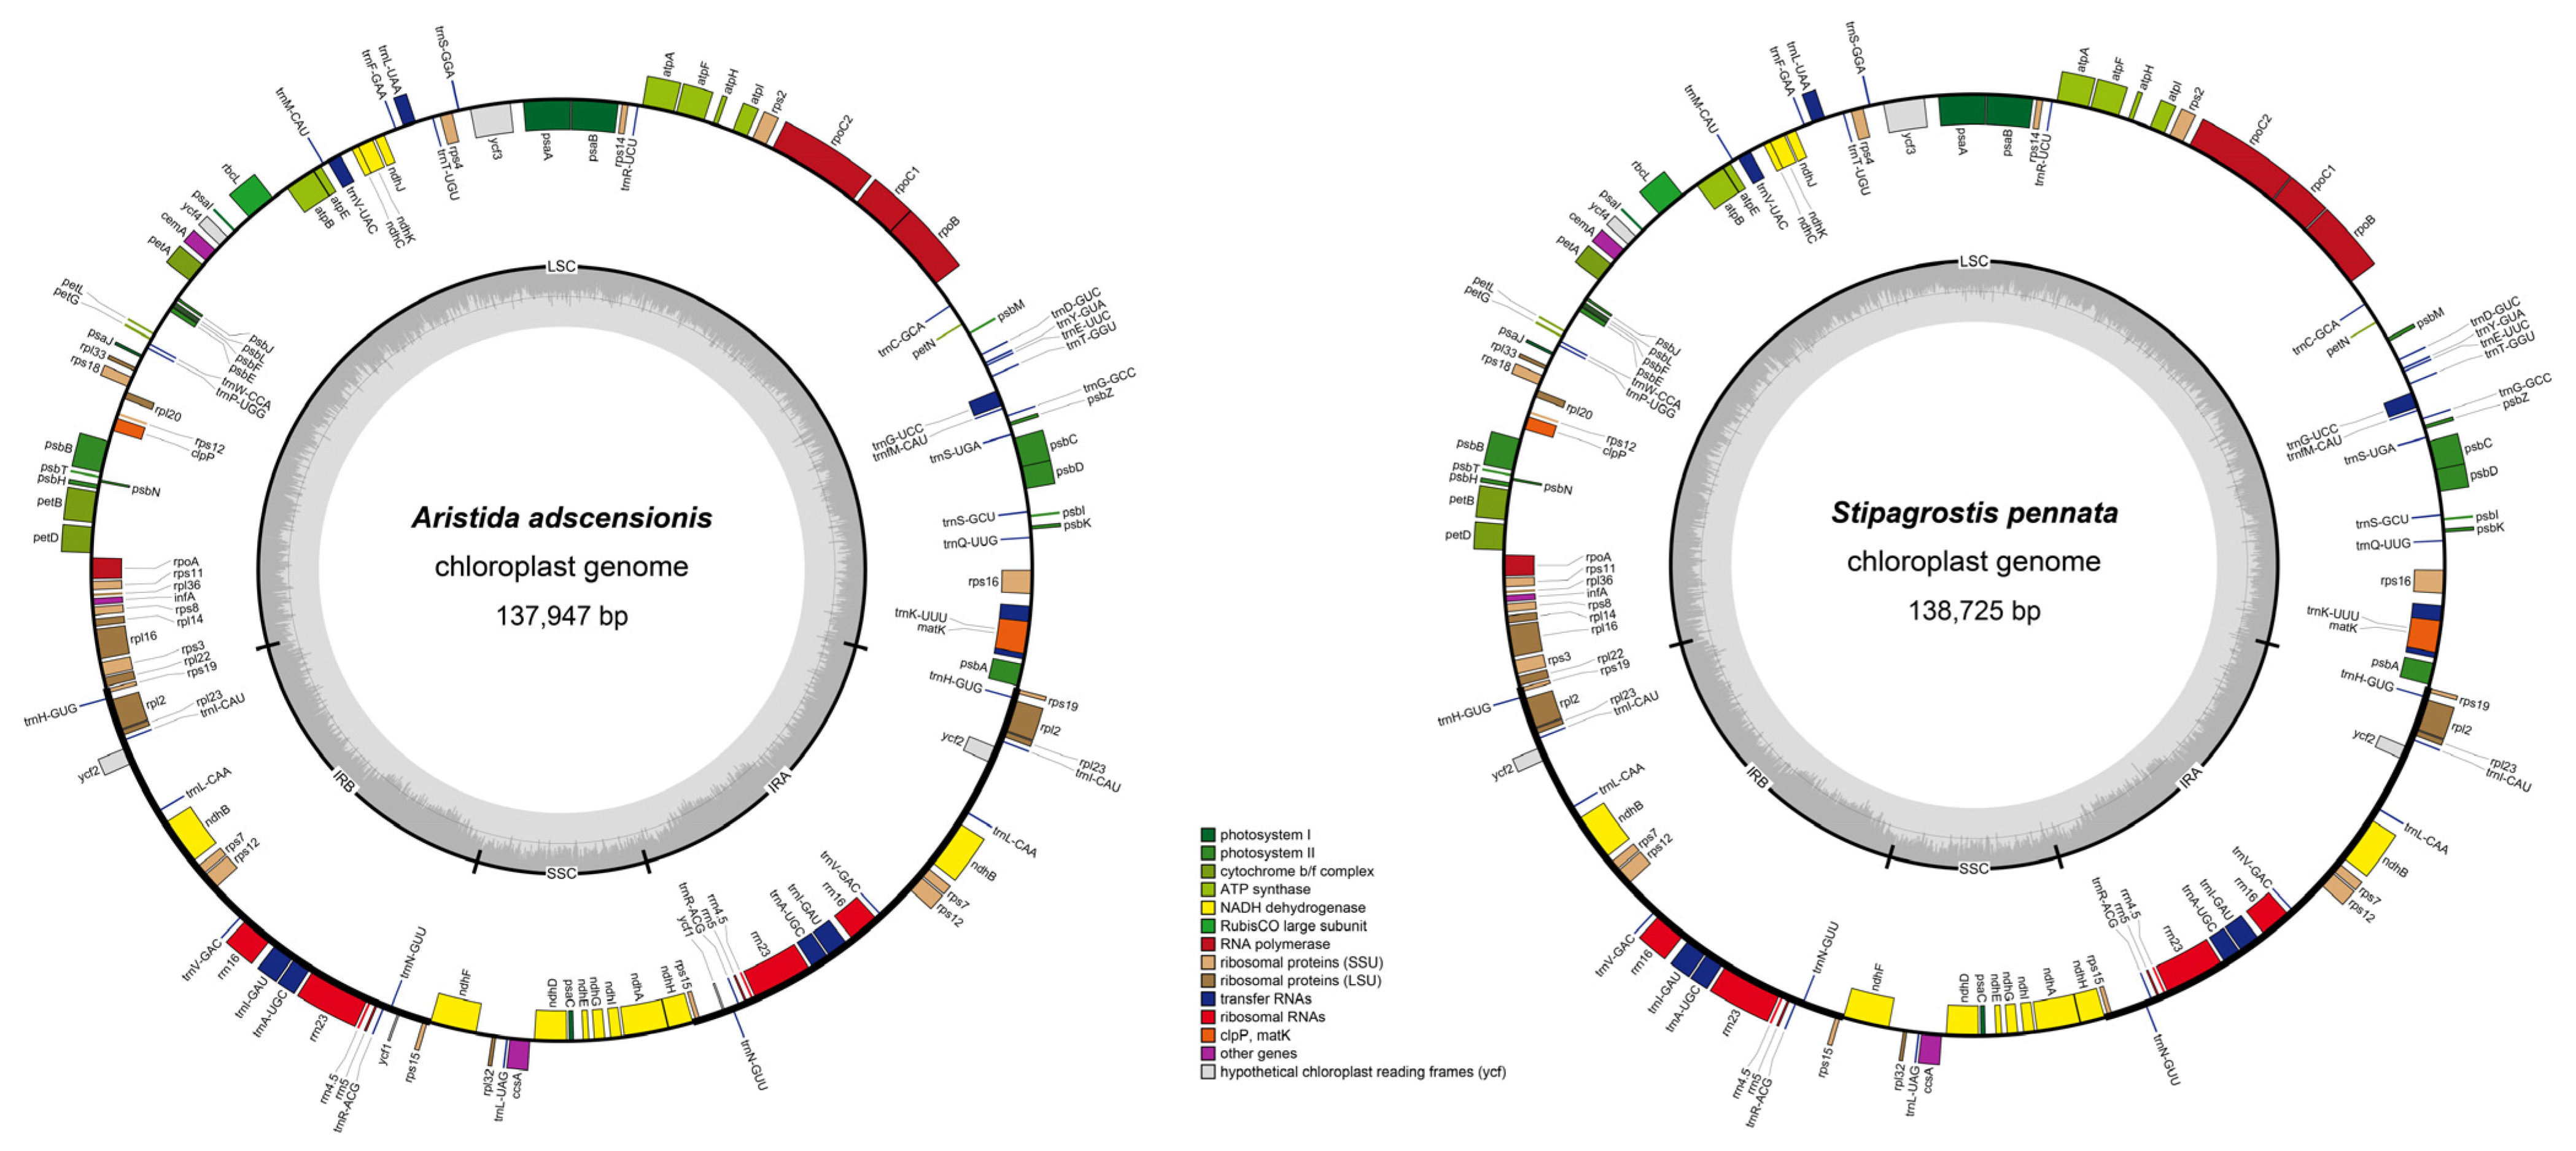
The structural characteristics of 16 Aristidoideae plastomes were analyzed. All 16 plastomes showed a typical quadripartite structure, including a large single-copy region (LSC, 79,421–80,927 bp), a small single-copy region (SSC, 12,348–12,592 bp), and two inverted repeat regions (IR, 19,963–22,797 bp). The total length of these plastomes ranged from 132,603 (Aristida glaziovii) to 138,725 bp (Stipagrostis pennata), with a GC content of about 38.5% (ranging from 38.3% to 38.6% with the average of 38.44%). The IR regions had the highest GC content of 43.9–44.3%, followed by LSC (36.2–36.4%) and SSC (32.3–32.9%). Furthermore, all ten Aristida plastomes encoded 134 functional genes, with 88 protein-coding genes, 38 tRNA genes, and 8 rRNA genes. Three Stipagrostis species and three Sartidia species encoded 132 functional genes, including 86 protein-coding genes, 38 tRNA genes, and 8 rRNA genes (Table 2, Figure 1).
The gene order in Aristidoideae plastomes were basically the same, and no gene rearrangement, such as inversion events, were detected. It was also found that the accD gene had been completely degraded in the whole subfamily. For the ycf1 gene, there were only 120 bp fragments found in Aristida. The ycf2 gene had residues of different lengths in these three genera, and the sizes of the remained fragments ranged from 105 bp to 792 bp. In Aristidoideae species, the ycf3 and rps12 genes contained two introns, and a total of eight genes (ndhB, ndhA, rpl2, rpl16, petB, atpF, petD, and rps16) included one intron. The clpP gene had lost two introns, while the rpoC1 gene had lost one intron (Figure 1).
3.2. Repeat Sequence Analysis
Repeat sequences included interspersed repeat sequences and simple sequence repeats (SSR). A total of 649 (33–50 of each species) interspersed repeat sequences including 403 forward repeats, 237 palindromic repeats, eight reverse repeats, and one complement repeat were identified for 16 Aristidoideae plastomes. Forward repeats (18–34 of each species) and palindrome repeats (12–19 of each species) were found in all species. While reverse repeats were only detected in A. adscensionis, A. purpurea, A. rufescens, and St. pennata, and complementary repeat was only detected in A. purpurea (Figure 2A). In Aristidoideae, most of the repeat units were composed of 30–34 bp (42.373%) and 35–39 bp (30.354%), followed by repeat units > 55 bp (10.940%), 50–54 bp (6.163%), 40–44 bp (5.547%), and 45–49 bp (4.468%) (Figure 2B).
There were 708 simple sequence repeats in Aristidoideae plastomes, including 415 mononucleotide repeats, 130 dinucleotide repeats, 42 trinucleotide repeats, 111 tetranucleotide repeats, nine pentanucleotide repeats, and one hexanucleotide repeat (Table S1). The majority of mononucleotide SSRs were composed of A/T, only one repeat of “C” was detected in Sa. isaloensis, and one repeat of “G” was detected in St. pennata. Three types of dinucleotide repeats AT/TA/TC were found in Aristidoideae, the AC repeat appeared in A. purpurea only once. In addition, there were four types of trinucleotide repeats (AAT/AGA/TTC/CAT), eighteen types of tetranucleotide repeats (AAAT/AACG/AATA/AGAA/ATAG/ATCC/ATTT/CTTT/GAAA/GTAG/TAAA/TATC/TATT/TCGT/TTAT/TTCG/TTCT/TTTA) and seven types of pentanucleotide repeats (AATAG/ATAGA/ATTAG/TATTT/TCTAT/TTAGA/TTTTA). SSRs are more abundant in LSC than in SSC and IR. The vast majority of SSR, all compound SSRs, and pentanucleotide repeats are distributed in the LSC region (Table S1). The correlation analysis between various types of SSRs and chloroplast genome size and GC content showed that the plastome size was significantly negatively correlated with the proportion of single nucleotide repeats, and significantly positively correlated with the proportion of dinucleotide repeats. The GC content of the plastome was significantly positively correlated with the proportion of trinucleotide repeats (Table 3). The statistical SSR location information is listed in Tables S2 and S3.
3.3. Codon Usage Analysis
A total of 50 CDSs were selected for codon preference analysis (Figure 3). The number of codons ranged from 16,986 (A. adscensionis) to 17,101 (St. hirtigluma and St. uniplumis). The number of effective number of codons (ENC) ranged from 49.55 to 49.89 (Table 4). The Aristidoideae plastomes preferred to use synonymous codons ending with A (0.4226–0.4263 for each species) or T (0.4613–0.4643 for each species), while the content of G + G (GC3s) in the third synonymous codon was 0.268–0.273 for each species. The relative synonymous codon usage (RSCU) of all species were 0.28 (CUG) to 2.04 (UUA). Except for Met and Trp, which were encoded by only one codon, with the RSCU = 1, the RCSU values showed that UCA (S) (0.99–1.01 of each species) had almost no preference. Leucine (10.859–10.944%) was the most abundant amino acid for Aristidoideae plastomes, while cysteine (1.052–1.078%) was the least, except in stop codons (0.292–0.294%). There were no significant differences in codon content and frequency of optimal codons among Aristidoideae, and the codon adaptation index (CAI) ranged from 0.166 to 0.168 (Table S4).
3.4. Expansion and Contraction of the IR Region
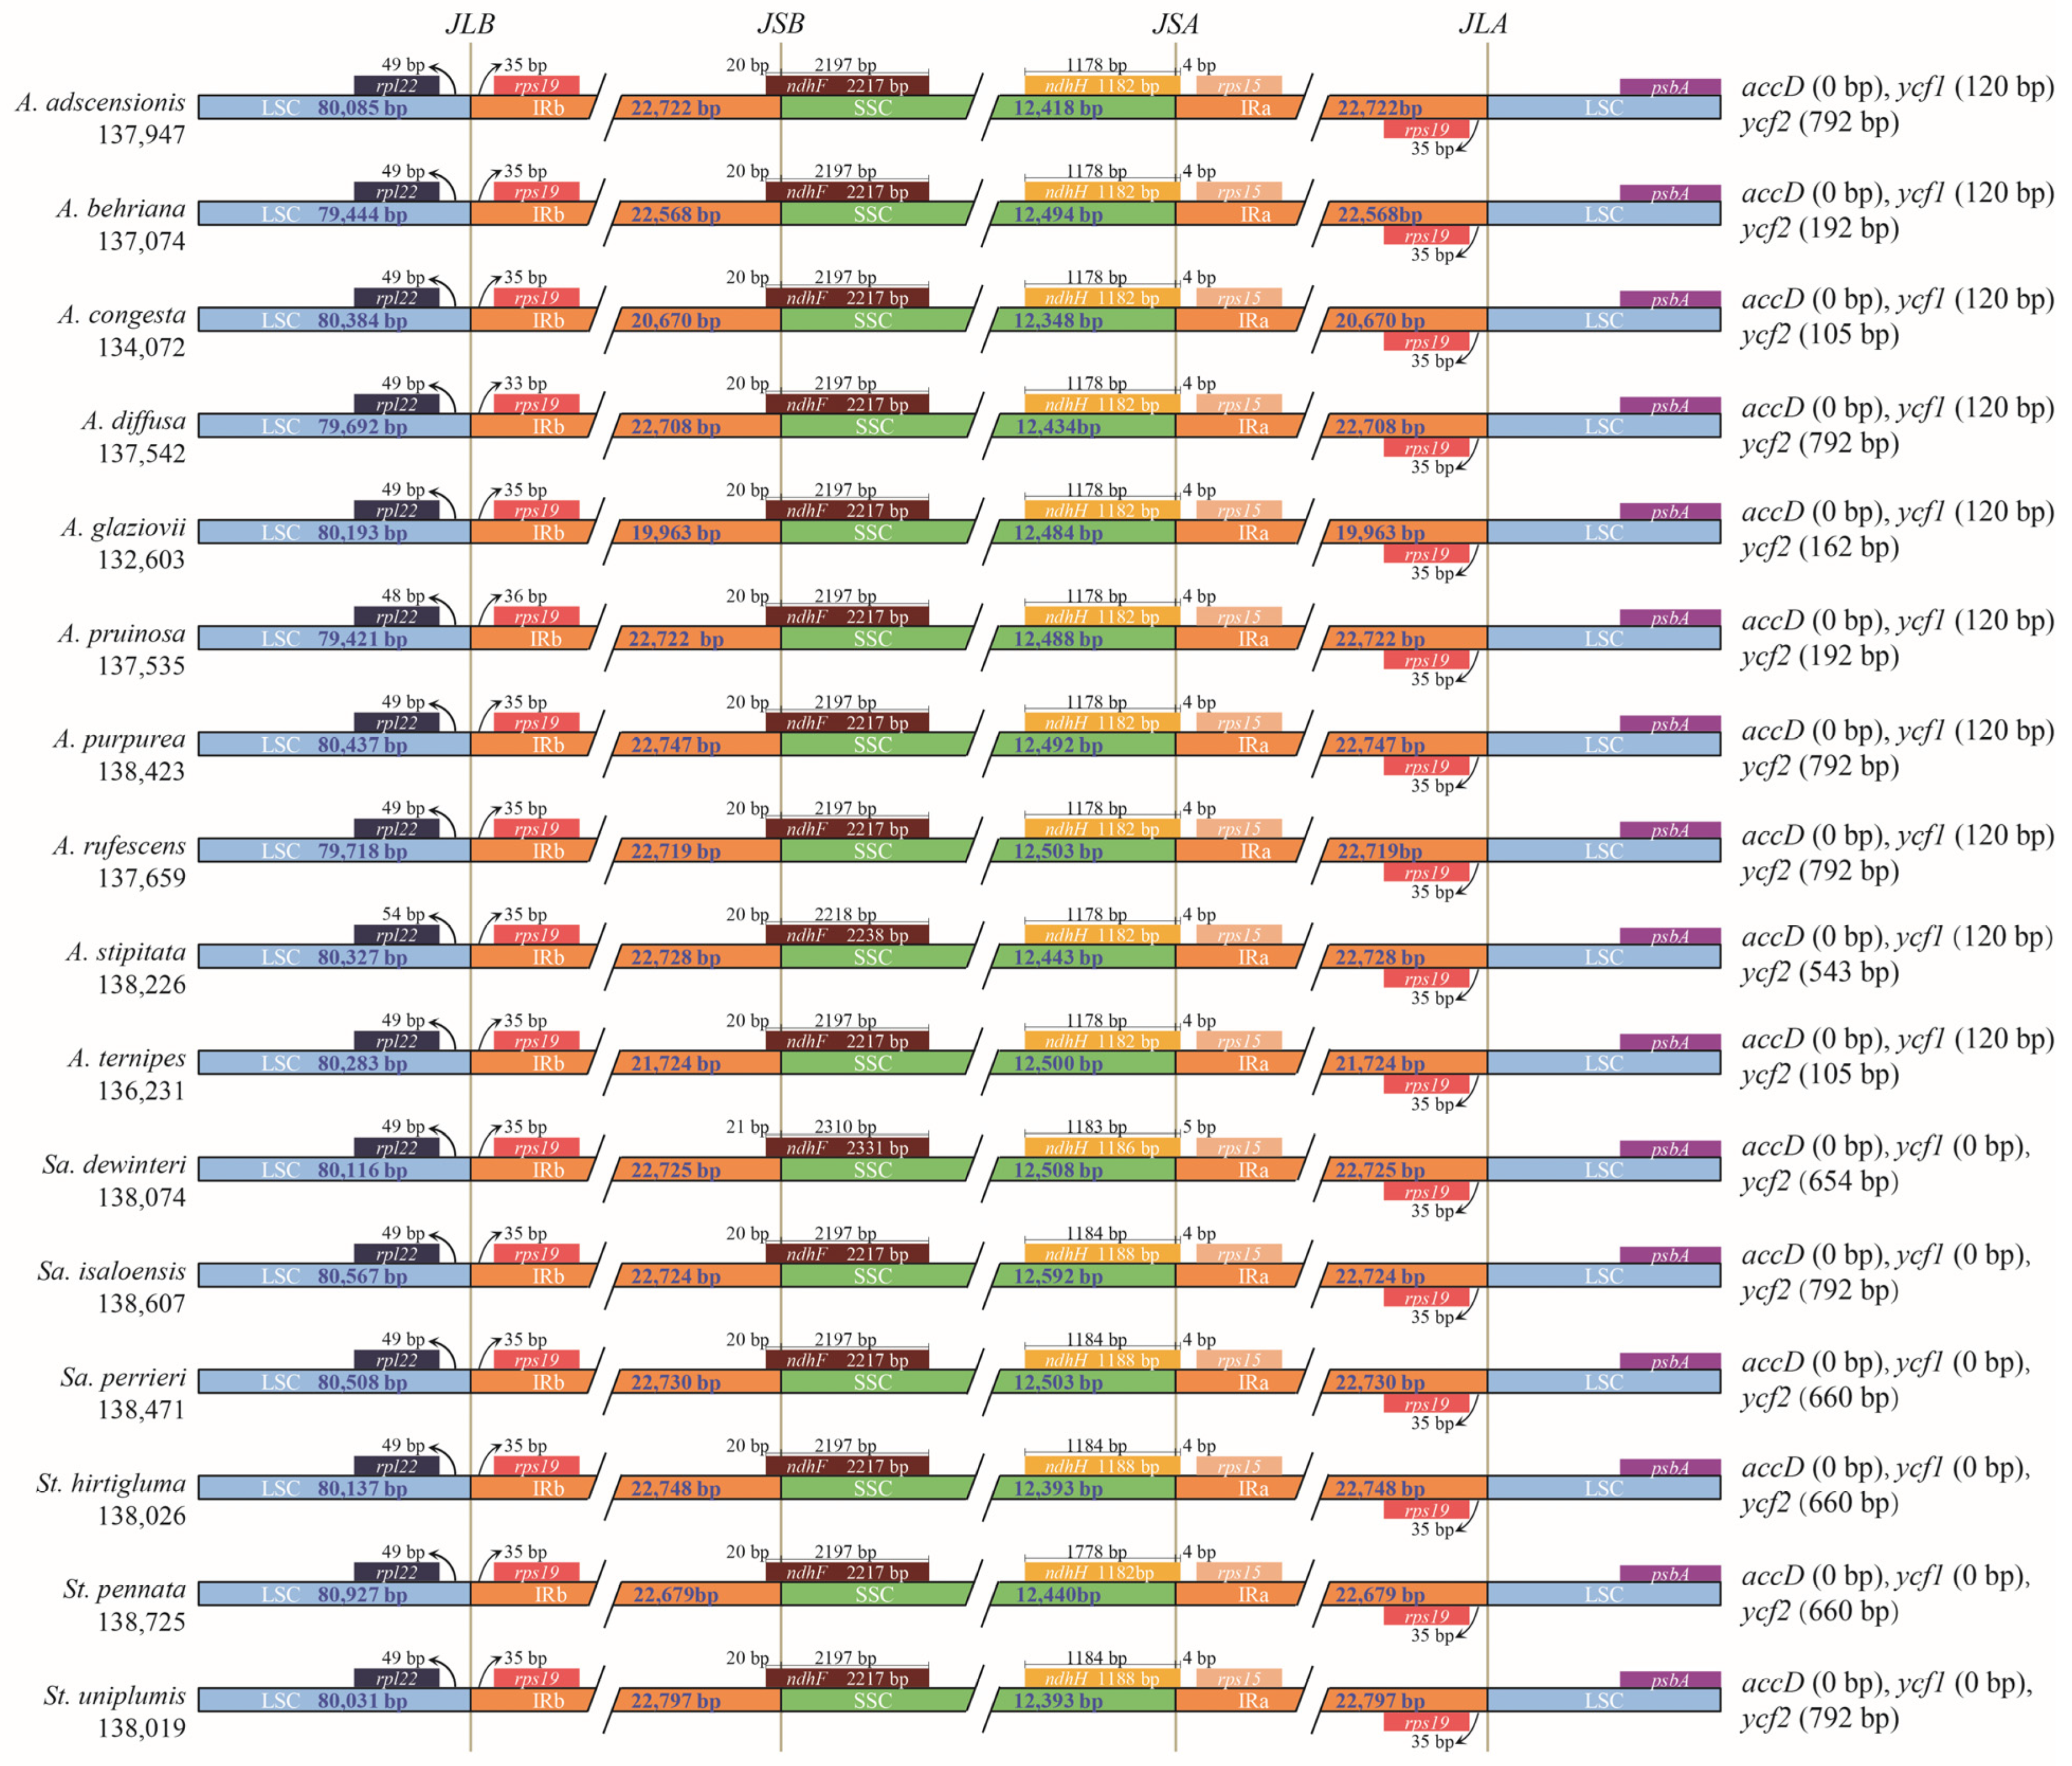
The boundaries of IR/SC for 16 Aristidoideae species were comprehensively compared (Figure 4). The LSC/IRb junctions (JLB) of all Aristidoideae were between rpl22 and rps19. The length of rpl22-rps19 in LSC was 49 bp for nearly all species, except that it was 33 bp in A. diffusa, 48 bp in A. pruinosa, and 54 bp in A. stipitata. The rpl22-rps19 length in IRb was 35 bp, with one exception that the length in A. pruinosa was 36 bp. The SSC/IRb junctions (JSB) of Aristidoideae were located in ndhF, and there were 20 to 21 bp of ndhF duplicated in IRb. The gene ndhH spanned the SSC/IRa junctions (JSA) for Aristidoideae, and only 4–5 bp in the 5′ end of ndhH existed in IRa region. The IRa/LSC junctions (JLA) were located in the intergenic region rps19-psbA. The length of rps19-psbA located in the IRa region was 35 bp for most taxa, but 36 bp in A. pruinosa.
3.5. Comparative Genome Analysis and Identification of Hypervariable Regions
With reference to St. pennata, the structural differences among Aristidoideae plastomes were compared by mVISTA (Figure 5). The Aristida species had a similar structure, while the structures of Sartidia and Stipagrostis plastomes were more similar. For the four parts of the plastome, the SC region had a greater degree of variation than the IR region, and most variation occurred in the non-coding region.
To compare the sequence divergence of Aristidoideae plastomes, the parsimonious information sites were counted for CDS and non-coding sequences. The percentage of parsim-info (Pi%) sites for CDS ranged from 0.196 (ndhB) to 6.965 (rpl32), with an average value of 2.823 (Figure 6A). For non-coding sequences, the Pi% value varied from 0.185 (rps12 intron) to 10.563 (rpl32-trnL-UAG), and the mean value was 4.694 (Figure 6B). In the CDS, with Pi% ≥ 5 as the threshold value, four highly variable sequences (matK, ndhF, infA, and rpl32) were screened. Similarly, with the criterion of Pi% ≥ 9, there were eight highly variable sequences (rpl16 intron, ccsA-ndhD, trnY-GUA-trnD-GUC, ndhF-rpl32, petN-trnC-GCA, trnT-GGU-trnE-UUC, trnG-GCC-trnfM-CAU, and rpl32-trnL-UAG) that were filtered among non-coding sequences.
3.6. Phylogenetic Analysis and Molecular Dating
To determine the placement of Aristidoideae, the phylogenetic relationship of PACMAD was reconstructed based on the complete plastomes. The Maximum Likelihood tree supports Aristidoideae to be a sister to Panicoideae, with a bootstrap value of 100 (Figure S1). The clade composed of Aristidoideae and Panicoideae is firstly diverged among the PACMAD clade. In the present study, the phylogenetic position of Aristidoideae, based on three data sets, were reconstructed with three Panicoideae species as outgroups (Figure 7 and Figures S2–S5). The Maximum Likelihood and Bayesian Inference trees constructed from different data sets showed similar topologies. There is no doubt that Aristidoideae is a monophyletic group with good support (BS = 100, PP = 1). All data strongly supported that Aristida, Stipagrostis, and Sartidia were to be recognized as monophyletic groups (BS = 100, PP = 1). It is well supported that Sartidia and Stipagrostis are sisters to each other, and then form a sister relationship with Aristida (BS = 100, PP = 1). Aristida formed two clades, A. behriana, A. pruinosa, A. purpurea, A. ternipes, and A. glaziovii formed a monophyly, and they were sister groups with the monophyly formed by A. adscensionis, A. congesta, A. diffusa, A. stipitata, and A. rufescens (BS = 100, PP = 1). The estimated divergence time between Stipagrostis and Sartidia is at 11.04 Ma (HDP 95% = 10.47–12.18 Ma) in the Miocene period (Figure 8). The estimated divergence time of Sartidia is at 2.14 Ma (HDP 95% = 1.87–2.72 Ma) in the Pleistocene period.
4. Discussion
4.1. Basic Information of the Aristidoideae Plastomes
The size and structure of plastomes in most higher plants are relatively conservative [54]. The plastome size of angiosperms is generally 120–160 kb, and the length of the plastomes in Aristidoideae species is 132–138 kb, which is consistent with the length characteristics of plastomes in angiosperms [26]. There are 1–6 kb differences in length among the plastomes of 16 Aristidoideae species, which are caused by gene losses and length variation of intergenic regions. The genes ycf1 and ycf2 are the two longest genes in Aristidoideae plastomes. The full name of these two ycf genes is hypothetic chloroplast open reading frame. The function of protein YCF encoded by ycf1 or ycf2 is unknown, but some studies have shown that protein YCF is very important for plant survival [55]. In this study, the gene ycf1 is completely lost from Sartidia and Stipagrostis species, while there are only 120 bp fragments in Aristida species. The retained nucleotides of ycf2 varied from 105 to 792 bp for the 16 Aristidoideae species. The loss of ycf1 and ycf2 is similar to previously reported chloroplast genomes of Poaceae [30,56,57]. The genes ycf1/2 have a higher degree of variation than the commonly used molecular maker matK and are suitable for phylogenetic research [58]. The gene accD encodes the carboxyltransferase β subunit of acetyl-coenzyme A carboxylase, which is the rate-limiting enzyme for lipid synthesis [59]. The accD gene has been completely lost in all 16 Aristidoideae species, and this is very common in Poaceae [60]. In this study, no changes in the order and direction of the chloroplast genes were detected.
Repetitive sequences play a crucial role in the structural rearrangement of plastomes [61]. Studies have shown that repeats were necessary for indels and replacement [62]. The existence and abundance of repeats in chloroplasts or the nuclear genome may be related to a variety of phylogenetic signals [63,64,65]. In this study, the different abundances and types of repeats in Aristidoideae species may provide additional evolutionary information. Among the 16 species of Aristidoideae, the number of repeats varied from 33 to 50, which is similar to the number of repeats previously reported in Poaceae [30,56]. St. pennata has the largest number of repeats, and its chloroplast genome size is the longest. A. diffura and A. pruinosa have the lowest number of repeats, but their chloroplast genome size is not the shortest, which is inconsistent with the previously reported rule that the larger the genome length is, the more repeats there are [66]. In terms of repeat types, the forward repeats were the most, followed by palindromic repeats and reverse repeats, which were consistent with the results of previous studies regarding Eragrostideae and Gentiana [56,67]. Forward repeats are often related to the activity of transposons, and the activity of transposons will lead to changes in gene structure. Forward repeats are usually used as markers for population genetic research [68]. Complementary repeats were the least common repeat types, and were not found in the chloroplast genomes of Eragrostideae [56], Cleistogenes [69], or Avena [30]. Among the 16 Aristidoideae species analyzed in this study, only one complementary repeat was detected in A. purpurea. SSRs are simple sequence repeats, which are widely distributed in the plastome. Due to a high variation degree, SSRs can be used as molecular markers for phylogenetic inference, population genetics, and biogeography [62,70,71]. A total of 712 SSRs were identified in Aristidoideae, with an average of 44.5 SSRs per species, and more than half were single nucleotide repeats. A total of 81.7% SSRs were located in the LSC region, which was close to previously reported plastomes of Avena, Gentiana, and Pterocarpus [30,67,72]. Correlation analysis showed that there was no correlation between the plastome size and the number of total SSRs in Aristidoideae species, which was consistent with the previous results in Symplocarpus [73]. However, there is a significant positive correlation between the plastome size and the proportion of dinucleotide repeats, which may greatly contribute to plastome size. GC content was significantly positively correlated with the proportion of trinucleotide repeats, including these four types of repeat units: AAT, AGA, CTA, and TTC, in 16 Aristidoideae species. SSRs distribution information showed that single nucleotide repeats could provide more parsimony information sites, while polynucleotide repeats were more conservative.
Codons are degenerate. Except methionine and tryptophan, other amino acids are encoded by 2–6 synonymous codons. However, the frequency of synonymous codon usage was different among plastomes [74]. It was generally believed that synonymous codon usage was not random and is species-specific. The analysis of codon preference would provide useful information for understanding species adaptability and molecular evolution [75]. Codon usage preference is influenced by many factors, such as GC content, gene length, tRNA abundance, mutation preference, and gene expression level [76,77,78]. This study revealed that chloroplast genes in Aristidoideae species preferred to use codons ending with A/T, which is consistent with previous studies in other groups [79,80,81,82]. ENC is an important index used to measure codon preference. If the value of ENC is less than 35, the codon bias are strong, and vice versa [83]. The ENC values of plastome genes among Aristidoideae species ranged from 49.55 to 49.85, which indicated that there was a weak codon usage preference in Aristidoideae species. All analyzed parameters suggested that the codon usage of Aristidoideae was relatively conservative, which was in line with the previous research results in Poaceae [56,80].
There are four boundaries between IR and SC regions of the plastome, IRb/LSC, IRb/SSC, IRa/LSC and IRa/SSC. The variation of the chloroplast genome size is frequently caused by the contraction and expansion of IR regions [84,85]. However, in Aristidoideae, the IR boundaries were very conservative, which were consistent with plastomes of Poaceae taxa [41,86]. The gene rps19 was located in the IRb region for Aristidoideae, while it was located in the LSC for Amborella [87], and the same expansion of IRb was found in Eragrostis, Cleistogenes, and Miscanthus of Poaceae [56,69,88]. About 20 bp of ndhF extend to the IRb region in the PACMAD clade of Poaceae [86], which is consistent with the observed structure of JSB for Aristidoideae. Almost all the nucleotides of ndhH located in IRa migrate into SSC region in the PACMAD clade [86]. For Aristidoideae, only 4–5 bp in the 5′ end of ndhH still remain in the IRa region.
4.2. Phylogenetically Informative Markers
It was noted that the Pi% value of the non-coding region (the mean Pi% = 4.694) was significantly higher than that of the coding region (the mean Pi% = 2.823), which was similar to previous studies [28,89,90]. Studies on Eragrostideae, Avena, Gentiana section Cruciata, and Pterocarpus revealed that the variation of SC region in the plastome is greater than that of the IR region [30,40,56,67,72], and the same conclusion was obtained in this study.
Some high mutation regions in plastome sequences can be used as molecular markers for species identification and phylogenetic relationship analysis [91]. The chloroplast genes rbcL, trnH, psbA, and matK have been considered as core plant barcodes for species identification in previous studies, but their resolution at a species level was usually limited [92]. Among the four core markers, only matK was detected as being highly variable in Aristidoideae. The ndhF was screened as divergent marker in Aristidoideae, which has also been used as a maker in Stipa [93]. The identified makers rps32, matK, ndhA, rpl32-trnL-UAG, ndhF-rpl32, trnY-GUA-trnD-GUC, and ccsA-ndhD in Aristidoideae also showed high variability in the study of Avena plastome [30]. Six reported potential markers in Eragrostideae, ndhF, matK, ndhF-rpl32, rpl32-trnL-UAG, trnG-GCC-trnfM-CAU, and ccsA-ndhD, were also found to be highly variable in Aristidoideae [56]. Studies in different Poaceae taxa showed that there are indeed some shared potential markers in Poaceae. The 12 highly variable loci identified in this study will be potential markers for population genetics or phylogenetic studies in Aristidoideae.
4.3. Phylogenetic Relationships of Aristidoideae
In the current study, Aristidoideae is resolved as being a sister to Panicoideae, based on the alignment of 22 complete plastomes from the PACMAD clade. The position of Aristidoideae in the PACMAD clade has been controversial for a long time [3,4,12,94,95]. The crux of the dispute lies in whether the subfamily Panicoideae or Aristidoideae is the basal group of PACMAD clade, namely the ‘panicoid-sister hypothesis’ or the ‘aristidoid-sister hypothesis’ [1,11,12,96]. For example, within PACMAD, the ‘panicoid-sister hypothesis’ or the ‘aristidoid-sister hypothesis’ were supported based on plastome data matrices without or with alignment gaps, respectively [96].
The ML and BI phylogenetic trees of Aristidoideae were reconstructed using the plastome data of 19 species, including ten Aristida species, three Stipagrostis species, three Sartidia species, and three outgroup species. The monophyly of three genera in Aristidoideae is strongly supported (BS = 100, PP = 1). Phylogenetic analysis based on all plastome data matrices indicated that Sartidia is a sister to Stipagrostis (BS = 100, PP = 1) and then a sister to Aristida (BS = 100, PP = 1). However, the phylogenetic tree, based on six chloroplast gene fragments and the nuclear ppc multigene family, support Aristida and Stipagrostis as having formed a sister group [7,13]. The study, which combined chloroplast trnL-F, rpl16, and nuclear ITS sequences, support Aristida to be a sister to the clade composed of Stipagrostis and Sartidia, but only one Sartidia species was included [10]. In addition, some detailed clues in this study may also help to explain the closely-related relationship between Sartidia and Stipagrostis. In terms of the plastome structure, (1) all Aristida species have 120 bp ycf1 gene residues, while in Sartidia and Stipagrostis species, the ycf1 gene was completely degraded; (2) the ndhH gene, located in IRa, was 1182 bp in Aristida species, while its length in Sartidia and Stipagrostis species was 1188 bp. In terms of carbon assimilation, although both Aristida (except A. longifolia) and Stipagrostis perform C4 photosynthesis, there are differences both anatomically and in the phosphoenolpyruvate carboxylase for photosynthesis between the two genera [7]. All Aristidoideae species contain two layers of vascular bundle sheath cells. Two layers of vascular bundle sheath are parenchyma cells in Aristida, while in Sartidia and Stipagrostis only the outer layer of the vascular bundle sheath are parenchyma cells [3,5]. The estimated split time of Stipagrostis and Sartidia is 11.04 Ma (Miocene). Drought may have promoted the divergence of Stipagrostis and Sartidia [97].
Aristida is a large genus with more than 300 species, and there have been few studies on its inter-species relationship. The ten Aristida species sampled in this study are divided into two clades. The clade comprising A. rufescens, A. adscensionis, A. congesta, A. diffusa, and A. stipitata showed the same topologies in all data sets, which was consistent with previous studies [10]. Another clade was composed of A. ternipes, A. glaziovii, A. purpurea, A. behriana, and A. pruinosa. Our results indicated that plastome data can be used as potential super-barcode to reconstruct the interspecies relationships of Aristida. Within Stipagrostis, St. pennata was a sister to the clade comprising St. hirtigluma and St. uniplumis for all three datasets, which was also supported by the study based on chloroplast trnL-F, rpl16 and nuclear ITS [10]. In addition, two species, Stipagrostis grandiglumis and Stipagrostis pennata, originally belonging to Aristida in “Flora Reipublicae Popularis Sinicae”, have been classified into Stipagrostis in “Flora of China” [2,98]. In this study, only Stipagrostis pennata was obtained. The most notable morphological difference distinguishing Stipagrostis pennata from Aristida were the feathery hairs on the awns and the dense sandy sheath on the fibrous roots. Finally, the morphological features and all molecular evidence supported Stipagrostis pennata to be subsumed into Stipagrostis. For Sartidia, the interspecies relationship was not well resolved, which was identical to previous studies [9]. It was indicated that we need more data to illuminate the phylogenetic relationships among Sartidia species.
4.4. Evolutionary Implication of Aristidoideae
The diversification time of Aristida was inferred to be within the Miocene period [10]. The expansion of the savanna in the Miocene period may be related to the prosperity of Aristida [99,100,101]. Stipagrostis and Sartidia were split at 11.04 Ma (Miocene), which may be promoted by the drought event recorded in this period [97].
It is now generally accepted that, while there are only three genera in Aristidoideae, the differences in species diversity among the three genera are significant. There are more than 300 species in Aristida, more than 50 species in Stipagrostis, and only 6 species in Sartidia. A. longifolia, with C3 photosynthesis, is the first diverged taxon from Aristida. The distribution of A. longifolia is limited to the tropical area of central and southern South America. Both Aristida (except A. longifolia) and Stipagrostis, which have a high species richness, have C4 photosynthetic pathways. C4 photosynthesis is a group of complex traits that can increase photosynthetic efficiency under drought, high temperature, and low CO2 conditions. C4 photosynthesis may promote lineage species diversification by reducing extinction rates, increasing speciation rates, or combining the two [102], and have been proposed to be related to the high species diversity of grasses [7]. The distribution of these three genera is associated with the species numbers in each genus. Aristida is widely distributed in tropical and subtropical regions, indicating that Aristida can adapt to various habitats. Stipagrostis, distributed from Africa to Central and West Asia, is a kind of grass that can truly adapt to the desert environment. The seeds of Stipagrostis species have evolved some characteristics, such as a feathery pilose on the awn, to promote its wind spread in the desert [103]. In addition, polyploidization is a common phenomenon in plants, which can induce species diversity, promote speciation, and provide new genetic materials for plant evolution [104,105]. The ploidies of Aristida are varied, with diploid, triploid, and tetraploid structures, Stipagrostis are reported to have diploid and tetraploid, whereas Sartidia has only diploid [10]. The basic chromosome number of all three genera is 11 [3]. The occurrence of polyploidy and the variation of ploidy in Aristida and Stipagrostis may lead to species diversification in each genus.
5. Conclusions
In this study, the complete plastomes of Aristida adscensionis and Stipagrostis pennata were sequenced and assembled for the first time. Comparison of all 16 Aristidoideae plastomes found that they were highly conserved in genome size, gene number, structure, and IR boundary. A total of 12 highly variable regions were identified, which could be used as potential markers for phylogenetics, population genetics, and biogeography of Aristidoideae. In the present study, all phylogenetic trees strongly support the monophyly of Aristidoideae and three genera, and the clade of Aristidoideae and Panicoideae was a sister to other subfamilies in the PACMAD clade. Within Aristidoideae, Aristida is a sister to the clade composed of Stipagrostis and Sartidia. The phylogenetic relationships among sampled Aristida were well resolved. However, the interspecies relationships of Sartidia were still ambiguous, which indicated that nuclear data are needed for resolving the short internal branches. The divergence between C4 Stipagrostis and C3 Sartidia was estimated at 11.04 Ma which may be associated with the drought event in the Miocene period. The difference in species numbers of these three genera may be related to their difference in carbon fixation patterns, geographical distributions, and ploidy. In general, the plastome data used in this study provided insights into the phylogeny and evolution of the subfamily Aristidoideae.
Supplementary Materials
The following are available online at https://www.mdpi.com/article/10.3390/biology11010063/s1, Figure S1: The ML tree of PACMAD based on complete plastomes. Figure S2: The ML tree of 16 Aristidoideae species based on CDS. Figure S3: The BI tree of 16 Aristidoideae species based on CDS. Figure S4: The ML tree of 16 Aristidoideae species based on IGS. Figure S5: The BI tree of 16 Aristidoideae species based on IGS. Table S1: SSRs types and numbers of 16 Aristidoideae plastomes. Table S2: SSRs location in 16 Aristidoideae plastomes. Table S3: The information of SSRs parsimony information locus. Table S4: Codon usage analysis of plastome protein coding genes in 16 Aristidoideae species.
Author Contributions
X.-J.Z. and S.-J.F., designed the experiments. X.-X.G. and X.-J.Q., carried out the experiment and analyzed the data. X.-X.G., wrote the first draft of the manuscript. X.-J.Z., X.-J.Q. and S.-J.F., supervised and completed the writing. All authors have read and agreed to the published version of the manuscript.
Funding
This research was funded by the National Natural Science Foundation of China, grant number 31170173 and 31470298.
Institutional Review Board Statement
Not applicable.
Informed Consent Statement
Not applicable.
Data Availability Statement
All the sequencing data generated in this study has been deposited in GenBank with accession numbers MZ373985 and MZ373986 (https://www.ncbi.nlm.nih.gov/genbank/ (accessed on 27 September 2021)).
Conflicts of Interest
The authors declare no conflict of interest.
References
- Grass Phylogeny Working Group II. New grass phylogeny resolves deep evolutionary relationships and discovers C4 origins. New Phytol. 2012, 193, 304–312. [Google Scholar] [CrossRef] [PubMed] [Green Version]
- Lu, S.L.; Chen, S.L.; Phillips, S.M. Flora of China; Science Press: Beijing, China, 2006; Volume 22. [Google Scholar]
- Kellogg, E.A. Flowering Plants. Monocots; Springer International Publishing: Cham, Switzerland, 2015. [Google Scholar]
- Soreng, R.J.; Peterson, P.M.; Konstantin, R.; Gerrit, D.; Jordan, T. A worldwide phylogenetic classification of the Poaceae (Gramineae) II: An update and a comparison of two 2015 classifications. J. Syst. Evol. 2017, 55, 259–290. [Google Scholar] [CrossRef] [Green Version]
- Cerros-Tlatilpa, R.; Columbus, J.T. C3 photosynthesis in Aristida longifolia: Implication for photosynthetic diversification in Aristidoideae (Poaceae). Am. J. Bot. 2009, 96, 1379–1387. [Google Scholar] [CrossRef] [PubMed]
- Balkwill, K.; Campbell-Young, G.J.; Fish, L.; Munday, J.; Frean, M.L.; Stalmans, M. A new species of Sartidia (Graminae), endemic to ultramafic soils. S. Afr. J. Bot. 2011, 77, 598–607. [Google Scholar] [CrossRef] [Green Version]
- Christin, P.-A.; Besnard, G. Two independent C4 origins in Aristidoideae (Poaceae) revealed by the recruitment of distinct phosphoenolpyruvate carboxylase genes. Am. J. Bot. 2009, 96, 2234–2239. [Google Scholar] [CrossRef] [PubMed]
- Christin, P.-A.; Besnard, G.; Samaritani, E.; Duvall, M.R.; Hodkinson, T.R.; Savolainen, V.; Salamin, N. Oligocene CO2 decline promoted C4 photosynthesis in grasses. Curr. Biol. 2008, 18, 37–43. [Google Scholar] [CrossRef] [Green Version]
- Besnard, G.; Christin, P.-A.; Malé, P.-J.G.; Lhuillier, E.; Lauzeral, C.; Coissac, E.; Vorontsova, M.S. From museums to genomics: Old herbarium specimens shed light on a C3 to C4 transition. J. Exp. Bot. 2014, 65, 6711–6721. [Google Scholar] [CrossRef]
- Cerros-Tlatilpa, R.; Columbus, J.T.; Barker, N.P. Phylogenetic relationships of Aristida and relatives (Poaceae, Aristidoideae) based on noncoding chloroplast (trnL-F, rpl16) and nuclear (ITS) DNA sequences. Am. J. Bot. 2011, 98, 1868–1886. [Google Scholar] [CrossRef]
- Cotton, J.L.; Wysocki, W.P.; Clark, L.G.; Kelchner, S.A.; Pires, J.C.; Edger, P.P.; Mayfield-Jones, D.; Duvall, M.R. Resolving deep relationships of PACMAD grasses: A phylogenomic approach. BMC Plant Biol. 2015, 15, 178. [Google Scholar] [CrossRef] [Green Version]
- Saarela, J.M.; Burke, S.V.; Wysocki, W.P.; Barrett, M.D.; Duvall, M.R. A 250 plastome phylogeny of the grass family (Poaceae): Topological support under different data partitions. PeerJ 2018, 6, e4299. [Google Scholar] [CrossRef] [PubMed]
- Grass Phylogeny Working Group. Phylogeny and Subfamilial Classification of the Grasses (Poaceae). Ann. Mo. Bot. Gard. 2001, 88, 373–457. [Google Scholar] [CrossRef]
- Exell, A.W. Flora Zambesiaca. 1971, Volume 10, pp. 67–70. Available online: https://www.zobodat.at/pdf/Mitt-Bot-StaatsS-Muenchen_10_0069-0070.pdf (accessed on 7 October 2021).
- Zhu, L. Systematic Studies on the Genus of Aristida. Master’s Thesis, Shandong Normal University, Jinan, China, 2007. [Google Scholar]
- Clayton, W. GrassBase—The Online World Grass Flora; Royal Botanic Gardens: London, UK, 2008. [Google Scholar]
- Wicke, S.; Schneeweiss, G.M.; Depamphilis, C.W.; Müller, K.F.; Quandt, D. The evolution of the plastid chromosome in land plants: Gene content, gene order, gene function. Plant Mol. Biol. 2011, 76, 273–297. [Google Scholar] [CrossRef] [Green Version]
- Daniell, H.; Lin, C.S.; Yu, M.; Chang, W.J. Chloroplast genomes: Diversity, evolution, and applications in genetic engineering. Genome Biol. 2016, 17, 134. [Google Scholar] [CrossRef] [Green Version]
- Shinozaki, K.; Ohme, M.; Tanaka, M.; Wakasugi, T.; Sugiura, M. The complete nucleotide sequence of the tobacco chloroplast genome: Its gene organization and expression. Plant Mol. Biol. Rep. 1986, 5, 2043–2049. [Google Scholar] [CrossRef]
- Ohyama, K.; Fukuzawa, H.; Kohchi, T.; Shirai, H.; Sano, T.; Sano, S.; Umesono, K.; Shiki, Y.; Takeuchi, M.; Chang, Z. Chloroplast gene organization deduced from complete sequence of liverwort Marchantia polymorpha chloroplast DNA. Nature 1986, 322, 572–574. [Google Scholar] [CrossRef]
- Palmer, J.D.; Stein, D.B. Conservation of chloroplast genome structure among vascular plants. Curr. Genet. 1986, 10, 823–833. [Google Scholar] [CrossRef]
- Bock, R.; Knoop, V. Genomics of Chloroplasts and Mitochondria; Springer International Publishing: Cham, Switzerland, 2012. [Google Scholar]
- Knox, E.B. The dynamic history of plastid genomes in the Campanulaceae sensu lato is unique among angiosperms. Proc. Natl. Acad. Sci. USA 2014, 111, 11097–11102. [Google Scholar] [CrossRef] [Green Version]
- Cai, Z.Q.; Guisinger, M.; Kim, H.G.; Ruck, E.; Blazier, J.C.; Mcmurtry, V.; Kuehl, J.V.; Boore, J.; Jansen, R.K. Extensive reorganization of the plastid genome of Trifolium subterraneum (Fabaceae) is associated with numerous repeated sequences and novel DNA insertions. J. Mol. Evol. 2008, 67, 696–704. [Google Scholar] [CrossRef] [PubMed]
- Mao-Lun, W.; Blazier, J.C.; Madhumita, G.; Jansen, R.K. Reconstruction of the ancestral plastid genome in Geraniaceae reveals a correlation between genome rearrangements, repeats, and nucleotide substitution rates. Mol. Biol. Evol. 2014, 31, 645–659. [Google Scholar] [CrossRef] [Green Version]
- Chumley, T.W.; Palmer, J.D.; Mower, J.P.; Fourcade, H.M.; Calie, P.J.; Boore, J.L.; Jansen, R.K. The complete chloroplast genome sequence of Pelargonium × hortorum: Organization and evolution of the largest and most highly rearranged chloroplast genome of land plants. Mol. Biol. Evol. 2006, 23, 2175–2190. [Google Scholar] [CrossRef]
- Zhang, Y.J.; Li, D.Z. Advances in phylogenomics based on complete chloroplast genomes. Plant Divers. Resour. 2011, 33, 365–375. [Google Scholar] [CrossRef] [Green Version]
- Clegg, M.T.; Gaut, B.S.; Learn, G.H., Jr.; Morton, B.R. Rates and patterns of chloroplast DNA evolution. Proc. Natl. Acad. Sci. USA 1994, 91, 6795–6801. [Google Scholar] [CrossRef] [Green Version]
- Zhang, F.J.; Wang, T.; Shu, X.C.; Wang, N.; Zhuang, W.B.; Wang, Z. Complete chloroplast genomes and comparative analyses of L. chinensis, L. anhuiensis, and L. aurea (Amaryllidaceae). Int. J. Mol. Sci. 2020, 21, 5729. [Google Scholar] [CrossRef]
- Liu, Q.; Li, X.Y.; Li, M.Z.; Xu, W.K.; Heslop-Harrison, J.S. Comparative chloroplast genome analyses of Avena: Insights into evolutionary dynamics and phylogeny. BMC Plant Biol. 2020, 20, 406. [Google Scholar] [CrossRef]
- Xie, D.F.; Yu, H.X.; Price, M.; Xie, C.; Deng, Y.Q.; Chen, J.P.; Yu, Y.; Zhou, S.D.; He, X.J. Phylogeny of Chinese Allium species in section Daghestanica and adaptive evolution of Allium (Amaryllidaceae, Allioideae) species revealed by the chloroplast complete Genome. Front. Plant Sci. 2019, 10, 460. [Google Scholar] [CrossRef] [PubMed] [Green Version]
- Doyle, J.; Doyle, J. A rapid DNA isolation procedure from small quantities of fresh leaf tissues. Phytochemistry 1986, 19, 11–15. [Google Scholar]
- Qu, X.J.; Fan, S.J.; Wicke, S.; Yi, T.S. Plastome reduction in the only parasitic gymnosperm Parasitaxus is due to Losses of photosynthesis but not housekeeping genes and apparently involves the secondary gain of a large inverted repeat. Genome Biol. Evol. 2019, 11, 2789–2796. [Google Scholar] [CrossRef] [PubMed]
- Qu, X.J.; Moore, M.J.; Li, D.Z.; Yi, T.S. PGA: A software package for rapid, accurate, and flexible batch annotation of plastomes. Plant Methods 2019, 15, 50. [Google Scholar] [CrossRef] [PubMed] [Green Version]
- Greiner, S.; Lehwark, P.; Bock, R. OrganellarGenomeDRAW (OGDRAW) version 1.3.1: Expanded toolkit for the graphical visualization of organellar genomes. Nucleic Acids Res. 2019, 47, W59–W64. [Google Scholar] [CrossRef] [PubMed] [Green Version]
- Stefan, K.; Choudhuri, J.V.; Enno, O.; Chris, S.; Jens, S.; Robert, G. REPuter: The manifold applications of repeat analysis on a genomic scale. Nucleic Acids Res. 2001, 29, 4633–4642. [Google Scholar] [CrossRef] [Green Version]
- Beier, S.; Thiel, T.; Münch, T.; Scholz, U.; Mascher, M. MISA-web: A web server for microsatellite prediction. Bioinformatics 2017, 33, 2583–2585. [Google Scholar] [CrossRef] [Green Version]
- Huang, J.; Yu, Y.; Liu, Y.M.; Xie, D.F.; He, X.J.; Zhou, S.D. Comparative chloroplast genomics of Fritillaria (Liliaceae), inferences for phylogenetic relationships between Fritillaria and Lilium and plastome evolution. Plants 2020, 9, 133. [Google Scholar] [CrossRef] [Green Version]
- Wright, F. The ‘effective number of codons’ used in a gene. Gene 1990, 87, 23–29. [Google Scholar] [CrossRef]
- Wu, L.W.; Nie, L.P.; Xu, Z.C.; Li, P.; Yao, H. Comparative and phylogenetic analysis of the complete chloroplast genomes of three Paeonia Section Moutan Species (Paeoniaceae). Front. Genet. 2020, 11, 980. [Google Scholar] [CrossRef] [PubMed]
- Somaratne, Y.; Guan, D.L.; Abbood, N.N.; Zhao, L.; Wang, W.Q.; Xu, S.Q. Comparison of the complete Eragrostis pilosa chloroplast genome with its relatives in Eragrostideae (Chloridoideae; Poaceae). Plants 2019, 8, 485. [Google Scholar] [CrossRef] [Green Version]
- Frazer, K.A.; Pachter, L.; Poliakov, A.; Rubin, E.M.; Dubchak, I. VISTA: Computational tools for comparative genomics. Nucleic Acids Res. 2004, 32, W273–W279. [Google Scholar] [CrossRef] [PubMed]
- Kumar, S.; Stecher, G.; Tamura, K. MEGA7: Molecular evolutionary genetics analysis version 7.0 for bigger datasets. Mol. Biol. Evol. 2016, 33, 1870–1874. [Google Scholar] [CrossRef] [PubMed] [Green Version]
- Wang, Y.H.; Qu, X.J.; Chen, S.Y.; Li, D.Z.; Yi, T.S. Plastomes of Mimosoideae: Structural and size variation, sequence divergence, and phylogenetic implication. Tree Genet. Genom. 2017, 13, 41. [Google Scholar] [CrossRef]
- Katoh, K.; Standley, D.M. MAFFT multiple sequence alignment software version 7: Improvements in performance and usability. Mol. Biol. Evol. 2013, 30, 772–780. [Google Scholar] [CrossRef] [Green Version]
- Akaike, H. A new look at the statistical model identification. IEEE Trans. Autom. Control 1974, 19, 716–723. [Google Scholar] [CrossRef]
- Darriba, D.; Taboada, G.L.; Doallo, R.; Posada, D. jModelTest 2: More models, new heuristics and parallel computing. Nat. Methods 2012, 9, 772. [Google Scholar] [CrossRef] [Green Version]
- Stamatakis, A. RAxML version 8: A tool for phylogenetic analysis and post-analysis of large phylogenies. Bioinformatics 2014, 30, 1312–1313. [Google Scholar] [CrossRef] [PubMed]
- Huelsenbeck, J.P.; Ronquist, F. MRBAYES: Bayesian inference of phylogenetic trees. Bioinformatics 2001, 17, 754–755. [Google Scholar] [CrossRef] [PubMed] [Green Version]
- Drummond, A.J.; Suchard, M.A.; Xie, D.; Rambaut, A. Bayesian phylogenetics with BEAUti and the BEAST 1.7. Mol. Biol. Evol. 2012, 22, 1185–1192. [Google Scholar] [CrossRef] [PubMed] [Green Version]
- Smith, S.A.; O’Meara, B.C. treePL: Divergence time estimation using penalized likelihood for large phylogenies. Bioinformatics 2012, 28, 2689–2690. [Google Scholar] [CrossRef] [PubMed]
- Vicentini, A.; Barber, J.C.; Aliscioni, S.S.; Giussani, L.M.; Kellogg, E.A. The age of the grasses and clusters of origins of C4 photosynthesis. Glob. Change Biol. 2008, 14, 2963–2977. [Google Scholar] [CrossRef]
- Bouchenak-Khelladi, Y.; Verboom, G.A.; Hodkinson, T.R.; Salamin, N.; Francois, O.; Chonghaile, G.N.; Savolainen, V. The origins and diversification of C4 grasses and savanna-adapted ungulates. Glob. Change Biol. 2010, 15, 2397–2417. [Google Scholar] [CrossRef]
- Palmer, J.D. Comparative organization of chloroplast genomes. Annu. Rev. Genet. 1985, 19, 325–354. [Google Scholar] [CrossRef]
- Drescher, A.; Ruf, S.; Calsa, T.; Carrer, H.; Bock, R. The two largest chloroplast genome-encoded open reading frames of higher plants are essential genes. Plant J. 2000, 22, 97–104. [Google Scholar] [CrossRef]
- Liu, K.; Wang, R.; Guo, X.X.; Zhang, X.J.; Qu, X.J.; Fan, S.J. Comparative and phylogenetic analysis of complete chloroplast genomes in Eragrostideae (Chloridoideae, Poaceae). Plants 2021, 10, 109. [Google Scholar] [CrossRef]
- Oh, S.-D.; Lee, S.-K.; Yun, D.-W.; Sun, H.-J.; Kang, H.-G.; Lee, H.-Y.; Xi, H.; Park, J.; Lee, B. The complete chloroplast genome of Zoysia macrostachya (Poaceae): Insights into intraspecific variations and species delimitation of the Zoysia species. Korean J. Plant Taxon 2021, 51, 326–331. [Google Scholar] [CrossRef]
- Timme, R.E.; Kuehl, J.V.; Boore, J.L.; Jansen, R.K. A comparative analysis of the Lactuca and Helianthus (Asteraceae) plastid genomes: Identification of divergent regions and categorization of shared repeats. Am. J. Bot. 2007, 94, 302–312. [Google Scholar] [CrossRef] [PubMed]
- Lee, S.S.; Jeong, W.J.; Bae, J.M.; Bang, J.W.; Liu, J.R.; Harn, C.H. Characterization of the plastid-encoded carboxyltransferase subunit (accD) gene of potato. Mol. Cells 2004, 17, 422–429. [Google Scholar] [CrossRef] [PubMed]
- Tang, P.; Ruan, Q.Y.; Peng, C. Phylogeny in structure alterations of Poaceae cpDNA. Chin. Agr. Sci. Bull. 2011, 27, 171–176. [Google Scholar]
- Nie, X.J.; Lv, S.Z.; Zhang, Y.X.; Du, X.H.; Wang, L.; Biradar, S.S.; Tan, X.F.; Wan, F.H.; Song, W.N. Complete chloroplast genome sequence of a major invasive species, Crofton Weed (Ageratina adenophora). PLoS ONE 2012, 7, e36869. [Google Scholar] [CrossRef] [PubMed] [Green Version]
- Yi, X.; Gao, L.; Wang, B.; Su, Y.J.; Wang, T. The complete chloroplast genome sequence of Cephalotaxus oliveri (Cephalotaxaceae): Evolutionary comparison of Cephalotaxus chloroplast DNAs and insights into the loss of inverted repeat copies in Gymnosperms. Genome Biol. Evol. 2013, 5, 688–698. [Google Scholar] [CrossRef] [PubMed] [Green Version]
- Zhang, Y.-J.; Ma, P.-F.; Li, D.-Z. High-throughput sequencing of six Bamboo chloroplast genomes: Phylogenetic implications for temperate woody Bamboos (Poaceae: Bambusoideae). PLoS ONE 2011, 6, e20596. [Google Scholar] [CrossRef] [Green Version]
- Stevenv, D.; Chase, M.W.; Kelly, L.J.; Leitch, I.J.; Macas, J.; Novak, P.; Mathieu, P.; Hanna, W.-S.; Leitch, A.R. Genomic repeat abundances contain phylogenetic signal. Syst. Biol. 2015, 64, 112–126. [Google Scholar] [CrossRef] [Green Version]
- Wang, W.C.; Chen, S.Y.; Zhang, X.Z.; Chen, Z.H. Chloroplast genome evolution in Actinidiaceae: clpP Loss, heterogenous divergence and phylogenomic practice. PLoS ONE 2016, 11, e0162324. [Google Scholar] [CrossRef]
- Rubinsztein, D.C.; Amos, W.; Leggo, J.; Goodburn, S.; Jain, S.; Li, S.-H.; Margolis, R.L.; Ross, C.A.; Ferguson-Smith, M.A. Microsatellite evolution-evidence for directionality and variation in rate between species. Nat. Genet. 1995, 10, 337–343. [Google Scholar] [CrossRef]
- Zhou, T.; Wang, J.; Jia, Y.; Li, W.L.; Xu, F.S.; Wang, X.M. Comparative chloroplast genome analyses of species in Gentiana section Cruciata (Gentianaceae) and the development of authentication markers. Int. J. Mol. Sci. 2018, 19, 1962. [Google Scholar] [CrossRef] [PubMed] [Green Version]
- Gu, C.H.; Dong, B.; Xu, L.; Tembrock, L.R.; Zheng, S.Y.; Wu, Z.Q. The complete chloroplast genome of Heimia myrtifolia and comparative analysis within Myrtales. Molecules 2018, 23, 846. [Google Scholar] [CrossRef] [PubMed] [Green Version]
- Wang, R.; Liu, K.; Zhang, X.J.; Chen, W.L.; Qu, X.J.; Fan, S.J. Comparative plastomes and phylogenetic analysis of Cleistogenes and closely related genera (Poaceae). Front. Plant Sci. 2021, 12, 638597. [Google Scholar] [CrossRef] [PubMed]
- Gong, W.L.; Ma, L.; Gong, P.; Liu, X.Q.; Wang, Z.; Zhao, G.Q. Development and application of EST–SSRs markers for analysis of genetic diversity in erect milkvetch (Astragalus adsurgens Pall.). Mol. Biol. Rep. 2019, 46, 1323–1326. [Google Scholar] [CrossRef]
- Pauwels, M.; Vekemans, X.; Gode’, C.c.; Fre´rot, H.l.n.; Castric, V.; Saumitou-Laprade, P. Nuclear and chloroplast DNA phylogeography reveals vicariance among European populations of the model species for the study of metal tolerance, Arabidopsis halleri (Brassicaceae). New Phytol. 2012, 193, 916–928. [Google Scholar] [CrossRef]
- Hong, Z.; Wu, Z.Q.; Zhao, K.K.; Yang, Z.J.; Tembrock, L.R.; Xu, D.P. Comparative analyses of five complete chloroplast genomes from the genus Pterocarpus (Fabacaeae). Int. J. Mol. Sci. 2020, 21, 3758. [Google Scholar] [CrossRef] [PubMed]
- Kim, S.H.; Yang, J.; Park, J.; Yamada, T.; Kim, S.C. Comparison of whole plastome sequences between thermogenic Skunk Cabbage Symplocarpus renifolius and Nonthermogenic S. nipponicus (Orontioideae; Araceae) in East Asia. Int. J. Mol. Sci. 2019, 20, 4678. [Google Scholar] [CrossRef] [Green Version]
- Grantham, R.; Gautier, C.; Gouy, M. Codon frequencies in 119 individual genes confirm consistent choices of degenerate bases according to genome type. Nucleic Acids Res. 1980, 8, 1893–1912. [Google Scholar] [CrossRef]
- Grantham, R.; Gautier, C.; Gouy, M.; Jacobzone, M.; Mercier, R. Codon catalog usage is a genome strategy modulated for gene expressivity. Nucleic Acids Res. 1981, 9, 43–74. [Google Scholar] [CrossRef] [Green Version]
- Wan, X.F.; Xu, D.; Kleinhofs, A.; Zhou, J.Z. Quantitative relationship between synonymous codon usage bias and GC composition across unicellular genomes. BMC Evol. Biol. 2004, 4, 19. [Google Scholar] [CrossRef] [PubMed] [Green Version]
- Olejniczak, M.; Uhlenbeck, O.C. tRNA residues that have coevolved with their anticodon to ensure uniform and accurate codon recognition. Biochimie 2006, 88, 943–950. [Google Scholar] [CrossRef] [PubMed]
- Hiraoka, Y.; Kawamata, K.; Haraguchi, T.; Chikashige, Y. Codon usage bias is correlated with gene expression levels in the fission yeast Schizosaccharomyces pombe. Genes Cells 2010, 14, 499–509. [Google Scholar] [CrossRef] [PubMed]
- Liu, Q.P.; Xue, Q.Z. Comparative studies on codon usage pattern of chloroplasts and their host nuclear genes in four plant species. J. Genet. 2005, 84, 55–62. [Google Scholar] [CrossRef] [PubMed]
- Zhang, Y.R.; Nie, X.J.; Jia, X.O.; Zhao, C.Z.; Biradar, S.S.; Wang, L.; Du, X.H.; Song, W.N. Analysis of codon usage patterns of the chloroplast genomes in the Poaceae family. Aust. J. Bot. 2012, 60, 461–470. [Google Scholar] [CrossRef] [Green Version]
- Sablok, G.; Nayak, K.C.; Vazquez, F.; Tatarinova, T.V. Synonymous codon usage, GC(3), and evolutionary patterns across plastomes of three pooid model species: Emerging grass genome models for monocots. Mol. Biotechnol. 2011, 49, 116–128. [Google Scholar] [CrossRef]
- Zhou, M.; Long, W.; Li, X. Patterns of synonymous codon usage bias in chloroplast genomes of seed plants. For. Stud. China 2008, 11, 235–242. [Google Scholar] [CrossRef]
- Jiang, Y.; Deng, F.; Wang, H.L.; Hu, Z.H. An extensive analysis on the global codon usage pattern of baculoviruses. Arch. Virol. 2008, 153, 2273–2282. [Google Scholar] [CrossRef]
- Palmer, J.D.; Nuggent, J.M.; Herbon, L.A. Unusual structure of geranium chloroplast DNA: A triple-sized inverted repeat, extensive gene duplications, multiple inversions, and two repeat families. Proc. Natl. Acad. Sci. USA 1987, 84, 769–773. [Google Scholar] [CrossRef] [Green Version]
- He, S.L.; Yang, Y.; Li, Z.W.; Wang, X.J.; Guo, Y.B.; Wu, H.Z. Comparative analysis of four Zantedeschia chloroplast genomes: Expansion and contraction of the IR region, phylogenetic analyses and SSR genetic diversity assessment. PeerJ 2020, 8, e9132. [Google Scholar] [CrossRef]
- Davis, J.I.; Soreng, R.J. Migration of endpoints of two genes relative to boundaries between regions of the plastid genome in the grass family (Poaceae). Am. J. Bot. 2010, 97, 874–892. [Google Scholar] [CrossRef] [Green Version]
- Goremykin, V.V.; Hirsch-Ernst, K.I.; Stefan, W.; Hellwig, F.H. Analysis of the Amborella trichopoda chloroplast genome sequence suggests that amborella is not a basal angiosperm. Mol. Biol. Evol. 2003, 20, 1499–1505. [Google Scholar] [CrossRef]
- Sheng, J.; Yan, M.; Wang, J.; Zhao, L.; Zhou, F.; Hu, Z.; Jin, S.; Diao, Y. The complete chloroplast genome sequences of five Miscanthus species, and comparative analyses with other grass plastomes. Ind. Crop. Prod. 2021, 162, 113248. [Google Scholar] [CrossRef]
- Perry, A.S.; Wolfe, K.H. Nucleotide substitution rates in legume chloroplast DNA depend on the presence of the inverted repeat. J. Mol. Evol. 2002, 55, 501–508. [Google Scholar] [CrossRef] [PubMed]
- Huang, H.; Shi, C.; Liu, Y.; Mao, S.Y.; Gao, L.Z. Thirteen Camellia chloroplast genome sequences determined by high-throughput sequencing: Genome structure and phylogenetic relationships. BMC Evol. Biol. 2014, 14, 151. [Google Scholar] [CrossRef] [PubMed] [Green Version]
- Li, W.; Zhang, C.; Guo, X.; Liu, Q.; Wang, K. Complete chloroplast genome of Camellia japonica genome structures, comparative and phylogenetic analysis. PLoS ONE 2019, 14, e0216645. [Google Scholar] [CrossRef] [Green Version]
- Song, Y.; Wang, S.J.; Ding, Y.M.; Xu, J.; Li, M.F.; Zhu, S.F.; Chen, N.Z. Chloroplast genomic resource of Paris for species discrimination. Sci. Rep. 2017, 7, 3427. [Google Scholar] [CrossRef] [Green Version]
- Krawczyk, K.; Nobis, M.; Myszczyński, K.; Klichowska, E.; Sawicki, J. Plastid super-barcodes as a tool for species discrimination in feather grasses (Poaceae: Stipa). Sci. Rep. 2018, 8, 1924. [Google Scholar] [CrossRef] [Green Version]
- Bouchenak-Khelladi, Y.; Salamin, N.; Savolainen, V.; Forest, F.; Hodkinson, T.R. Large multi-gene phylogenetic trees of the grasses (Poaceae): Progress towards complete tribal and generic level sampling. Mol. Phylogen. Evol. 2008, 47, 488–505. [Google Scholar] [CrossRef]
- Soreng, R.J.; Peterson, P.M.; Romaschenko, K.; Davidse, G.; Zuloaga, F.O.; Judziewicz, E.J.; Filgueiras, T.S. A worldwide phylogenetic classification of the Poaceae (Gramineae). J. Syst. Evol. 2015, 53, 117–137. [Google Scholar] [CrossRef]
- Duvall, M.R.; Burke, S.V.; Clark, D.C. Plastome phylogenomics of Poaceae: Alternate topologies depend on alignment gaps. Bot. J. Linn. Soc. 2020, 192, 9–20. [Google Scholar] [CrossRef]
- Vorontsova, M.S.; Haevermans, T.; Haevermans, A.; Razanatsoa, J.; Lundgren, M.R.; Besnard, G. The genus Sartidia (Poaceae: Aristidoideae) in Madagascar. Syst. Bot. 2015, 40, 448–453. [Google Scholar] [CrossRef] [Green Version]
- Lu, S.L. Flora Reipublicae Popularis Sinicae; Chen, S., Ed.; Science Press: Beijing, China, 1990; Volume 10, pp. 111–121. [Google Scholar]
- Wang, Y.; Cerling, T.E.; MacFaddenb, B.J. Fossil horses and carbon isotopes: New evidence for Cenozoic dietary, habitat, and ecosystem changes in North America. Palaeogeogr. Palaeoclimatol. Palaeoecol. 1994, 107, 269–279. [Google Scholar] [CrossRef]
- Fox, D.L.; Koch, P.L. Tertiary history of C4 biomass in the Great Plains, USA. Geology 2003, 31, 809–812. [Google Scholar] [CrossRef] [Green Version]
- Edwards, E.J.; Smith, S.A. Phylogenetic analyses reveal the shady history of C4 grasses. Proc. Natl. Acad. Sci. USA 2010, 107, 2532–2537. [Google Scholar] [CrossRef] [PubMed] [Green Version]
- Spriggs, E.L.; Christin, P.-A.; Edwards, E.J. C4 photosynthesis promoted species diversification during the Miocene grassland expansion. PLoS ONE 2014, 9, e97722. [Google Scholar] [CrossRef]
- Wang, S.M.; Zhang, X.; Li, Y.; Zhang, L.; Xiong, Y.C.; Wang, G. Spatial distribution patterns of the soil seed bank of Stipagrostis pennata (Trin.) de Winter in the Gurbantonggut Desert of north-west China. J. Arid Environ. 2005, 63, 203–222. [Google Scholar] [CrossRef]
- Mable, B.K. Breaking down taxonomic barriers in polyploidy research. Trends Plant Sci. 2003, 8, 582–590. [Google Scholar] [CrossRef]
- Soltis, D.E.; Albert, V.A.; Leebens-Mack, J.; Bell, C.D.; Paterson, A.H.; Zheng, C.; Sankoff, D.; dePamphilis, C.W.; Wall, K.; Soltis, P.S. Polyploidy and angiosperm diversification. Am. J. Bot. 2009, 96, 336–348. [Google Scholar] [CrossRef] [Green Version]
Figure 1.
Maps of the newly sequenced plastome of Aristida adscensionis and Stipagrostis pennata. Different color blocks on the outer ring represent genes with different functions. The genes outside the outer ring were transcribed in a counterclockwise direction, while the genes inside the outer ring were transcribed in a clockwise direction. The gray dotted area in the inner circle represents the GC content of the plastomes.

Figure 2.
Repeat sequence analysis of plastomes in 16 Aristidoideae species. (A) The number of four types of repeats in different species. (B) The number of repeats with different lengths in different species.
Figure 2.
Repeat sequence analysis of plastomes in 16 Aristidoideae species. (A) The number of four types of repeats in different species. (B) The number of repeats with different lengths in different species.

Figure 3.
Comparison of the amino acid composition in the plastomes of 16 Aristidoideae species.

Figure 4.
Comparison of boundaries of LSC, SSC, and IRs among 16 species in Aristidoideae. JLB: LSC/IRb junctions; JSB: SSC/ IRb junctions; JSA: SSC/ IRa junctions; JLA: LSC/IRa junctions. The gene names behind each species represents the lost genes in this species, and the number in parentheses represents the length of the residual gene fragment.

Figure 5.
The homologous comparison of 16 Aristidoideae plastomes by mVISTA, with St. pennata as a reference. The horizontal axis, which represents the percentage of identity, ranges from 50–100%. Different colors indicate different gene regions.
Figure 5.
The homologous comparison of 16 Aristidoideae plastomes by mVISTA, with St. pennata as a reference. The horizontal axis, which represents the percentage of identity, ranges from 50–100%. Different colors indicate different gene regions.

Figure 6.
Comparison of the percentage of parsim-info sites in 16 Aristidoideae plastomes. (A) Protein coding sequences (CDS). (B) The introns and intergenic spacers (IGS).
Figure 6.
Comparison of the percentage of parsim-info sites in 16 Aristidoideae plastomes. (A) Protein coding sequences (CDS). (B) The introns and intergenic spacers (IGS).

Figure 7.
The Maximum Likelihood and Bayesian Inference trees of 16 Aristidoideae species based on their complete plastomes. The obtained bootstrap values (BS) and Bayesian Inference posterior probabilities (PP) are marked above the tree node (BS/PP).
Figure 7.
The Maximum Likelihood and Bayesian Inference trees of 16 Aristidoideae species based on their complete plastomes. The obtained bootstrap values (BS) and Bayesian Inference posterior probabilities (PP) are marked above the tree node (BS/PP).

Figure 8.
Chronogram constructed from treePL divergence estimation analysis. The short blue bar represents 95% confidence interval.
Figure 8.
Chronogram constructed from treePL divergence estimation analysis. The short blue bar represents 95% confidence interval.


Table 1.
The detailed information of the samples used in the present study.
| Species | Accession Number | Species | Accession Number |
|---|---|---|---|
| Amphipogon turbinatus | NC_035521 | Cortaderia selloana | NC_036681 |
| Aristida adscensionis | MZ373986 | Eleusine coracana | MW262987 |
| Aristida behriana | NC_046729 | Eriachne mucronata | NC_035529 |
| Aristida congesta | NC_046731 | Isachne distichophylla | NC_025236 |
| Aristida diffusa | NC_046732 | Merxmuellera tsaratananensis | NC_036122 |
| Aristida glaziovii | NC_046413 | Oryza sativa | NC_031333 |
| Aristida pruinosa | NC_042836 | Sartidia dewinteri | NC_027147 |
| Aristida purpurea | NC_025228 | Sartidia isaloensis | NC_036117 |
| Aristida rufescens | NC_036130 | Sartidia perrieri | NC_027146 |
| Aristida stipitata | NC_046730 | Setaria viridis | NC_028075 |
| Aristida ternipes | NC_037164 | Sorghum bicolor | NC_008602 |
| Arundo plinii | NC_034652 | Stipagrostis hirtigluma | NC_036112 |
| Bambusa bambos | NC_026957 | Stipagrostis pennata | MZ373985 |
| Brachyelytrum aristosum | NC_027470 | Stipagrostis uniplumis | MF460973 |
| Centropodia glauca | NC_029411 | Thysanolaena latifolia | NC_025238 |
| Chloris virgata | NC_032034 | Zea mays | NC_001666 |
Table 2.
Plastome characteristics of 16 Aristidoideae species.
| Species | Genome Size (bp) | LSC (bp) | IR (bp) | SSC (bp) | GC Content (%) | Number of Genes | ||||||
|---|---|---|---|---|---|---|---|---|---|---|---|---|
| All | IR | LSC | SSC | Total | CDS | rRNAs | tRNAs | |||||
| Aristida adscensionis | 137,947 | 80,085 | 22,722 | 12,418 | 38.4 | 43.9 | 36.2 | 32.4 | 134 | 88 | 8 | 38 |
| Aristida behriana | 137,074 | 79,444 | 22,568 | 12,494 | 38.6 | 44 | 36.4 | 32.6 | 134 | 88 | 8 | 38 |
| Aristida congesta | 134,072 | 80,384 | 20,670 | 12,348 | 38.3 | 44.1 | 36.2 | 32.6 | 134 | 88 | 8 | 38 |
| Aristida diffusa | 137,542 | 79,692 | 22,708 | 12,434 | 38.4 | 43.9 | 36.2 | 32.5 | 134 | 88 | 8 | 38 |
| Aristida glaziovii | 132,603 | 80,193 | 19,963 | 12,484 | 38.4 | 44.3 | 36.3 | 32.6 | 134 | 88 | 8 | 38 |
| Aristida pruinosa | 137,353 | 79,421 | 22,722 | 12,488 | 38.5 | 44 | 36.4 | 32.6 | 134 | 88 | 8 | 38 |
| Aristida purpurea | 138,423 | 80,437 | 22,747 | 12,492 | 38.5 | 43.9 | 36.3 | 32.6 | 134 | 88 | 8 | 38 |
| Aristida rufescens | 137,659 | 79,718 | 22,719 | 12,503 | 38.5 | 43.9 | 36.4 | 32.6 | 134 | 88 | 8 | 38 |
| Aristida stipitata | 138,226 | 80,327 | 22,728 | 12,443 | 38.4 | 44 | 36.2 | 32.4 | 134 | 88 | 8 | 38 |
| Aristida ternipes | 136,231 | 80,283 | 21,724 | 12,500 | 38.5 | 44.1 | 36.4 | 32.5 | 134 | 88 | 8 | 38 |
| Sartidia dewinteri | 138,074 | 80,116 | 22,725 | 12,508 | 38.4 | 44 | 36.2 | 32.3 | 132 | 86 | 8 | 38 |
| Sartidia isaloensis | 138,607 | 80,567 | 22,724 | 12,592 | 38.4 | 43.9 | 36.2 | 32.3 | 132 | 86 | 8 | 38 |
| Sartidia perrieri | 138,471 | 80,508 | 22,730 | 12,503 | 38.4 | 44 | 36.2 | 32.3 | 132 | 86 | 8 | 38 |
| Stipagrostis hirtigluma | 138,026 | 80,137 | 22,748 | 12,393 | 38.5 | 43.9 | 36.3 | 32.9 | 132 | 86 | 8 | 38 |
| Stipagrostis pennata | 138,725 | 80,927 | 22,679 | 12,440 | 38.4 | 44 | 36.4 | 32.8 | 132 | 86 | 8 | 38 |
| Stipagrostis uniplumis | 138,019 | 80,031 | 22,797 | 12,394 | 38.5 | 43.9 | 36.4 | 32.8 | 132 | 86 | 8 | 38 |
Table 3.
Correlation analysis between cpSSRs and plastome size and CG content in 16 Aristidoideae species.
Table 3.
Correlation analysis between cpSSRs and plastome size and CG content in 16 Aristidoideae species.
| Term | Plastome Size | GC Content | Total SSRs | P1% | P2% | P3% | P4% | P5% | P6% |
|---|---|---|---|---|---|---|---|---|---|
| Plastome Size | 1 | ||||||||
| GC content | 0.2473 | 1 | |||||||
| Total SSRs | −0.4087 | 0.1868 | 1 | ||||||
| P1% | −0.589 * | −0.0325 | 0.766 ** | 1 | |||||
| P2% | 0.661 ** | −0.1420 | −0.3807 | −0.590 * | 1 | ||||
| P3% | 0.0761 | 0.565 * | −0.0616 | −0.0010 | −0.1244 | 1 | |||
| P4% | 0.3473 | 0.0234 | −0.677 ** | −0.845 ** | 0.2253 | −0.2124 | 1 | ||
| P5% | 0.1996 | −0.1588 | −0.2326 | −0.2800 | 0.2742 | 0.1881 | −0.1428 | 1 | |
| P6% | 0.0992 | −0.1604 | 0.2575 | −0.0327 | 0.3447 | −0.3606 | −0.0262 | −0.16742 | 1 |
Note: * p < 0.05; ** p < 0.01.
Table 4.
The codon usage of 16 Aristidoideae plastomes.
| Species | CC | ENC | GC | T3s | C3s | A3s | G3s |
|---|---|---|---|---|---|---|---|
| Aristida adscensionis | 16,986 | 49.51 | 0.389 | 0.4643 | 0.1712 | 0.4263 | 0.1739 |
| Aristida behriana | 17,016 | 49.75 | 0.39 | 0.4631 | 0.1728 | 0.4237 | 0.177 |
| Aristida congesta | 17,004 | 49.63 | 0.39 | 0.4637 | 0.1719 | 0.425 | 0.175 |
| Aristida diffusa | 17,004 | 49.65 | 0.39 | 0.4638 | 0.1721 | 0.4242 | 0.1758 |
| Aristida glaziovii | 17,005 | 49.79 | 0.391 | 0.4627 | 0.1726 | 0.4235 | 0.1772 |
| Aristida pruinosa | 17,023 | 49.72 | 0.39 | 0.4631 | 0.1722 | 0.4245 | 0.1767 |
| Aristida purpurea | 17,003 | 49.89 | 0.391 | 0.4615 | 0.174 | 0.4233 | 0.1774 |
| Aristida rufescens | 17,066 | 49.82 | 0.391 | 0.4622 | 0.1727 | 0.4234 | 0.1777 |
| Aristida stipitata | 17,011 | 49.66 | 0.39 | 0.4639 | 0.172 | 0.4245 | 0.1758 |
| Aristida ternipes | 17,001 | 49.87 | 0.391 | 0.4617 | 0.1738 | 0.4226 | 0.1779 |
| Sartidia dewinteri | 17,072 | 49.62 | 0.39 | 0.4636 | 0.1723 | 0.4257 | 0.1744 |
| Sartidia isaloensis | 17,034 | 49.55 | 0.39 | 0.4641 | 0.1718 | 0.4257 | 0.1739 |
| Sartidia perrieri | 17,034 | 49.57 | 0.39 | 0.464 | 0.1719 | 0.4251 | 0.1744 |
| Stipagrostis hirtigluma | 17,101 | 49.74 | 0.391 | 0.4616 | 0.1756 | 0.4243 | 0.1744 |
| Stipagrostis pennata | 17,055 | 49.75 | 0.391 | 0.4613 | 0.1753 | 0.4249 | 0.174 |
| Stipagrostis uniplumis | 17,101 | 49.73 | 0.391 | 0.4618 | 0.1755 | 0.4242 | 0.1745 |
Note: CC, Codons count; ENC, Effective number of codons; GC, GC content at coding positions; N3s, the third base of codons.
Publisher’s Note: MDPI stays neutral with regard to jurisdictional claims in published maps and institutional affiliations. |
© 2022 by the authors. Licensee MDPI, Basel, Switzerland. This article is an open access article distributed under the terms and conditions of the Creative Commons Attribution (CC BY) license (https://creativecommons.org/licenses/by/4.0/).
Share and Cite
MDPI and ACS Style
Guo, X.-X.; Qu, X.-J.; Zhang, X.-J.; Fan, S.-J. Comparative and Phylogenetic Analysis of Complete Plastomes among Aristidoideae Species (Poaceae). Biology 2022, 11, 63. https://doi.org/10.3390/biology11010063
AMA Style
Guo X-X, Qu X-J, Zhang X-J, Fan S-J. Comparative and Phylogenetic Analysis of Complete Plastomes among Aristidoideae Species (Poaceae). Biology. 2022; 11(1):63. https://doi.org/10.3390/biology11010063
Chicago/Turabian StyleGuo, Xiu-Xiu, Xiao-Jian Qu, Xue-Jie Zhang, and Shou-Jin Fan. 2022. "Comparative and Phylogenetic Analysis of Complete Plastomes among Aristidoideae Species (Poaceae)" Biology 11, no. 1: 63. https://doi.org/10.3390/biology11010063
Note that from the first issue of 2016, this journal uses article numbers instead of page numbers. See further details here.