Chloroplast Genome Analysis for Genetic Information and Authentication in Five Barleria Species
by
 , , and
Sanit Kaewdaungdee
1, 
Runglawan Sudmoon
2 ,
,
Tawatchai Tanee
3 ,
,
Shiou Yih Lee
4 and
Arunrat Chaveerach
1,* 1
Department of Biology, Faculty of Science, Khon Kaen University, Khon Kaen 40002, Thailand
2
Faculty of Law, Khon Kaen University, Khon Kaen 40002, Thailand
3
Faculty of Environment and Resource Studies, Mahasarakham University, Maha Sarakham 44150, Thailand
4
Faculty of Health and Life Sciences, INTI International University, Nilai 71800, Negeri Sembilan, Malaysia
*
Author to whom correspondence should be addressed.
Genes 2022, 13(10), 1705; https://doi.org/10.3390/genes13101705
Submission received: 13 August 2022
/
Revised: 9 September 2022
/
Accepted: 19 September 2022
/
Published: 22 September 2022
(This article belongs to the Section Plant Genetics and Genomics)
Abstract
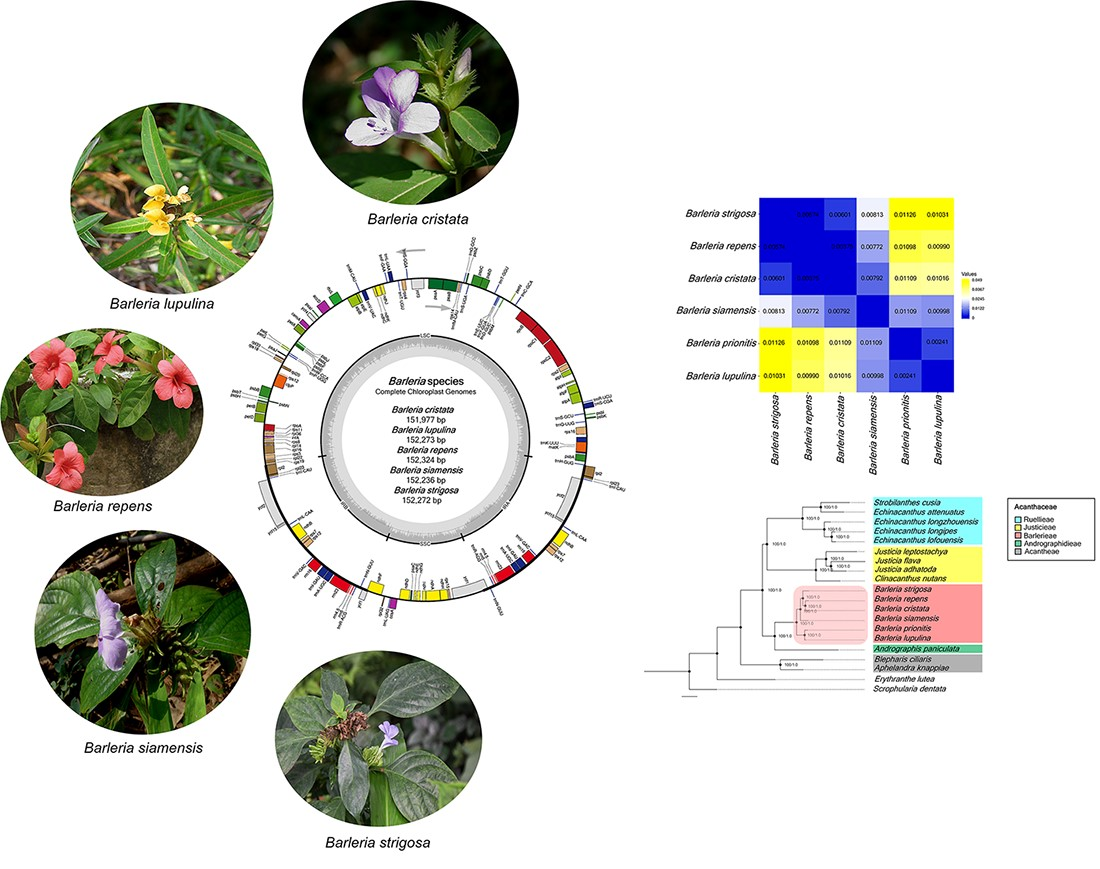
:In order to authenticate the genomic information of Barleria cristata L., B. lupulina Lindl., B. repens Nees, B. siamensis Craib, and B. strigosa Willd, cp genomes were investigated. They revealed a general structure with a total size of 151,997–152,324 bp. The genomes encoded a total of 131 genes, including 86 CDS, 37 tRNA, and 8 rRNA genes. Other details found were as follows: different numbers and types of SSRs; identical gene content, which is adjacent to the border regions, except for B. strigosa, that revealed a shorter ndhF gene sequence and lacked the ycf1 gene; slightly different genetic distance values, which can be used for species identification; three distinct gaps of nucleotide variations between the species located at the intergenic spacer regions of the LSC and CDS of the SSC; three effective molecular markers derived from divergent hotspot regions, including the ccsA-ndhD, ndhA-ndhH-rps15, and ycf1. The genetic relationships derived from the cp genome and the CDS phylogenetic trees of Barleria and the 13 genera in Acanthaceae and different families, Scrophulariaceae and Phrymaceae, showed similar results. The six Barleria species as monophyletic groups with inner and outer outgroups were found to have perfect discrimination. These results have helped to authenticate the five Barleria species and the six genera in Acanthaceae.

1. Introduction
Barleria (Barlerieae) species belong to the Acanthaceae family. They have a large, polymorphic, widespread genus of perennial herbs, shrubs, and rarely climbers, and comprise about 300 species worldwide [1]. They are distributed in Africa and Asia, with the highest diversity in tropical East Africa and southern Africa. Barleria can be easily distinguished from other genera of the Acanthaceae by a combination of three characters, including a four-part calyx with two large outer segments and two smaller inner ones, spheroidal pollen grains, and double crystoliths in the epidermal cells [2]. The Barleria species are crucial plants in folk traditional medicine and have ornamental potential. Numerous bioactive compounds, such as alkaloids, flavonoids, phenolic compounds, iridoid glycosides, quinones, quercetin, terpenoids, steroids, and tannins [1,3], have been reported from various Barleria species, corresponding with medicinal properties such as anti-oxidant, anti-inflammatory, analgesic activity, anti-leukemic, anti-tumor, anti-hyperglycemic, anti-virus, and anti-bacterial activity [4,5,6,7]. The Barleria species can be made into natural products, such as medicines, cosmetics, and nutraceutical supplements. These uses, however, correspond only with certain species. Some species have similar morphological characters, especially leaf morphology and flower color [8], which may lead to species misidentification. Several studies reported using a small sequence as a genetic marker, such as rbcL, rps16, matK, trnL-trnF, trnS-trnG, and ndhF-rpl32-trnL, and a nuclear ribosomal internal transcribed sequence (nrITS) to resolve taxonomic problems within the genus [2,8,9,10,11,12,13]. These short sequences used as genetic markers, called DNA barcodes, have rather limited information due to a limited number of nucleotide sequences; thus, there are still some controversies regarding the identification and lineage categorization of the Barleria species.
With the development of high-throughput sequencing technologies, chloroplast DNA (cpDNA) has been widely employed in plant systematics to overcome the species identification problem [14,15]. The chloroplast genome is usually maternally inherited in plants and consists of a quadripartite circular double-stranded DNA molecule, a large single-copy (LSC) region, a small single-copy (SSC) region, and two copies of inverted repeat (IR) regions [16,17,18]. In the higher plant cells, cpDNAs are double-stranded molecules with a relatively tiny size, ranging from 35 to 217 kilobases [19,20,21]. The cpDNAs represent highly conserved genetic information in terms of genome structure, gene content, and order due to single-parent inheritance, being haploid, and its non-recombinant nature [22,23,24]. Therefore, the chloroplast genome plays an indispensable role in the molecular evolution, phylogeny, and molecular markers of plants [25,26,27,28,29]. Hence, in the current study, we sequenced and characterized five Barleria chloroplast genomes and compared them to B. prionitis and other genera of the Acanthaceae in order to utilize the data for interpreting genetic relationships between species. Furthermore, we wanted to develop potential markers for authenticating Barleria species identification accurately, leading to the safe human application of these plants.
2. Material and Methods
2.1. Plant Materials
The sampling was carried out from January–April 2021. Young, fresh leaves of five Barleria species, including B. cristata, B. lupulina, B. repens, B. strigosa, and B. siamensis, were collected for total genomic DNA extractions. Aside from B. repens, which originated from the Nakhon Ratchasima province, the other four Barleria species were from natural populations and ex-situ sites located in the Chiang Mai province, Thailand. All the collections and experiments were performed in accordance with the relevant local guidelines and regulations, and the voucher specimens were kept at the Department of Biology, Faculty of Science, Khon Kaen University, under the collection number A. Chaveerach 1095–1099. The species identification was carried out by the corresponding author and is based on the taxonomic classification proposed by Shendage and Yadav (2010) [30]. Upon collection, the leaf samples were kept in zip-lock bags filled with silica gel and were transported to respective local laboratories for total genomic DNA extractions.
2.2. DNA Extraction
The leaf samples were subjected to total genomic DNA extraction using the DNeasy Plant Mini Kit (QIAGEN, Hilden, Germany), based on the manufacturer’s protocol. The integrity of the genomic DNA was detected via gel electrophoresis using a 1% agarose gel. The purity and quantity of the DNA were estimated using the Qubit™ 4 Fluorometer (Thermo Fisher Scientific, Waltham, MA, USA).
2.3. Chloroplast DNA Sequencing, Assembly, and Annotation
A 350-bp paired-end library was prepared using the TruSeq DNA Sample Prep Kit (Illumina, San Diego, CA, USA) to obtain 150-bp pair-end reads. Next-generation sequencing (NGS) was conducted on an Illumina NovaSeq platform (Illumina, San Diego, CA, USA). A total of 6 Gb of raw NGS data was obtained and fed into the NOVOPlasty 2.7.2 [31] pipeline for genome assembly. The genome assembly was performed by selecting the rbcL gene of Barleria prionitis (GenBank accession NC_048478) as the seed sequence. A contig was obtained at the end of the assembly process, and a gene annotation was carried out using GeSeq [32]. The annotated genome was manually checked for errors, and the circular chloroplast genome map was illustrated using OGDRAW v.1.3.1 [33]. The annotated genome sequences were deposited into the National Center for Biotechnology Information (NCBI) GenBank database.
2.4. Repeat Analysis
The simple sequence repeats (SSRs) were identified using MISA-web [34]. The parameters for the minimum number of repeats were set at 10, 4, 4, 3, 3, and 3 for mono-, di-, tri-, tetra-, penta-, and hexanucleotides, respectively. For the identification of large repeats, the REPuter program was used to identify forward, palindromic, reverse, and complement repeats [35]. The minimum repeat size was set at 30 bp, and the Hamming distance was set to 3. For tandem repeats, the number of tandem repeats was analyzed using the tandem repeat finder v.4.09 with advanced options including 2, 2, 7 for the alignment parameters, 80 for the minimum alignment score, and 500 for the maximum period size, respectively [36].
2.5. IR Border Region and Chloroplast Genome Comparison
2.6. Genetic Distance and Sequence Divergence Snalysis
A multiple sequence alignment was carried out on the six chloroplast genome sequences of Barleria using MAFFT v.7 [40,41]. A genetic distance was performed using the MEGA-X with the Kimura 2-parameter model. The rate of variation among the sites was modeled with a γ distribution. All positions containing gaps and missing data were eliminated using the complete deletion option [42,43]. To determine the nucleotide diversity (Pi) in three different regions of the chloroplast genome, including the LSC, SSC, and IR regions, an analysis was performed using DnaSP v.5.10.01 [44]. The window length was set at 1000 bp, and the step size was set at 500 bp. The chloroplast genome sequence of B. prionitis was selected as the reference genome.
2.7. Phylogenetic Tree Analysis
Phylogenetic trees were reconstructed using two different sequence datasets, including the complete chloroplast genome sequences, a concatenated dataset of the protein-coding sequences (CDSs), and four regions of nucleotide diversity. A total of 18 species from Acanthaceae were included in the analysis as follows: six from the Barlerieae tribe, five from Ruellieae (Echinacanthus attenuates (NC_039762), E. lofouensis (NC_035876), E. longipes (NC_039761), E. longzhouensis (NC_039678), and Strobilanthes cusia (NC_037485); four from Justicieae (Clinacanthus nutans (NC_042162), Justicia adhatoda (NC_047476), J. flava (NC_044862), and J. leptostachya (NC_044668); two from Acantheae (Aphelandra knappiae (NC_041424) and Blepharis ciliaris (NC_046601); one from Andrographidieae (Andrographis paniculate (NC_022451)). Two species, Scrophularia dendata (NC_036942) and Erythranthe lutea (NC_030212), were included as the outgroups. For the CDS dataset, the CDS sequences for each species were extracted using FeatureExtract-1.2 [45]. All sequence datasets were aligned using MAFFT v.7 [41].
The phylogenetic analyses were performed using both the maximum likelihood (ML) and the Bayesian inference (BI) methods. The substitution models with the best fit were estimated using jModelTest 2.1.10 [46,47] based on the Akaike Information Criterion (AIC) [48]. A maximum likelihood analysis was constructed on IQ-Tree v.1.4.2 under the generalized-time-reversible (GTR) model with gramma (+G) and 1000 ultrafast bootstrap replicates [49,50]. A Bayesian inference analysis was performed using MrBayes on XSEDE v.3.2.7a by the Cyberinfrastructure for Phylogenetic Research (CIPRES) Science Gateway v.3.3 [51,52]. A Markov Chain Monte Mont (MCMC) simulations were run for 2 million generations, and sampling trees were run every 100 generations [53]. The resulting trees were visualized and edited using FigTree v.1.4.4 [54].
3. Results
3.1. Barleria Chloroplast Genome Organization and Features
All of the five chloroplast genomes revealed a general cp structure that is quadripartite, containing a large single-copy (LSC) region, a small single-copy (SSC) region, and a pair of inverted repeats (IRs) (Figure 1). The genome size of the five Barleria species ranged from 151,997 bp (B. cristata) to 152,324 bp (B. repens). For each species, the LSC regions ranged from 83,650 bp (B. cristata) to 83,929 bp (B. siamensis) and the SSC regions ranged from 17,677 bp (B. cristata) to 17,804 bp (B. siamensis), while the IR regions ranged from 25,296 bp (B. siamensis) to 25,367 bp (B. repens). The chloroplast genomes of the five Barleria species were predicted to encode a total of 131 genes, including 86 protein-coding (CDS), 37 tRNA, and 8 rRNA genes. Among them, 18 genes were duplicated in the IR regions, including seven CDS, seven tRNA, and four rRNA (Figure 1 and Table 1). A total of 18 genes that contain introns (s) were detected. The clpP and ycf3 genes contained two introns, while the other 16 genes, including atpF, ndhA, ndhB, petB, petD, rrn23, rpl2, rpl16, rpoC1, rps16, trnA-UGC, trnI-GAU, trnK-UUU, trnL-UAA, trnS-CGA, and trnV-UAC, contained one intron (Table 2 and Table 3). The overall GC content was 43.5 % in all of the species, while the GC content of each region was 36.4–36.5%, 32.4–32.7%, and 38.3–38.4% for the LSC, SSC, and IR, respectively (Table 1).
3.2. Repeated Sequence Analysis
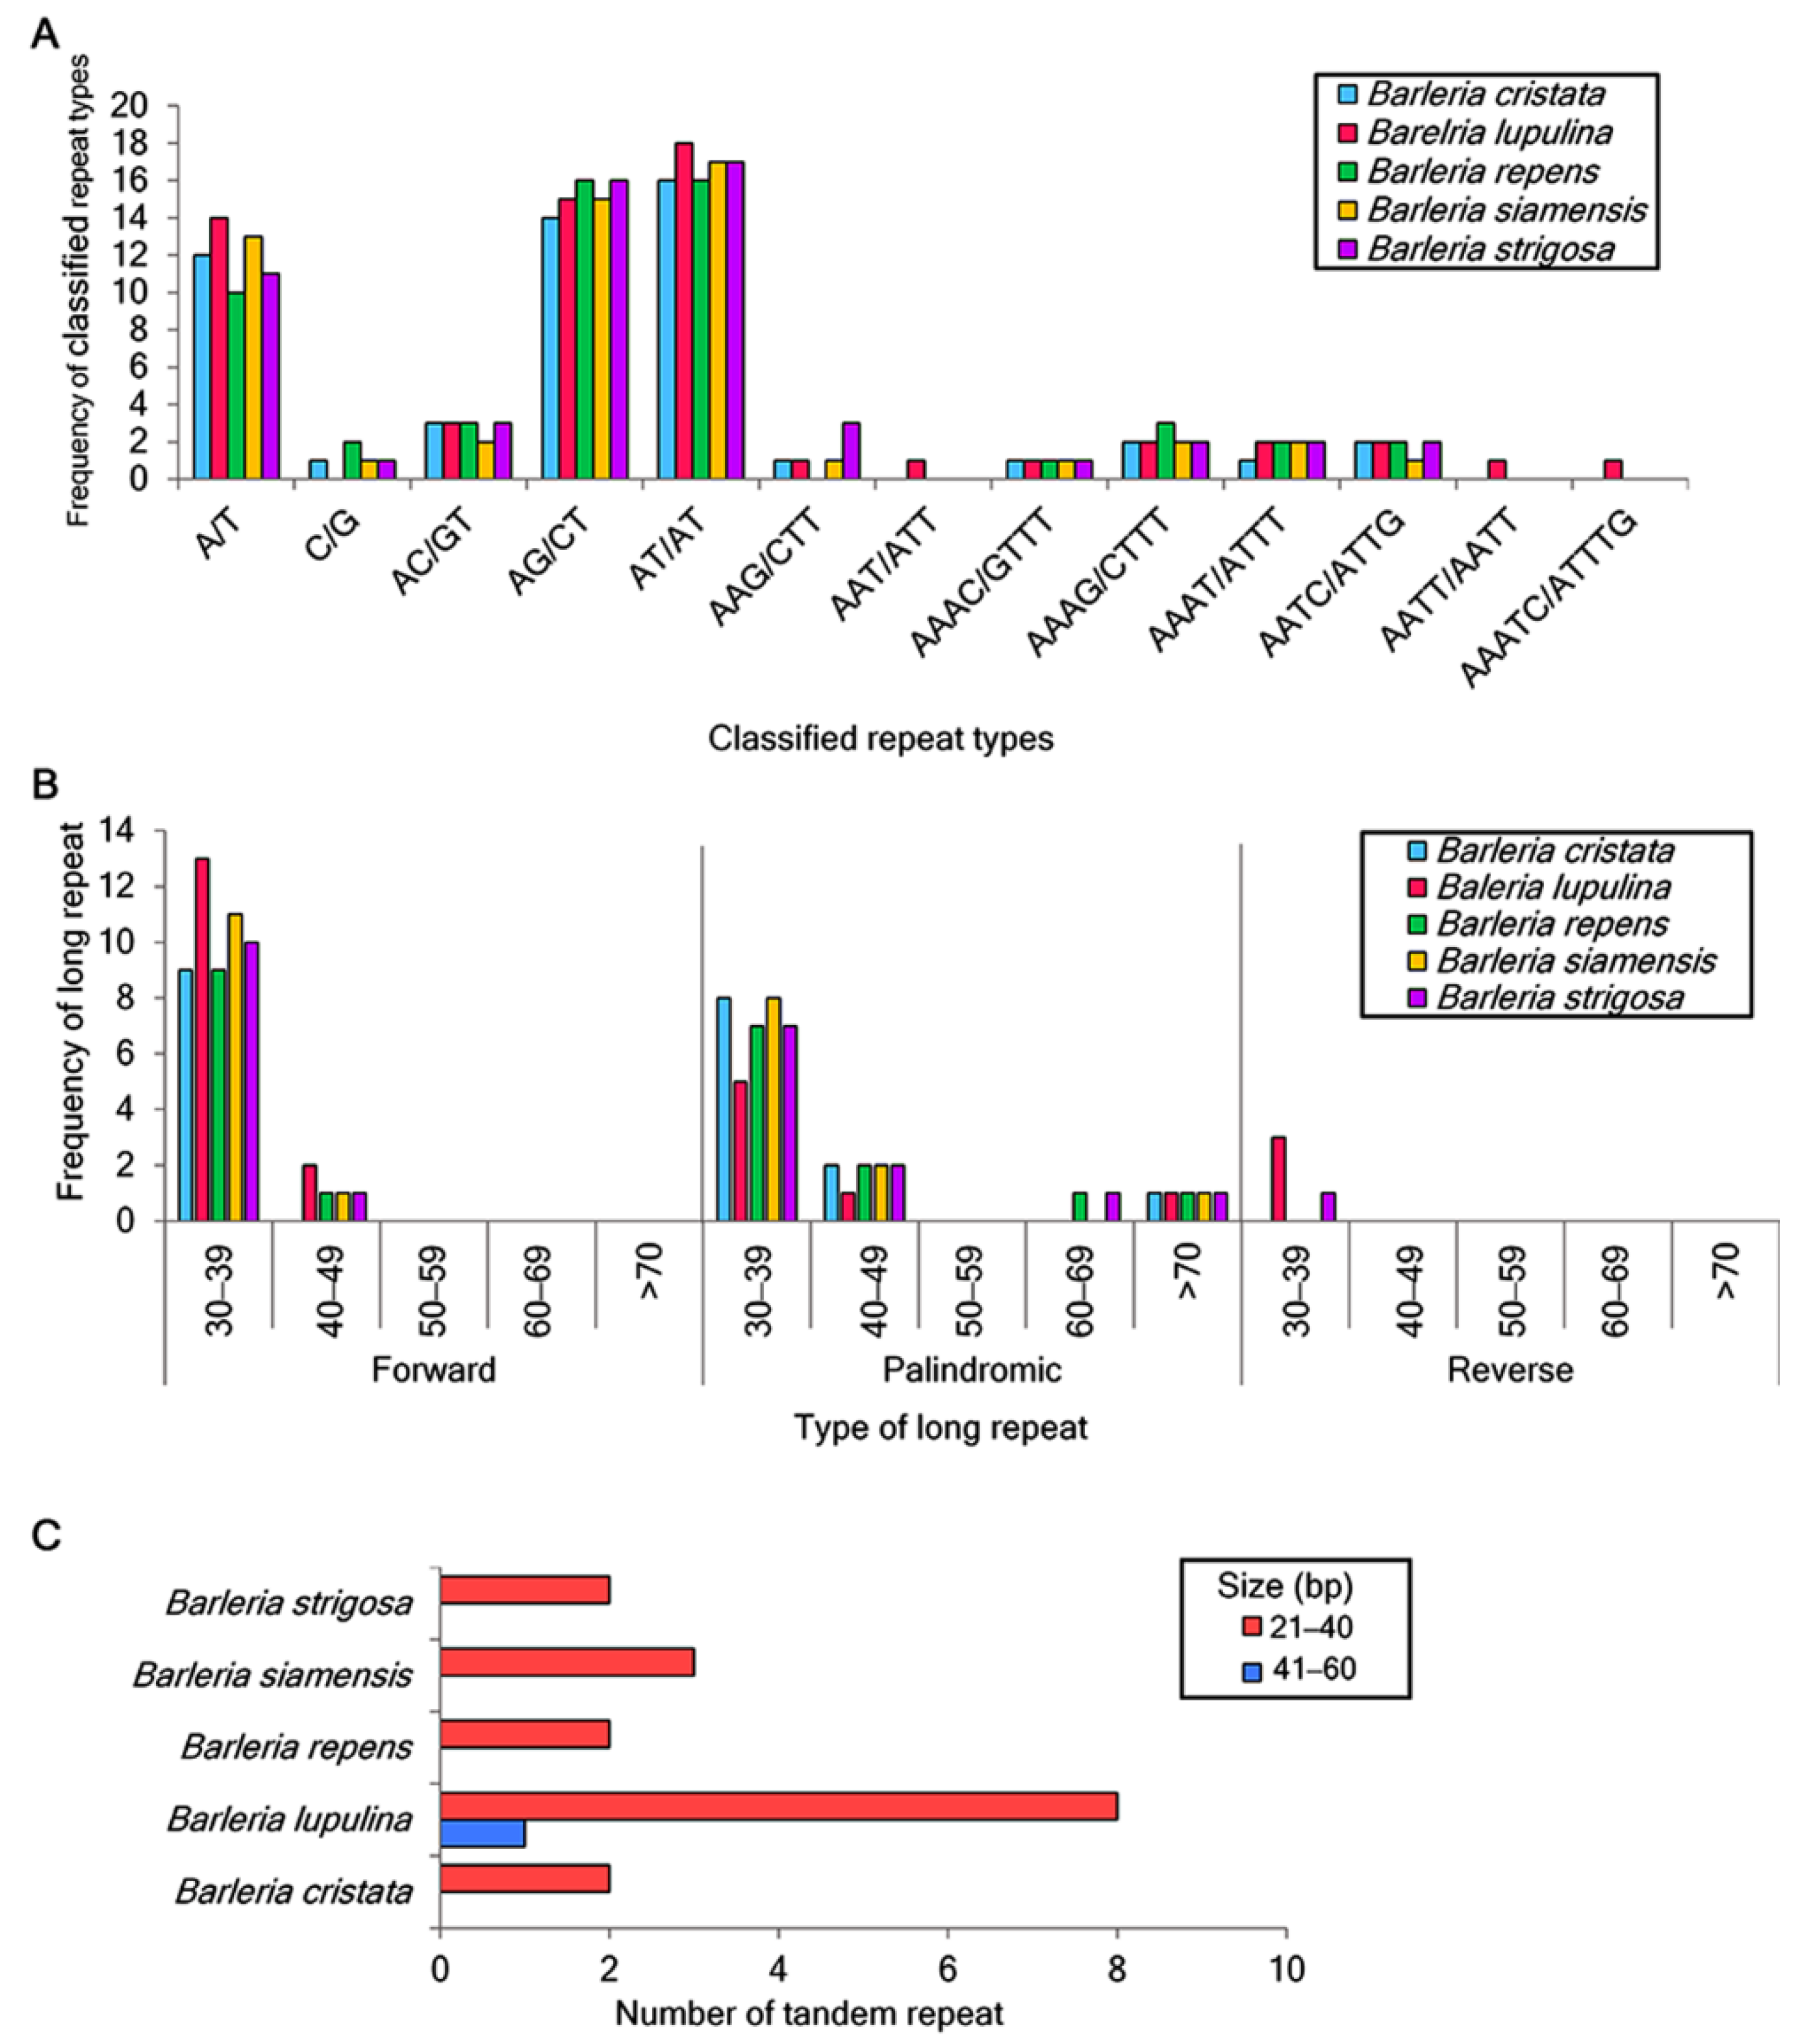
A total of 53, 61, 55, 56, and 58 of the SSRs were identified in the chloroplast genome sequences of B. cristata, B. lupulina, B. repens, B. siamensis, and B. strigosa, respectively. For the mononucleotide repeats, the A/T repeats were found to be more abundant than the C/G repeats. For the dinucleotide repeats, the nucleotide combination of AT/AT was the most abundant, of which 18 were identified in B. lupulina and B. repens, 17 were identified in B. siamensis and B. strigosa, and 16 were identified in B. cristata. This was followed by the nucleotide combination of AG/CT, of which 16 were identified in B. repens and B. strigosa, 15 were identified in B. lupulina and B. siamensis, and 14 were identified in B. cristata. Trinucleotide repeats were detected in all species except for B. repens. Tetranucleotide repeats were identified in all of the study species, and the repeat AATT/AATT was found only in B. lupulina. Pentanucleotide repeats were only detected in B. lupulina (Figure 2A).
A total of 135 long repeats were also analyzed in the five Barleria chloroplast genomes. Most of the long repeats were in a sequence size between 30 and 39 bp, and the reverse long repeats were only detected in B. lupulina and B. strigosa (Figure 2B). For the tandem repeats, fifteen repeats were detected, including two, nine, two, three, and two in B. cristata, B. lupulina, B. repens, B. siamensis, and B. strigosa, respectively. The majority of these repeats were between 21 and 40 bp in length. As for the tandem repeat with a length of 41–60 bp, it was only found in B. lupulina (Figure 2C).
3.3. Comparison of Border Regions in Barleria Chloroplast Genomes
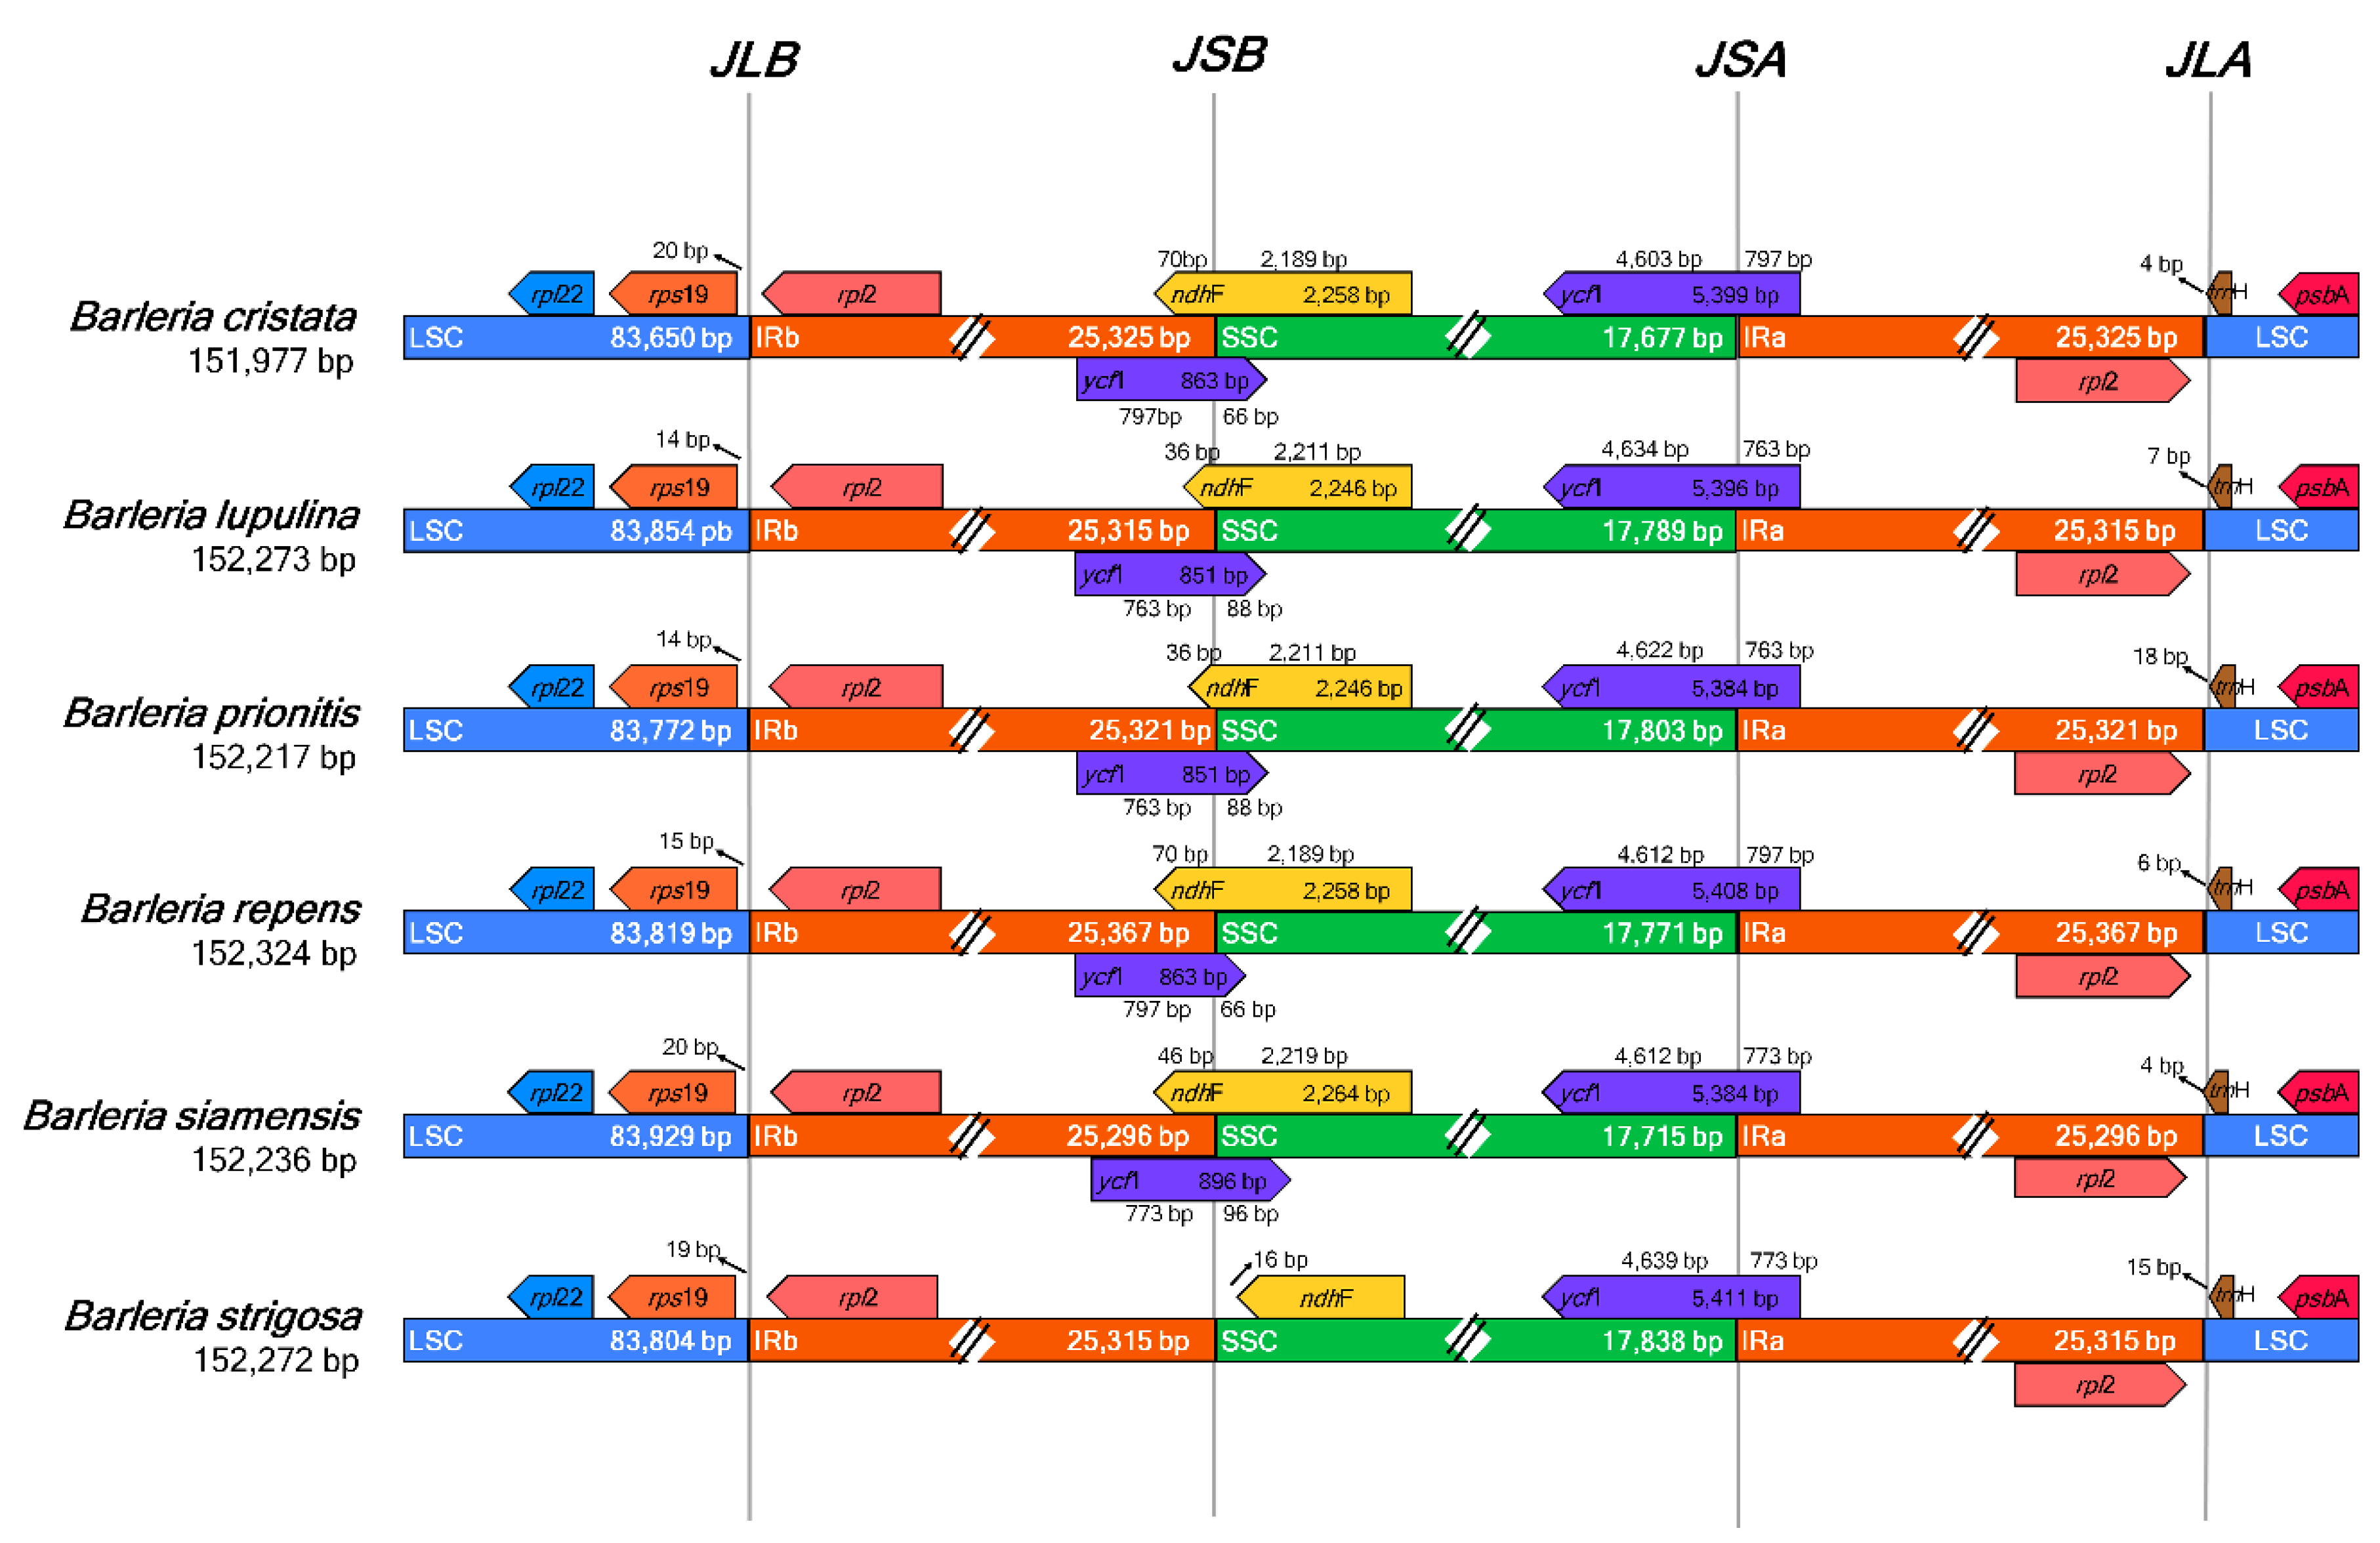
The six species of Barleria revealed identical gene content adjacent to the region borders (Figure 3). The genes trnH and rpl2 were adjacent to the junction between the LSC and IRA (JLA), placed in the LSC and IRA regions, respectively. At the junction between the LSC and IRB regions (JLB), the genes rps19 and rpl2 were placed adjacent to the junction, in the LSC and IRB regions, respectively. The ycf1 gene was detected crossing the junctions between the SSC and IRA (JSA) for all Barleria species; however, the genes ycf1 and ndhF were both detected crossing the junction between the SSC and IRB (JSB) for all species except for B. strigosa, which revealed the point differences as a shorter ndhF gene sequence and a lack of the ycf1 gene.
3.4. Genetic Distance Analysis
For the genetic distance analysis, the Barleria sequences indicated slightly different genetic distance values to separate the interspecific species, ranging from the lowest value of 0.00241 (between B. lupulina and B. prionitis) to the highest value of 0.01125 (between B. prionitis and B. strigosa) (Table 4). Even though there are not many genetic differences, the values can be used for species identification.
3.5. Interspecific Genome Variations and Nucleotide Diversities
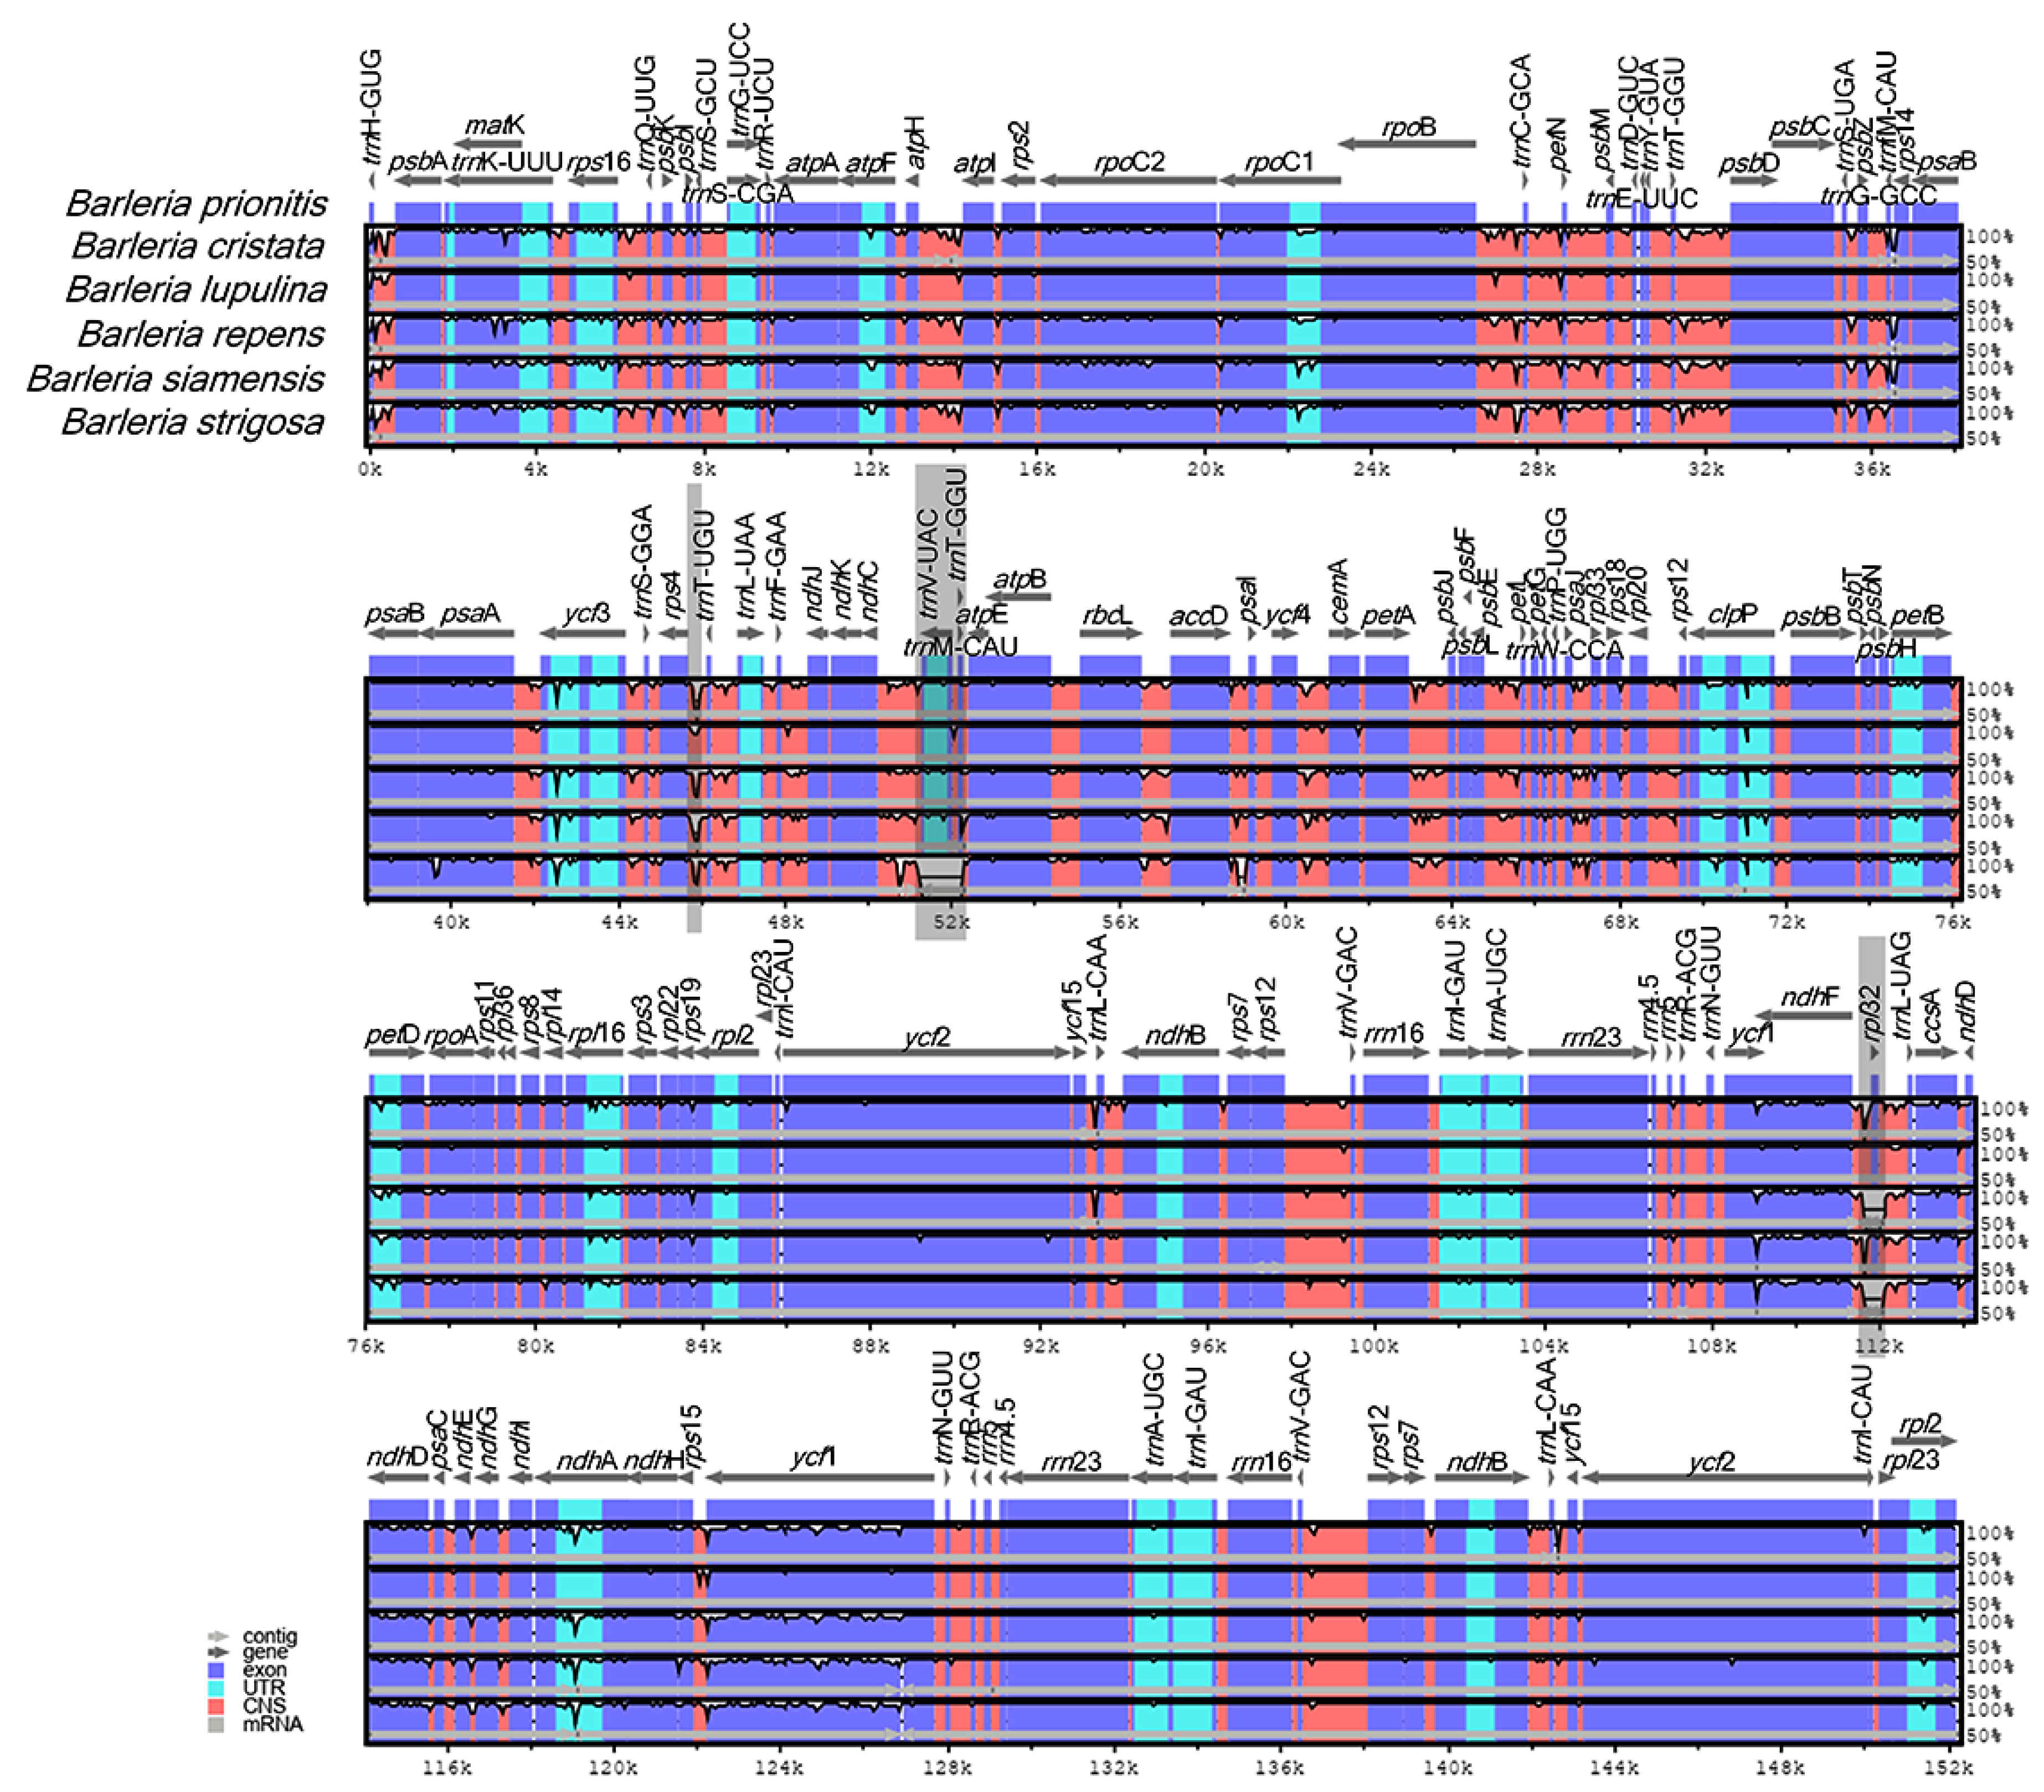
A genome alignment of the six Barleria species revealed at least three distinct gaps that represent nucleotide variations among the species (Figure 4, gray area). The variations were in the form of insertion–deletion (InDels). Two of them are located in the intergenic spacer regions (IGSs) rps4-trnT-UGU and trnV-UAC-trnT-GGU, both from the LSC region, in which the latter is specifically present in B. strigosa. The third variation was located at the CDS rpl32 of the SSC region, specifically present in B. repens and B. strigosa.
3.6. Recognition of Highly Variable Regions within the Barleria Chloroplast Genomes
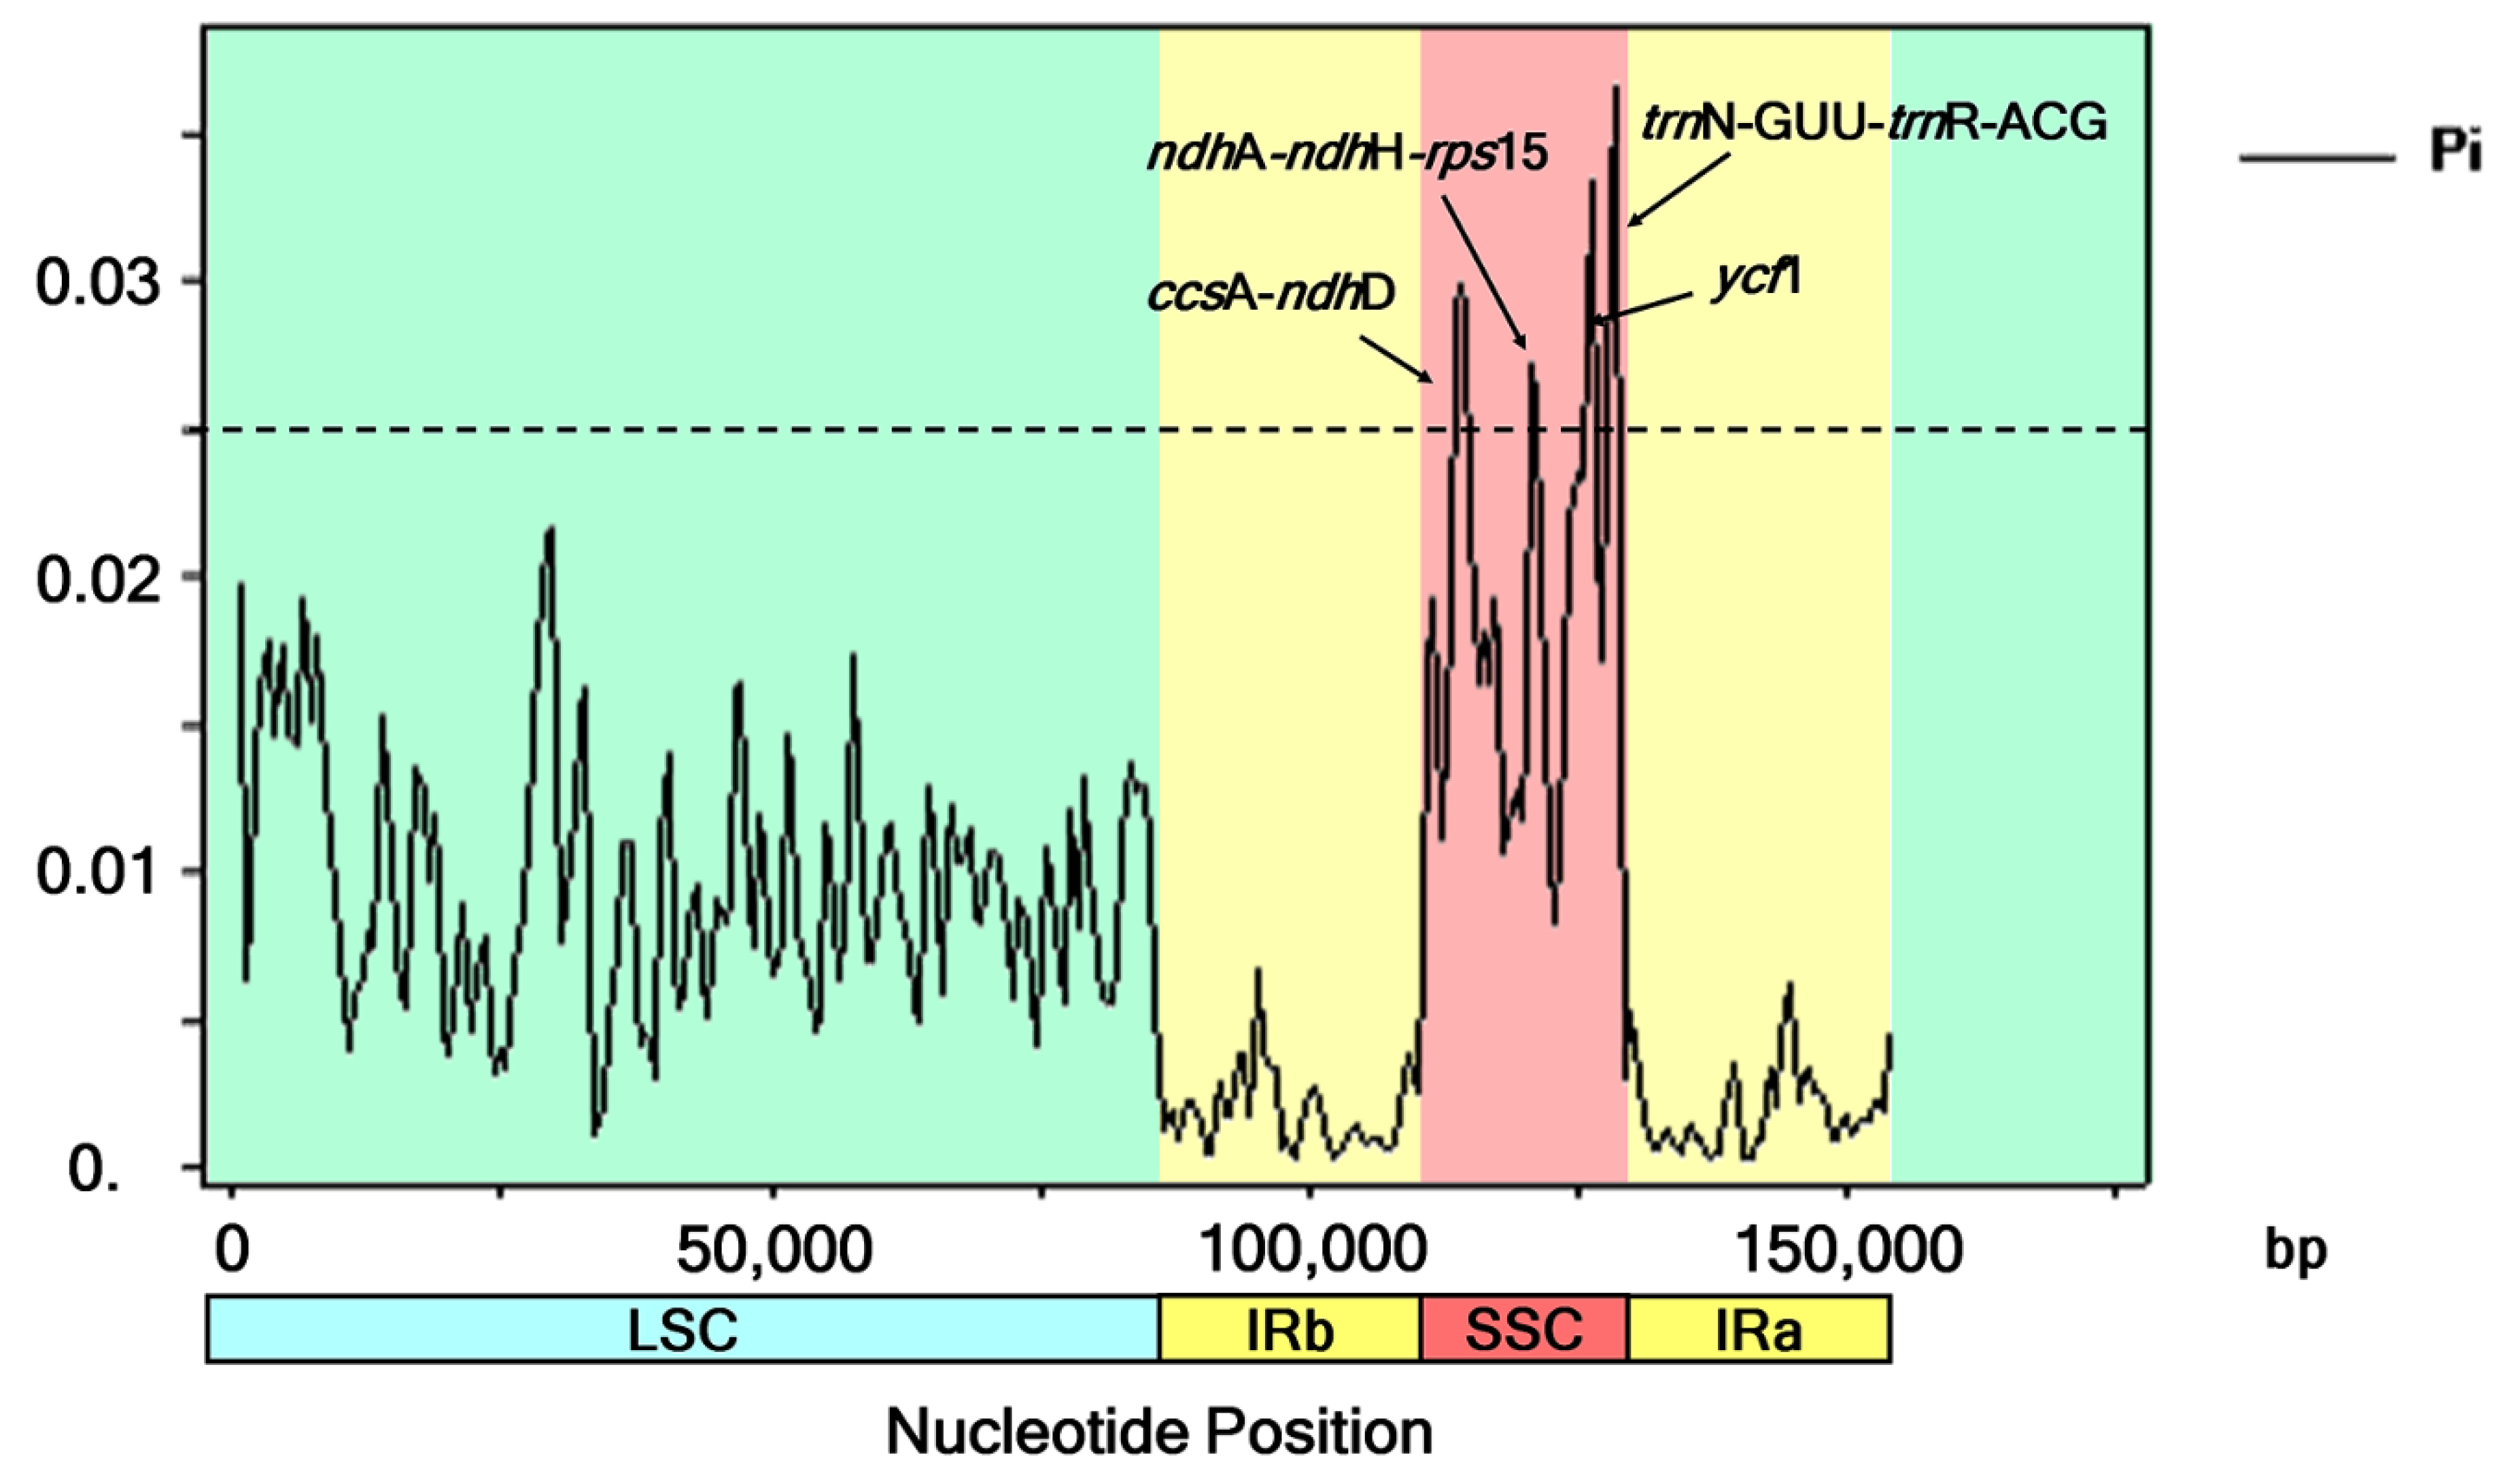
The six Barleria aligned sequences with a total of 154,153 nucleotide sites revealed 2920, 1869, 806, and 121 variable (polymorphic) sites in the complete chloroplast genomes, LSC, SSC, and IR sequences, respectively. Four divergent hotspot regions were identified in all six Barleria cp genomes, including three intergenic spacer regions (ccsA-ndhD, ndhA-ndhH-rps15, and trnN-GUU-trnR-ACG) and a protein-coding region (ycf1). Their nucleotide diversity values (Pi) ranged from 0.0267 to 0.0365. The region of trnN-GUU-trnR-ACG (1034 bp in length) showed the highest variability with a Pi value of 0.0365. The next two subsequent regions were ycf1 (1026 bp, Pi = 0.0334) and ccsA-ndhD (2150 bp, Pi = 0.0249). The diversity level of ndhA-ndhH-rps15 was the lowest, with 1536 bp and a Pi value of 0.0267. All of the mentioned divergent hotspot regions were detected in the SSC regions (Figure 5).
3.7. Phylogenetic Relationship Analysis
A phylogenetic tree, constructed based on the complete chloroplast genomes and CDS sequences, revealed that all six species of Barleria were clustered under a single clade with the outer outgroup of Scrophularia and Erythranthe discriminating perfectly (Figure 6A,B). The phylogenetic relationship of Barleria was well-resolved. Additionally, the inner outgroups of different genera, including Strobilanthes, Echinacanthus, Justicia, Andrographis, Blepharis, and Aphelandra, were a separate complete group with a strong bootstrap support value and posterior probabilities (PPs). At the tribe level, Barlerieae are closely related to Andrographidieae (Figure 6A). Similarly, the CDS sequence of the Barleria species formed a monophyletic clade with the identical topology as the chloroplast genome dataset (Figure 6B). Identically, the BI trees performed a consensus on the ML trees with strong supporting values of posterior probabilities.
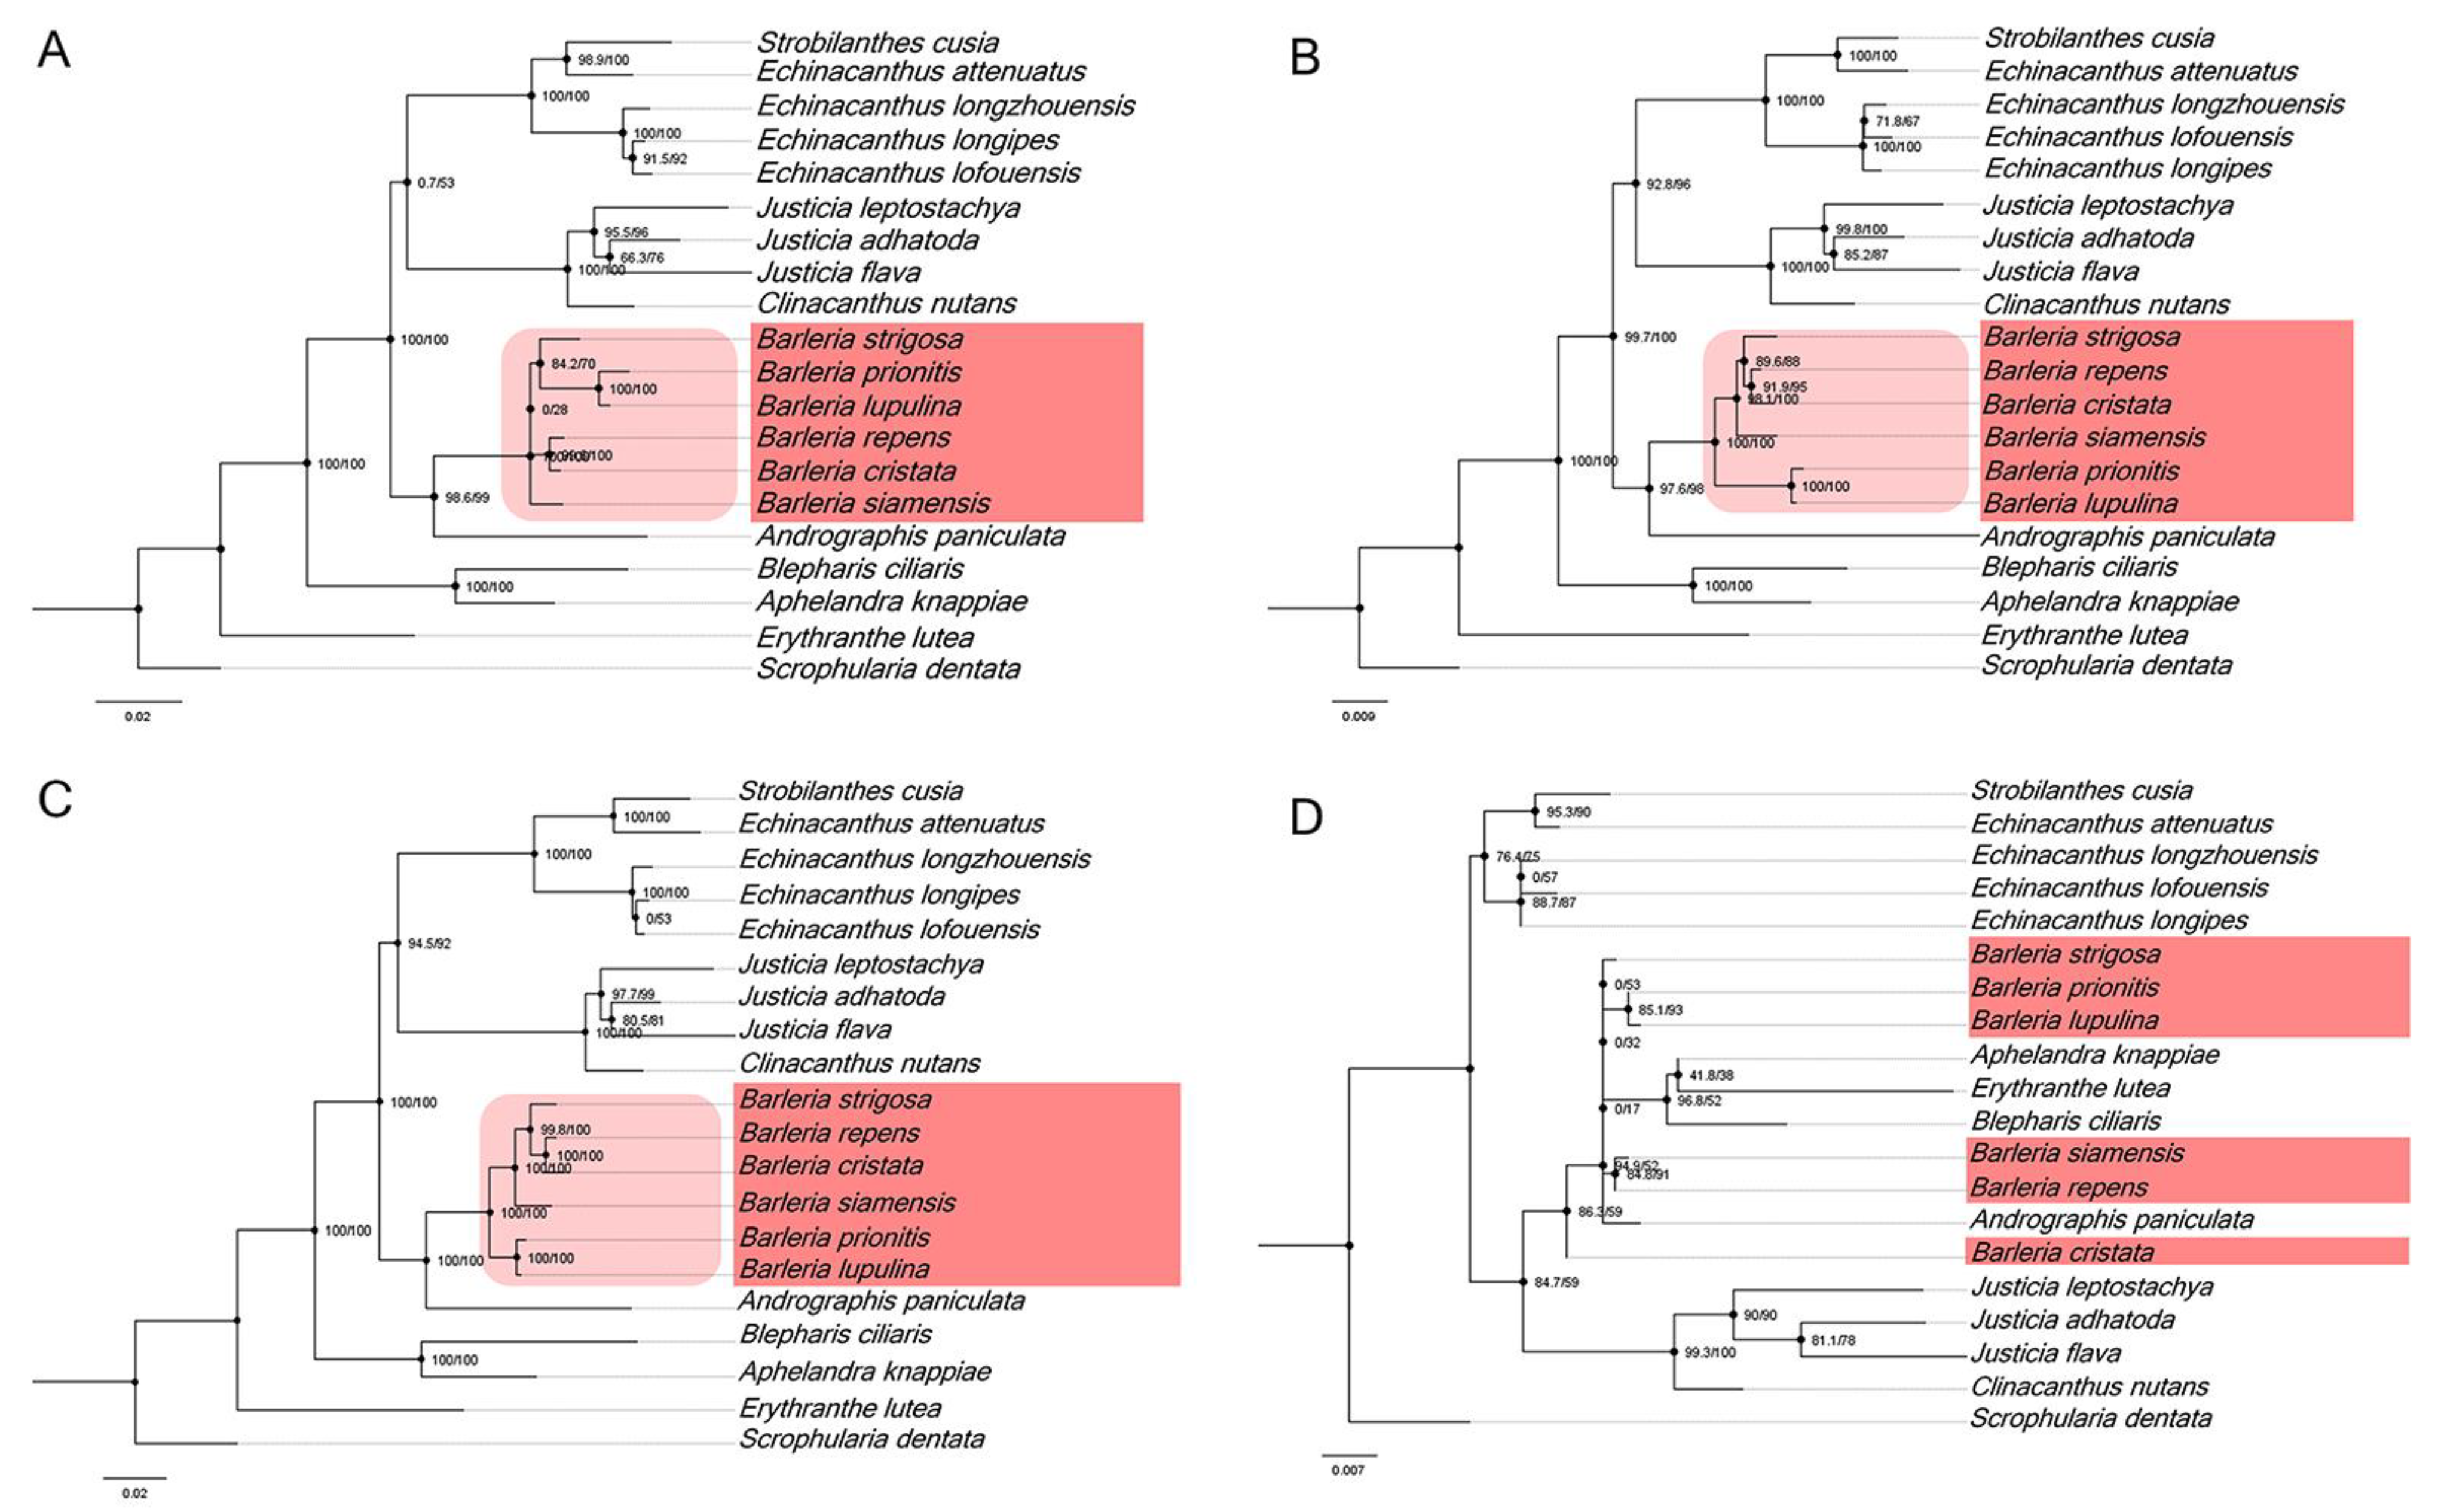
In addition, the four divergent hotspot regions (Figure 5) that were identified in the Barleria cp genome have been used for a phylogenetic analysis. The results revealed that three of the four regions, including ccsA-ndhD, ndhA-ndhH-rps15, and ycf1, can be utilized for identification and are clustered as a monophyletic group in the five Barleria species with a strong bootstrap support value (Figure 7A–C). Meanwhile, trnN-GUU-trnR-ACG cannot be used for species identification (Figure 7D). Therefore, the three mentioned divergent hotspot regions could be applied as a molecular marker for the Barleria species.
4. Discussion
The analysis of the five Barleria cp genomes compared to B. prionitis was performed and was found to be 152,217 bp in length [23]. The identification of various Barleria species should be performed in order to use the correct species for the right purpose, corresponding to the bioactive compounds contained and their properties in natural product creation for humans, such as medicine, cosmetics, and nutraceutical supplements [1,3,4,5,6,7]. Several species of Barleria are known for their medicinal or ornamental values [6,43,55]. There have been studies reviewing the traditional, phytochemical, and pharmacological properties of certain species of Barleria, such as B. lupulina and B. prionitis [56,57,58]. Ghosh et al., 2012 [59] have studied the vegetative and floral characters of B. cristata, B. lupulina, B. prionitis, and B. strigosa. They reported that there is much variation in both characters, including that the leaves are more variable in B. prionitis, while B. strigosa and B. cristata have very variable features in their floral organs, and B. cristata has various color of flowers. However, species identification should not be too difficult, and it is performed by simply using a short nucleotide sequence of genes, three plastid intergenic spacers (trnS-G, ndhF-rpl32-trnL (UAG)), and the nuclear region nrITS.
The sequences can create a monophyletic Barleria and provide support for the two currently recognized subgenera [2]. However, by systematics, getting large amounts of data, such as full plastid sequences, would be more accurate than extracting each of these mentioned short areas, which has the potential for errors. For example, Poeaim et al., 2013 [8] investigated five species and 16 samples of Thai Barleria, two Rhinacanthus nasutus, and Andrographis pani-culata species for the outgroup using the trnL-trnF sequences. The two sequences divided each species of Barleria, but it was noted that A. paniculata was inserted in the in-group of the Barleria species. Presently, no one has comprehensively reported on the species within Barleria using the existing literature in a clear and concise manner [7]. Therefore, the cp genome variations of each studied Barleria species have been used as an accurate marker for species authentication.
The first difference between the five studied species is the bp length, including 151,977, 152,273, 152,324, 152,236, and 152,272 bp in B. cristata, B. lupulina, B. repens, B. siamenesis, and B. strigosa, respectively. Subsequent articles which need to be mentioned for their different points are the following: 53, 61, 55, 56, and 58 SSR contigs of B. cristata, B. lupulina, B. repens, B. siamensis, and B. strigosa in addition to various repeat types starting from mono-long repeats; identical gene content adjacent to the region borders except for B. strigosa, which revealed a shorter ndhF gene sequence and a lack of the ycf1 gene; slightly different genetic distance values of 0.00241–0.01125, which could be used for species identification; three distinct gaps of nucleotide variations among the species in the form of insertion–deletion located at the intergenic spacer regions of the LSC and CDS of the SSC; 2920, 1869, 806, and 121 variable sites in the LSC, SSC, and IR sequences; four divergent hotspot regions found in all Barleria species in the SSC region; nucleotide diversity values ranged from 0.0267 to 0.0365. Of these four regions, the three regions including ccsA-ndhD, ndhA-ndhH-rps15, and ycf1 can be employed for identification and authentication as a marker of the five studied Barleria species. Finally, the genetic relationships of the Barleria and the 13 genera, as shown in the family Acanthaceae, called the inner outgroup, and the different families Scrophularia (Scrophulariaceae) and Erythranthe (Phrymaceae) showed results in agreement derived from phylogenetic trees constructed from the cp genome and CDS sequences. The six species of Barleria under a single clade as a monophyletic group with a different inner group as genus and two species as an outer outgroup were perfectly discriminated. These results are useful for the identification and authentication of the studied Barleria species. Additionally, genomic knowledge confirms the potential of morphological characters.
5. Conclusions
Due to the advanced technology of genomic sequencing, the genetic data revealed a high output in terms of completeness and accuracy of the dataset for genetic relationships in a systematic study. For this research, the complete chloroplast genome sequences have been employed for a genetic study of five Barleria species. Although the cp genome of these species expressed similar features and organization, it contained slightly different characters in size (151,997–152,324 bp) and other features, including the following: pentanucleotide repeats detected in B. lupulina only; reverse long repeats identified in B. lupulina and B.strigosa; a shorter ndhF gene and a lack of the ycf1 gene at the JSB border of B. strigosa, as well as an insertion–deletion variation; three divergent hot spots regions used for the identification and molecular markers in the five Barleria species. The genetic datasets of the complete cp sequence and CDS can be generated for the Barleria species, clustering as a monophyletic group in the Barlerieae tribe, which is in line with the hypothesis.
Author Contributions
A.C. and R.S. designed the project; S.K. performed the experiments and the data analysis; S.Y.L. provided guidance on using the program for the data analysis; A.C. and S.K. verified and discussed the data and wrote the manuscript; A.C., S.K., R.S., T.T. and S.Y.L. revised the manuscript. All authors have read and agreed to the published version of the manuscript.
Funding
By a research professional development project under the Science Achievement Scholarship of Thailand (SAST) and the Research and Graduate Studies, Khon Kaen University.
Institutional Review Board Statement
Not applicable.
Informed Consent Statement
Not applicable.
Data Availability Statement
The complete chloroplast genome sequences of the five Barleria species were submitted at NCBI (GenBank accession number: ON768801–ON768805).
Acknowledgments
The authors thank to financial sources including the Science Achievement Scholarship of Thailand (SAST) and the Research and Graduate Studies, Khon Kaen University.
Conflicts of Interest
The authors declare that they have no conflict of interest.
Abbreviations
| cp | chloroplast genomes |
| LSC | a large single copy |
| SSC | a small single copy |
| IRs | a pair of inverted repeats |
| CDS | protein-coding sequence |
| SSR | simple sequence repeat |
References
- Lekhak, M.M.; Patil, S.S.; Deshmukh, P.V.; Lekhak, U.M.; Kumar, V.; Rastogi, A. Genus Barleria L. (Acanthaceae): A review of its taxonomy, cytogenetics, phytochemistry and pharmacological potential. J. Pharm. Pharmacol. 2022, 74, 812–842. [Google Scholar] [CrossRef] [PubMed]
- Darbyshire, I.; Fisher, A.E.; Kiel, C.A. Phylogenetic relationships among species of Barleria (Acanthaceae, Lamiales): Molecular data reveal complex patterns of morphological evolution and support a revised classification. TAXON 2019, 68, 92–111. [Google Scholar] [CrossRef]
- Khan, I.; Jan, S.A.; Shinwari, Z.K.; Ali, M.; Khan, Y.; Kumar, T. Ethnobotany and medicinal uses of folklore medicinal plants belonging to family Acanthaceae: An updated review. MOJ Biol. Med. 2017, 1, 34–38. [Google Scholar] [CrossRef]
- Amoo, S.O.; Finnie, J.F.; Staden, J.V. In vitro pharmacological evaluation of three Barleria species. J. Ethnopharmacol. 2009, 121, 274–277. [Google Scholar] [CrossRef] [PubMed]
- Amit, K.; Shiwani, S.; Rajesh, K.; Rajinder, K.; Singh, L.K.; Shilpa, K. Pharmacognostical, preliminary phytochemical screening and antimicrobial studies of leaves of Barleria prionitis Linn. Int. J. Pharmacogn. Phytochem. Res. 2014, 6, 369–378. [Google Scholar]
- Tamboli, F.A.; More, H.N. Evaluation of antiulcer and antioxidant activity of Barleria gibsoni Dalz. leaves. Pharmacogn. Res. 2016, 8, 226–230. [Google Scholar] [CrossRef]
- Gangaram, S.; Naidoo, Y.; Dewir, Y.H. Phytochemicals and Biological Activities of Barleria (Acanthaceae). Plants 2022, 11, 82. [Google Scholar] [CrossRef]
- Poeaim, S.; Siripong, W.; Rittidechakul, C.; Apiratmontree, D.; Somprasong, W. Phylogenetic relationships in the genus Barleria inferred from the trnL-trnF sequences region. Thai J. Genet. 2013, 1, 222–225. [Google Scholar]
- Van der Bank, F.H.; van der Bank, M.; Balkwill, M.J.; Balkwill, K. Electrophoretic evidence for an undescribed species of Barleria L. S. Afr. J. Bot. 2000, 66, 22–27. [Google Scholar] [CrossRef]
- Makholela, T.; van der Bank, H.; Balkwil, K. A preliminary study of allozyme variation in three rare and restricted endemic Barleria greenii (Acanthaceae) populations. Biochem. Syst. Ecol. 2003, 31, 141–154. [Google Scholar] [CrossRef]
- Martín-Bravo, S.; Daniel, T.F. Molecular evidence supports ancient long-distance dispersal for the amphi-Atlantic disjunction in the giant yellow shrimp plant (Barleria oenotheroides). Am. J. Bot. 2016, 103, 1103–1116. [Google Scholar] [CrossRef]
- Karthikeyan, B.; Karthikeyan, V. Analysis of phylogeny and evolutionary divergence of rbcL sequence of Barleria longiflora Lf. Int. J. Sci. Res. 2016, 5, 544–548. [Google Scholar]
- Yaradua, S.S.; Alzahrani, D.A.; Albokhary, E.J.; Abba, A.; Bello, A. Complete Chloroplast Genome Sequence of Justicia flava: Genome Comparative Analysis and Phylogenetic Relationships among Acanthaceae. Biomed Res. Int. 2019, 2019, 4370258. [Google Scholar] [CrossRef] [PubMed] [Green Version]
- Zhang, X.; Zhou, T.; Kanwal, N.; Zhao, Y.M.; Bai, G.Q.; Zhao, G.F. Completion of eight Gynostemma BL. (Cucurbitaceae) chloroplast genomes: Characterization, comparative analysis, and phylogenetic relationships. Front. Plant Sci. 2017, 8, 1583. [Google Scholar] [CrossRef] [PubMed]
- Gao, C.; Deng, Y.; Wang, J. The Complete Chloroplast Genomes of Echinacanthus Species (Acanthaceae: Phylogenetic Relationships, Adaptive Evolution, and Screening of Molecular Markers. Front. Plant Sci. 2019, 9, 1989. [Google Scholar] [CrossRef]
- Feng, S.; Zheng, K.; Jiao, K.; Cai, Y.; Chen, C.; Mao, Y.; Wang, L.; Zhan, X.; Ying, Q.; Wang, H. Complete chloroplast genomes of four Physalis species (Solanaceae): Lights into genome structure, comparative analysis, and phylogenetic relationships. BMC Plant Biol. 2020, 20, 242. [Google Scholar] [CrossRef]
- Wang, W.; Yang, T.; Wang, H.L.; Li, Z.J.; Ni, J.W.; Su, S.; Xu, X.Q. Comparative and phylogenetic analyses of the Complete chloroplast genome of six Almond species (Prunus spp. L.). Sci. Rep. 2020, 10, 10137. [Google Scholar] [CrossRef]
- Qian, S.; Zhang, Y.; Lee, S.Y. Comparative Analysis of Complete Chloroplast Genome Sequences in Edgeworthia (Thymelaeaceae) and New Insights into Phylogenetic Relationships. Front. Genet. 2021, 12, 643222. [Google Scholar] [CrossRef]
- Daniell, H.; Lin, C.S.; Yu, M.; Chang, W.J. Chloroplast genomes: Diversity, evolution, and applications in genetic engineering. Genome Biol. 2016, 17, 134. [Google Scholar] [CrossRef]
- Dobrogojski, J.; Adamiec, M.; Lucinski, R. The chloroplast genome: A review. Acta Physiol. Plant. 2020, 42, 98. [Google Scholar] [CrossRef]
- Raman, G.; Park, K.T.; Kim, J.H.; Park, S.J. Characteristics of the completed chloroplast genome sequence of Xanthium spinosum: Comparative analyses, identification of mutational hotspots and phylogenetic implications. BMC Genom. 2020, 21, 855. [Google Scholar] [CrossRef] [PubMed]
- Huo, Y.M.; Gao, L.M.; Liu, B.J.; Yang, Y.Y.; Kong, S.P.; Sun, Y.Q.; Yang, Y.H.; Wu, X. Complete chloroplast genome sequences of four Allium species: Comparative and phylogenetic analysis. Sci. Rep. 2019, 9, 12250. [Google Scholar] [CrossRef] [PubMed]
- Alzahrani, D.A.; Yaradua, S.S.; Albokhari, E.J.; Abba, A. Complete chloroplast genome sequence of Barleria prionitis, comparative chloroplast genomics and phylogenetic relationships among Acanthoideae. BMC Genom. 2020, 21, 393. [Google Scholar] [CrossRef] [PubMed]
- Asaf, S.; Khan, A.L.; Numan, M.; Al-Harrasi, A. Mangrove tree (Avicennia marina): Insight into chloroplast genome evolutionary divergence and its comparison with related species from family Acanthaceae. Sci. Rep. 2021, 11, 3586. [Google Scholar] [CrossRef] [PubMed]
- Lemieux, C.; Otis, C.; Turmel, M. Comparative chloroplast genome analyses of streptophyte green algae uncover major structural alteration in the Klebsormidiophyceae, Coleochaetophyceae and Zygnematophyceae. Front. Plant Sci. 2016, 7, 697. [Google Scholar] [CrossRef] [PubMed]
- Ng, P.K.; Lin, S.M.; Lim, P.E.; Liu, L.C.; Chen, C.M.; Pai, T.W. Complete chloroplast genome of Gracilaria firma (Gracilariaceae, Rhodophyta) with discussion on the use of chloroplast phylogenomics in the subclass Rhodymeniophycidae. BMC Genom. 2017, 18, 40. [Google Scholar] [CrossRef]
- Song, Y.; Chen, Y.; Lv, J.Z.; Xu, J.; Zhu, S.F.; Li, M.F.; Chen, N. Development of chloroplast genomic resources for Oryza species discrimination. Front. Plant Sci. 2017, 8, 1854. [Google Scholar] [CrossRef]
- Tan, W.; Gao, H.; Jiang, W.; Zhang, H.; Yu, X.; Lui, E.; Tian, X. The complete chloroplast genome of Gleditsia sinensis and Gleditsia japonica: Genome organization, comparative analysis, and development of taxon specific DNA mini-barcodes. Sci. Rep. 2020, 10, 16309. [Google Scholar] [CrossRef]
- Xu, J.; Shen, X.; Liao, B.; Xu, J.; Hou, D. Comparing and phylogenetic analysis chloroplast genome of three Achyranthes species. Sci. Rep. 2020, 10, 10818. [Google Scholar] [CrossRef]
- Shendage, S.M.; Yadav, S.R. Revision of the genus Barleria (Acanthaceae) in India. Rheedea 2010, 20, 81–130. [Google Scholar]
- Dierckxsens, N.; Mardulyn, P.; Smits, G. NOVOPlasty: De novo assembly of organelle genomes from whole genome data. Nucleic Acids Res. 2017, 45, e18. [Google Scholar] [CrossRef] [PubMed]
- Tillich, M.; Lehwark, P.; Pellizzer, T.; Ulbricht-Jones, E.S.; Fischer, A.; Bock, R.; Greiner, S. GeSeq—Versatile and accurate annotation of organelle genomes. Nucleic Acids Res. 2017, 45, W6–W11. [Google Scholar] [CrossRef] [PubMed]
- Greiner, S.; Lehwark, P.; Bock, R. Organellar Genome DRAW (OGDRAW) version 1.3.1: Expanded toolkit for the graphical visualization of organellar genomes. Nucleic Acids Res. 2019, 2, W59–W64. [Google Scholar] [CrossRef] [PubMed]
- Beier, S.; Thiel, T.; Münch, T.; Scholz, U.; Mascher, M. MISA-web: A web server for microsatellite prediction. Bioinformatics 2017, 33, 2583–2585. [Google Scholar] [CrossRef] [Green Version]
- Kurtz, S.; Choudhuri, J.V.; Ohlebusch, E.; Schleiermacher, C.; Stoye, J.; Giegerich, R. REPuter: The Manifold Applications of Repeat Analysis on a Genomic Scale. Nucleic Acids Res. 2001, 29, 4633–4642. [Google Scholar] [CrossRef]
- Benson, G. Tandem repeats finder: A program to analyze DNA sequences. Nucleic Acids Res. 1999, 27, 573–580. [Google Scholar] [CrossRef]
- Amiryousefi, A.; Hyvӧnen, J.; Poczai, P. IRscope: An online program to visualize the junction sites of chloroplast genomes. Bioinformatics 2018, 34, 3030–3031. [Google Scholar] [CrossRef]
- Frazer, K.A.; Pachter, L.; Poliakov, A.; Rubin, E.M.; Dubchak, I. VISTA: Computational tools for comparative genomics. Nucleic Acids Res. 2004, 32, W273–W279. [Google Scholar] [CrossRef]
- Brudno, M.; Malde, S.; Poliakov, A.; Do, C.B.; Couronne, O.; Dubchak, I.; Batzoglou, S. Global Alignment: Finding Rearrangements During Alignment. Bioinformatics 2003, 19, i54–i62. [Google Scholar] [CrossRef]
- Kuraku, S.; Zmasek, C.M.; Nishimura, O.; Katoh, K. aLeaves facilitates on-demand exploration of metazoan gene family trees on MAFFT sequence alignment server with enhanced interactivity. Nucleic Acids Res. 2013, 41, W22–W28. [Google Scholar] [CrossRef]
- Katoh, K.; Rozewicki, J.; Yamada, K.D. MAFFT online service: Multiple sequence alignment, interactive sequence choice and visualization. Brief Bioinform. 2019, 20, 1160–1166. [Google Scholar] [CrossRef] [PubMed]
- Kimura, M. A simple method for estimating evolutionary rate of base substitutions through comparative studies of nucleotide sequences. J. Mol. Evol. 1980, 16, 111–120. [Google Scholar] [CrossRef] [PubMed]
- Kumar, S.; Stecher, G.; Li, M.; Knyaz, C.; Tamura, K. MEGA X: Molecular Evolutionary Genetics Analysis across computing platforms. Mol. Biol. Evol. 2018, 35, 1547–1549. [Google Scholar] [CrossRef] [PubMed]
- Librado, P.; Rozas, J. DnaSP v5: A software for comprehensive analysis of DNA polymorphism data. Bioinformatics 2009, 25, 1451–1452. [Google Scholar] [CrossRef] [PubMed] [Green Version]
- Wernersson, R. FeatureExtract—Extraction of sequence annotation made easy. Nucleic Acids Res. 2005, 33, W567–W569. [Google Scholar] [CrossRef]
- Guindon, S.; Gascuel, O. A simple, fast and accurate method to estimate large phylogenies by maximum-likelihood. Syst. Biol. 2003, 52, 696–704. [Google Scholar] [CrossRef]
- Darriba, D.; Taboada, G.L.; Doallo, R.; Posada, D. jModelTest 2: More models, new heuristics and parallel computing. Nat. Methods. 2012, 9, 772. [Google Scholar] [CrossRef]
- Huang, S.; Ge, X.J.; Cano, A.; Salazar, B.G.M.; Deng, Y. Comparative analysis of chloroplast genomes for five Dicliptera species (Acanthaceae): Molecular structure, phylogenetic relationships, and adaptive evolution. PeerJ 2020, 8, e8450. [Google Scholar] [CrossRef]
- Nguyen, L.T.; Schmidt, H.A.; von Haeseler, A.; Minh, B.Q. IQ-TREE: A fast and effective stochastic algorithm for estimating maximum likelihood phylogenies. Mol. Biol. Evol. 2015, 32, 268–274. [Google Scholar] [CrossRef]
- Trifinopoulos, J.; Nguyen, L.T.; von Haeseler, A.; Minh, B.Q. W-IQ-TREE: A fast online phylogenetic tool for maximum likelihood analysis. Nucleic Acids Res. 2016, 44, W232–W235. [Google Scholar] [CrossRef]
- Miller, M.A.; Pfeiffer, W.; Schwartz, T. Creating the CIPRES Science Gateway for inference of large phylogenetic trees. In Proceedings of the Gateway Computing Environments Workshop (GCE), New Orleans, LA, USA, 14 November 2010; pp. 1–8. [Google Scholar]
- Ronquist, F.; Teslenko, M.; Mark, P.V.D.; Ayres, D.L.; Darling, A.; Hohna, S.; Larget, B.; Liu, L.; Suchard, M.A.; Huelsenbeck, J.P. Mrbayes 3.2: Efficient Bayesian Phylogenetic Inference and Model Choice Across A Large Model Space. Syst. Biol. 2012, 61, 539–542. [Google Scholar] [CrossRef] [PubMed]
- Hishamuddin, M.S.; Lee, S.Y.; Ng, W.L.; Ramlee, S.I.; Lamasudin, D.U.; Mohamed, R. Comparison of eight complete chloroplast genomes of the endangered Aquilaria tree species (Thymelaeaceae) and their phylogenetic relationships. Sci. Rep. 2020, 10, 13034. [Google Scholar] [CrossRef] [PubMed]
- Rambaut, A. FigTree v.1.4. Available online: http://tree.bio.ed.ac.uk/software/figtree (accessed on 21 April 2022).
- Kumar, V.; Singh, S. Gastroprotective activity of methanol leaves extract of Barleria prionitis Linn. on ethanol and indomethacin induced ulcer in rats. J. Pharm. Res. 2013, 3, 817–829. [Google Scholar] [CrossRef]
- Banerjee, S.; Banerjee, S.; Jha, G.K.; Bose, S. Barleria prionitis L.: An illustrative traditional, phytochemical and pharmacological: A review. J. Nat. Prod. 2021, 11, 258–274. [Google Scholar] [CrossRef]
- Banerjee, S.; Banerjee, S.; Jha, G.K.; Bose, S. Conspectus of phytoconstituents and pharmacological activities of Barleria lupulina Lindl.: A Review. Curr. Tradit. Med. 2021, 7, 325–334. [Google Scholar] [CrossRef]
- Sudheer, W.N.; Praveen, N. Phytochemical, pharmacological and tissue culture studies of some important species of the genus Barleria L. (Acanthaceae)-A review. Plant Sci. Today 2021, 8, 491–500. [Google Scholar] [CrossRef]
- Ghosh, T.; Mukherjee, S.K.; Debnath, H.S. Comparative Taxonomic Studies of Four Species of Barleria L. (Tribe Justicieae Sensu Benth. & Hook. F.—Acanthaceae) of N.E. In dia. In Systematics of Flowering Plants; International Seminar on Multidisciplinary Approaches in Angiosperm Systematics, Department of Botany, University of Kalyani, Kalyani: Nadia, India, 2012; pp. 112–117. ISBN 978-93-5067-867-1. [Google Scholar]
Figure 1.
Gene map of the five species of Barleria chloroplast genomes. The inside circle genes are transcribed clockwise, whereas the outside circle genes are transcribed counter-clockwise; the color codes are described for the different function groups of the genes; the thick lines indicate the boundary of the inverted repeats (IRA and IRB), demarcated between the large single-copy (LSC) and small single-copy (SSC) regions; the dark gray area in the inner circle represents the genomic GC content, whereas the light gray indicates the AT content, respectively.

Figure 2.
Repeated sequence analysis in the five Barleria species. (A) Number of classified SSR repeat units; (B) distribution and frequency of long repeats, including forward, palindromic, and reverse repeats; (C) number of tandem repeats.
Figure 2.
Repeated sequence analysis in the five Barleria species. (A) Number of classified SSR repeat units; (B) distribution and frequency of long repeats, including forward, palindromic, and reverse repeats; (C) number of tandem repeats.

Figure 3.
Comparison of the large single-copy (LSC), small single-copy (SSC), and a pair of an inverted repeat (IR) region borders of the six Barleria chloroplast genomes. The boxes below and above the lines indicate the adjacent border gene revealing the point differences as a shorter ndhF gene sequence and a lack of the ycf1 gene in B. strigosa.

Figure 4.
Sequence alignment comparison of the Barleria chloroplast genome using mVISTA, with B. prionitis as a reference. The purple bars represent exons; the pink bars represent non-coding sequences (CNS); the light-blue bars represent tRNA and rRNA regions; the gray arrows above the aligned sequences indicate the genes and their orientations; the x-axis represents the number of bases in the aligned sequences; the y-axis represents the percent identity from 50–100%; the dark gray bars indicate variation regions in the genomes.

Figure 5.
Nucleotide variability values were compared between the six Barleria chloroplast sequences using a sliding window analysis (window length is 1000 bp; step size is 500 bp). The x-axis and y-axis indicate the position of the midpoint of the nucleotide diversity of each window.
Figure 5.
Nucleotide variability values were compared between the six Barleria chloroplast sequences using a sliding window analysis (window length is 1000 bp; step size is 500 bp). The x-axis and y-axis indicate the position of the midpoint of the nucleotide diversity of each window.

Figure 6.
Phylogenetic relationships of the twenty chloroplast sequences inferred from the maximum likelihood (ML) and the Bayesian inference (BI). The numbers associated with each node represent bootstrap support value/posterior probabilities (PPs); (A) a phylogenetic tree from the complete chloroplast sequences; (B) a phylogenetic tree from the protein-coding sequences (CDSs); the colors were used to classify the Acanthaceae tribes. Two species, Erythanthe lutea (Phrymaceae) and Scrophularia dentata (Scrophulariaceae), were used for the outgroups.

Figure 7.
Phylogenetic relationships from four nucleotide hotspot regions, including (A) ccsA-ndhD, (B) ndhA-ndhH-rps15, (C) ycf1, and (D) trnN-GUU-trnR-ACG. The numbers associated with each node represent bootstrap support values.
Figure 7.
Phylogenetic relationships from four nucleotide hotspot regions, including (A) ccsA-ndhD, (B) ndhA-ndhH-rps15, (C) ycf1, and (D) trnN-GUU-trnR-ACG. The numbers associated with each node represent bootstrap support values.


Table 1.
Chloroplast genome features of Barleria species.
| Plant Species | Length (bp) | G-C Content (%) | Total of Genes | CDS | tRNA | rRNA | Collection Numbers | GenBank Accession Numbers | ||||||
|---|---|---|---|---|---|---|---|---|---|---|---|---|---|---|
| LSC | SSC | IR | cpGenome | LSC | SSC | IR | cpGenome | |||||||
| B. cristata | 83,650 | 17,677 | 25,325 | 151,977 | 36.5 | 32.6 | 38.4 | 43.5 | 131 | 86 | 37 | 8 | A. Chaveerach 1095 | ON768801 |
| B. lupulina | 83,854 | 17,789 | 25,315 | 152,273 | 36.4 | 32.7 | 38.3 | 43.5 | 131 | 86 | 37 | 8 | A. Chaveerach 1096 | ON768802 |
| B. repens | 83,819 | 17,771 | 25,367 | 152,324 | 36.5 | 32.5 | 38.3 | 43.4 | 131 | 86 | 37 | 8 | A. Chaveerach 1099 | ON768803 |
| B. siamensis | 83,929 | 17,804 | 25,296 | 152,236 | 36.5 | 32.7 | 38.4 | 43.4 | 131 | 86 | 37 | 8 | A. chaveerach 1098 | ON768804 |
| B. strigosa | 83,804 | 17,715 | 25,315 | 152,272 | 36.5 | 32.4 | 38.3 | 43.5 | 131 | 86 | 37 | 8 | A. chaveerach 1097 | ON768805 |
Table 2.
List of annotated genes in the five Barleria chloroplast genomes.
| Category | Group of Function | Location | List of Genes |
|---|---|---|---|
| Self-replication related genes | Large subunit of ribosome proteins | LSC/IR/SSC | rpl2(x2) b, rpl14, rpl16 b, rpl20, rpl22, rpl23(x2), rpl32, rpl33, rpl36 |
| small subunit of ribosomal proteins | LSC/IR/SSC | rps2, rps3, rps4, rps7(x2), rps8, rps11, rps12 a, rps14, rps15, rps16 b, rps18, rps19 | |
| DNA-dependent RNA polymerase | LSC | rpoA, rpoB, rpoC1 b, rpoC2 | |
| rRNA genes | IR | rrn4.5(x2), rrn5(x2), rrn16(x2), rrn23(x2) b | |
| tRNA genes | LSC/IR/SSC | trnA-UGC(x2) b, trnC-GCA, trnD-GUC, trnE-UUC, trnF-GAA, trnfM-CAU, trnG-GCC, trnH-GUG, trnI-CAU(x2), trnI-GAU(x2) b, trnK-UUU b, trnL-CAA(x2), trnL-UAA b, trnL-UAG, trnM-CAU, trnN-GUU(x2), trnP-UGG, trnQ-UUG, trnR-ACG(x2), trnR-UCU, trnS-CGA b, trnS-GCU, trnS-GGA, trnS-UGA, trnT-GGU, trnT-UGU, trnV-GAC(x2), trnV-UAC b, trnW-CCA, trnY-GUA | |
| Photosynthesis related genes | Photosystem I | LSC/SSC | psaA, psaB, psaC, psaI, psaJ |
| Photosystem II | LSC | psbA, psbB, psbC, psbD, psbE, psbF, psbH, psbI, psbJ, psbK, psbL, psbM, psbN, psbT, psbZ | |
| NADH oxidoreductase | LSC/IR/SSC | ndhA b, ndhB(x2) b, ndhC, ndhD, ndhE, ndhF, ndhG, ndhH, ndhI, ndhJ, ndhK | |
| Cytochrome b6/f complex | LSC | petA, petB b, petD b, petG, petL, petN | |
| Cytochrome c synthesis | SSC | ccsA | |
| ATP synthase | LSC | atpA, atpB, atpE, atpF b, atpH, atpI | |
| Rubisco | LSC | rbcL | |
| Other genes | Maturase | LSC | matK |
| Protease | LSC | clpP c | |
| Envelope membrane protein | LSC | cemA | |
| Subunit acetyl-CoA-carboxylase | LSC | accD | |
| translational initiation factor 1 | LSC | infA | |
| Unknown function genes | Conserved hypothetical chloroplast reading frames (ycf) | LSC/IR/SSC | ycf1, ycf2(x2), ycf3 c, ycf4, ycf15(x2) |
Symbolic definition: a = a gene that has been divided into two independent transcription units; b = a gene with a single intron; c = a gene with two introns; (x2) = duplicated genes located in the IR regions.
Table 3.
Eighteen genes with introns in the five Barleria chloroplast genomes and length of the exons and introns.
Table 3.
Eighteen genes with introns in the five Barleria chloroplast genomes and length of the exons and introns.
| List of Genes | Location | Size (bp) | Total Size (bp) | ||||
|---|---|---|---|---|---|---|---|
| Exon I | Intron I | Exon II | Intron II | Exon III | |||
| atpF | LSC | 446 | 698 | 143 | 1289 | ||
| clpP | LSC | 228 | 642 | 291 | 718 | 66 | 1948 |
| ndhA | SSC | 539 | 1071 | 551 | 2163 | ||
| ndhB | IR | 755 | 678 | 776 | 2211 | ||
| petB | LSC | 5 | 735 | 641 | 1383 | ||
| petD | LSC | 7 | 742 | 474 | 1225 | ||
| rpl16 | LSC | 405 | 893 | 8 | 1308 | ||
| rpl2 | IR | 392 | 671 | 434 | 1499 | ||
| rpoC1 | LSC | 1621 | 797 | 430 | 2851 | ||
| rps16 | LSC | 226 | 867 | 39 | 1134 | ||
| rrn23 | IR | 198 | 2611 | 2810 | |||
| trnA-UGC | IR | 35 | 810 | 36 | 883 | ||
| trnI-GAU | IR | 41 | 939 | 34 | 1016 | ||
| trnK-UUU | LSC | 36 | 2452 | 36 | 2525 | ||
| trnL-UAA | LSC | 36 | 485 | 49 | 572 | ||
| trnS-CGA | LSC | 31 | 664 | 59 | 756 | ||
| trnV-UAC | LSC | 36 | 592 | 37 | 667 | ||
| ycf3 | LSC | 154 | 727 | 226 | 695 | 127 | 1933 |
Table 4.
Genetic distance analysis of the Barleria chloroplast genome.
| B. strigosa | B. repens | B. cristata | B. siamensis | B. prionitis | B. lupulina | |
|---|---|---|---|---|---|---|
| B. strigosa | 1.00 | |||||
| B. repens | 0.00574 | 1.00 | ||||
| B. cristata | 0.00601 | 0.00374 | 1.00 | |||
| B. siamensis | 0.00813 | 0.00772 | 0.00792 | 1.00 | ||
| B. prionitis | 0.01125 | 0.01097 | 0.01109 | 0.01109 | 1.00 | |
| B. lupulina | 0.01031 | 0.00990 | 0.01016 | 0.00998 | 0.00241 | 1.00 |
Publisher’s Note: MDPI stays neutral with regard to jurisdictional claims in published maps and institutional affiliations. |
© 2022 by the authors. Licensee MDPI, Basel, Switzerland. This article is an open access article distributed under the terms and conditions of the Creative Commons Attribution (CC BY) license (https://creativecommons.org/licenses/by/4.0/).
Share and Cite
MDPI and ACS Style
Kaewdaungdee, S.; Sudmoon, R.; Tanee, T.; Lee, S.Y.; Chaveerach, A. Chloroplast Genome Analysis for Genetic Information and Authentication in Five Barleria Species. Genes 2022, 13, 1705. https://doi.org/10.3390/genes13101705
AMA Style
Kaewdaungdee S, Sudmoon R, Tanee T, Lee SY, Chaveerach A. Chloroplast Genome Analysis for Genetic Information and Authentication in Five Barleria Species. Genes. 2022; 13(10):1705. https://doi.org/10.3390/genes13101705
Chicago/Turabian StyleKaewdaungdee, Sanit, Runglawan Sudmoon, Tawatchai Tanee, Shiou Yih Lee, and Arunrat Chaveerach. 2022. "Chloroplast Genome Analysis for Genetic Information and Authentication in Five Barleria Species" Genes 13, no. 10: 1705. https://doi.org/10.3390/genes13101705
Note that from the first issue of 2016, this journal uses article numbers instead of page numbers. See further details here.