

Diversity and Variation of Epiphytic Diatoms on Ruppia maritima L., Related to Anthropogenic Impact in an Estuary in Southern Brazil

Coastal Plant Ecology Laboratory, Biological Oceanography Institute, Federal University do Rio Grande, Av. Itália Km 8, Rio Grande 96201-900, Brazil
*
Author to whom correspondence should be addressed.
Diversity 2022, 14(10), 787; https://doi.org/10.3390/d14100787
Submission received: 16 June 2022
/
Revised: 9 August 2022
/
Accepted: 10 August 2022
/
Published: 22 September 2022
(This article belongs to the Special Issue Seagrass Ecosystems, Associated Biodiversity, and Its Management)
Abstract
:Knowledge about the diversity and spatiotemporal variability of epiphytic diatom communities in estuarine meadows has great relevance for coastal ecology and, thus, contributes to understanding the impact of natural and anthropogenic changes on seagrass meadows. The community of epiphytic diatoms in Ruppia maritima L. meadows was investigated in two environments with different levels of anthropogenic impact and nutrient loads. Both impacted and non-impacted meadows had similar conditions in terms of water depth, temperature and transparency but distinct nutrient loads and salinity ranges. A total of 159 diatom taxa were found on Ruppia maritima leaves during the monitoring period, including freshwater (30.8%), marine (25.1%), brackish (9.4%) and cosmopolitan (8.8%) taxa. The most abundant species were C. placentula, T. tabulata, M. pumila and T. fasciculata, in addition to A. tenuissimus, C. adhaerens and M. moniliformis. Although present in both sites, C. placentula and T. tabulata were the dominant species in the impacted site. We found that 32% of the taxa were exclusive to the non-impacted site, 23% to the impacted site and 45% were common to both sites. The study sites showed marked differences in community attributes; i.e., higher richness, diversity and equitability and lower dominance were found in the non-impacted site, which is distant from anthropogenic sources of domestic and industrial sewage and has low concentrations of dissolved N and P in water and low values of sediment organic matter. Nutrient concentration and salinity were the main factors behind the spatial and temporal variability in the structure of the epiphytic community when all other environmental variables were similar (water depth, temperature, transparency and host plant). The influence of temperature and salinity on community structure was site-dependent. This study revealed the high richness and diversity of epiphytic diatoms in the meadows of the Patos Lagoon estuary (PLE) and the high spatial and temporal heterogeneity of the communities, and it shows the potential of epiphytic community studies for the assessment of environmental quality in seagrass meadow habitats.

1. Introduction
Epiphytic algae enhance seagrass-meadow primary productivity, biodiversity and structural complexity, sustaining a significant part of estuarine and marine food webs [1]. Epiphytes protect seagrasses from UV-B radiation and desiccation [2,3], are used as food by invertebrates and small fishes [4,5,6] and can be more productive than their macroscopic seagrass hosts [7].
In addition, epiphytic algae may contribute up to 50% of the carbon buried in seagrass soils [8]. In the face of natural and human-induced perturbations, changes in seagrass system biodiversity can influence resource use and productivity, alter trophic interactions and reduce the stability of estuarine and coastal systems [9]. Therefore, understanding the composition and abundance of epiphytic algae and how they vary according to abiotic variables can contribute to the understanding of marine and coastal biodiversity but also to predictions of the impact of natural and anthropogenic changes on seagrass meadows.
Due to the faster growth rates and biomass turnover compared to their seagrass hosts and the specific community responses to changes in environmental conditions, epiphytic algae are excellent indicators of water quality, the integrity of seagrass meadows and the overall aquatic ecosystem [10,11]. The degradation of aquatic ecosystems causes changes in the structures of epiphytic algal communities, as well as subsequent reductions in taxonomic diversity and proliferations of toxic and opportunistic species [12,13]. However, few researchers have studied how epiphytic communities in general, and diatoms in particular, respond to changes in water quality, such as nutrient enhancement [14].
Among the epiphytic algae, diatoms are the dominant or the most abundant components in shallow estuarine areas [15,16]. The abundance and composition of diatom species are dependent on abiotic factors (nutrients, light availability, current velocity, wave action, temperature, salinity), biotic factors (especially herbivory action) [17,18,19] and intrinsic factors, such as motility [20].
The species of epiphytic diatoms on the same seagrass species may differ among different habitats [21]. For example, variability in spatial and temporal factors, such as salinity, nutrient availability and temperature, has been suggested to structure the epiphytic diatom community of Thalassia testudinum in Florida Bay, USA [22]. Another study [23] found that epiphyte composition was influenced mainly by environmental factors, such as wave energy, temperature, ammonium concentration and salinity compared to site (ocean versus bay) and host species. On the other hand, salinity has been shown to be the most important factor for diatom community dissimilarities between sites for both seagrasses [24] and macroalgal hosts [25,26]. Therefore, variations in the physicochemical characteristics of water have a significant influence on the epiphytic diatom community.
Despite their ecological relevance and their potential for water-quality monitoring, seagrass epiphytic algae are neglected in many areas where seagrass meadows occur mainly around reefs and within coastal lagoons; additionally, their conservation status is critical [13]. The few records of seagrass meadow epiphytes concern filamentous macroalgae on R. maritima [27] and Halodule wrightii [28], resulting in epiphytic diatoms remaining poorly studied [28,29].
Patos Lagoon in southern Brazil is a dominant feature of the coastal plain, connected to a large continental drainage basin (200.000 km2) and the Atlantic Ocean. The primary producers in the Patos Lagoon estuary (PLE) sustain a highly productive food web [30]. The PLE holds approximately 120 km2 of shoals and shallow bays, which are under different levels of natural and anthropogenic impacts [31,32]. The distribution and abundance of seagrass meadows in Patos Lagoon have diminished since the 1990s due to a complex combination of natural and anthropogenic changes [33], with significant effects on the structure of benthic macrofauna, the abundance of resident estuarine fish [34], trophic links [35] and the fate of organic matter [36]. In the PLE, the composition, density and biomass of microalgae are directly linked to the salinity regime, which depends on the water circulation, driven by regional climate and local weather conditions [37], and can influence the distribution of nutrients in the estuary [38,39].
Despite their small size and very thin leaves, Ruppia maritima meadows in PLE hold an abundant epiphytic algal community [29,40] that can be visible to the naked eye during periods of higher productivity. Knowledge about seagrass epiphytes in the PLE is scarce, restricted to a single short-term study that followed the epiphytic colonization process on R. maritima leaves and which identified only two species and nine diatom genera [29] that are commonly found in many seagrass meadows around the world [20,22,29,41,42,43,44,45,46,47,48,49]. Epiphyte composition and diversity in mature seagrass meadows are unknown, limiting the understanding of the role of seagrass in estuarine biodiversity and the causes of local reductions. Knowledge about epiphyte algae diversity can be used for estuarine monitoring and conservation planning.
The present study aimed to describe the temporal variability in epiphytic diatom abundance and community composition in R. maritima meadows at two distinct sites marked by different levels of anthropogenic impact and different abiotic variables.
Based on the premise that the spatial variability in community composition and abundance of epiphytic diatoms is structured mainly by the availability of nutrients and that temporal variability is mainly determined by salinity and temperature, our hypothesis states that the community attributes of the diatom assemblages will differ between the impacted and non-impacted areas, with higher values expected for the non-impacted site.
2. Materials and Methods
2.1. Study Area
For the study of epiphytic diatoms, two shallow areas of the Patos Lagoon estuary were chosen (Figure 1): Saco da Mangueira (SM) 32°5′13.9704″ S, 52°7′14.9628″ W and Saco da Quitéria (SQ) 32°2′8.3688″ S, 52°14′53.052″ W. The hydrodynamics of the PLE mainly depend on the relationships between the variability in continental discharge, wind action and water exchange with the sea [50,51]. Shallow areas (<1.5 m) provide favorable conditions for the establishment and development of submerged aquatic vegetation [33].
The SM is an environment with an area of approximately 23 km2 that is approximately 10 km long and 3.5 km wide in the central part, which is the widest part. The SQ is a smaller environment with an area of approximately 4.4 km2, approximately 3.5 km long and 1.7 km wide in more than half of its area, which tapers southwest to approximately 0.15 km wide. The SM is the largest shallow area of the PLE and is connected to this environment through an entrance of approximately 200 m, which is where the Ponte dos Franceses is located, a road that connects the city of Rio Grande to its industrial area. The SM is more heavily subject to anthropic action (release of effluents) and salt water than the SQ. The two sites were chosen for this study because they present a historical record of the presence of seagrass meadows, dominated by Ruppia maritima, and differ in terms of salinity and anthropogenic impact.
2.2. Epiphytic Diatom Sampling and Laboratory Procedures
Monthly monitoring of submerged vegetation was carried out (November 2015 to February 2018) in two Ruppia maritima meadows in the PLE located in SM and SQ.
At each site, vegetation samples were collected (N = 3) with a PVC extractor tube (10 cm in diameter and 78.5 cm2 in area) buried 15 cm deep in the sediment. The samples were collected, pre-washed in the field to remove the sediment and stored in plastic bags. The material was sorted in the laboratory for the removal of epiphytes using tweezers, brushes and jets of filtered water from the site (pore size 0.45 µm). The removed epiphytes were placed in 100 mL flasks, and half of this volume was fixed with 4% formaldehyde. To identify and quantify diatoms, two permanent slides were made per sample (N = 6 slides per site) according to the oxidation technique from [52] using Naphrax® resin (Brunel Microscopes Ltd, Chippenhan, Wiltshire, UK), for a total of 180 slides. At least 400 diatom valves were counted per sample through counts of approximately 200 valves per permanent slide. To determine the relative abundance, the number of valves counted and the number of species found were considered. Abundant species were those with values greater than the average calculated for the sample [53]. The epiphytic diatoms were identified and photographed under optical (Olympus CX 40) and scanning electron (SEM) microscopes at the electron microscopy center (CEME-SUL) of the University Federal do Rio Grande (FURG).
In each meadow, temperature, salinity, depth, transparency (Secchi disk) and water samples (N = 3) were collected at monthly intervals for determination of suspended solids and dissolved inorganic nutrients. The water samples were filtered with pre-weighed cellulose acetate filters (0.45 µm porosity), dried in an oven (60 °C for one hour) and reweighed to determine the material suspended in the water [54]. The water samples were filtered on the same day of collection and transported to the Ecology Center of the University Federal do Rio Grande dos Sul (CENECO-UFRGS) for analysis of dissolved inorganic nutrients (total ammoniacal nitrogen - TAN (NH4+), nitrate (NO3¯), nitrite (NO2¯) and orthophosphate (PO4¯)). Dissolved silica in water (silicate) data were obtained from the database of the Long-Term Ecological Program of the Federal University of Rio Grande (PELD-FURG), originating from a sampling point (museum station) located between the two areas of this study.
Sediment samples (cores: 5 cm diameter, buried up to 5 cm in depth) were collected each month until February 2017; after this period, they were collected seasonally to analyze organic matter (OM) content. The samples were analyzed using the calcination method [55]. Data for precipitation (monthly accumulated) and continental discharge (sum of the Jacuí, Taquari and Camaquã Rivers) for 30 days before collection were obtained from the National Institute of Meteorology (INMET) and from the National Water Agency (ANA). Hourly wind data for three days before collection were obtained from the Praticagem of Rio Grande station (RGPilots).
2.3. Data Analysis
Differences in environmental variables between sites were analyzed using Student’s t-test and the Mann–Whitney test after checking the assumptions of normality (Shapiro–Wilk and Kolmogorov–Smirnov) and homogeneity (Levene test) using Jamovi software [56].
Shannon’s diversity (H’ log2), equitability (J’) and dominance (D’) indices were calculated from the original matrix (159 taxa) using PAST software [57]. Diatom richness was treated here as the total number of taxa found. To investigate the spatial and monthly variation in richness, diversity, equitability and dominance, Student’s t-test and the Mann–Whitney test were performed after verifying the statistical assumptions. Temporal comparisons were undertaken by considering the month of collection and the following period (n = 12).
To test the expected spatial distribution and explore the monthly variation in species abundance and composition, two-way PERMANOVAs were performed with a purified matrix based on periods (n = 13) that presented vegetation in both locations (April 2016 to February 2017, May 2017 and February 2018) composed of 80 taxa. The Bray–Curtis distance was calculated from transformed data, and 9999 permutations were used. To test for statistical significance, the p value of the Monte Carlo test was considered when the number of possible permutations was low (<100) for greater test precision [58]. To identify the taxa with the greatest contribution to the differentiation between the samples, a multivariate analysis of percentage similarity (SIMPER) was performed using PRIMER® software, version 6 (PRIMER-e, Albany, Auckland, New Zealand. The ordination of the samples, based on differences in diatom abundance and composition, was analyzed using non-metric multidimensional scaling (NMDS) with the Bray–Curtis similarity index.
The relationships between the diatom community, the physical and chemical factors of the water of each meadow and meteorological variables were examined through canonical correspondence analysis (CCA) using matrices with monthly data for 104 taxa: 87 in the SQ (16 months) and 61 in the MS (14 months). For the analysis of CCA and PERMANOVAs (except composition), matrices with transformed data were used log (x+1), and rare taxa, defined as those whose frequency of occurrence was less than 5%, were excluded [59,60]. To identify relationships between the abiotic variables and the descriptor indices of the community structure (richness, diversity, equitability and dominance), simple linear regression analyses were performed.
3. Results
3.1. Environmental Variables
During the study period, the accumulated rainfall (30 days before each sampling date) ranged from 0 mm (June and July 2016 and September 2017) to 192.6 mm (March 2017) (Figure 2). The wind speed ranged between 2.6 ms−1 (June 2016) and 9.6 ms−1 (April 2017) (average 5.6 ms−1). The fluvial discharge (average 1867 m3 s−1) varied between 435.66 (June 2016) and 5444 m3 s−1 (June 2017) (Figure 2).
The study sites showed differences regarding salinity and nutrient concentrations, but no differences were found regarding water depth, temperature, transparency or suspended material (Table 1). The water depth ranged between 0.37 and 1.17 m (mean 0.75) in the SM and between 0.28 and 1.30 m (mean 0.71) in the SQ. The water temperature ranged between 11.0 and 28.5 °C (mean 19.5) in the SQ and between 9.0 and 27.0 °C (mean 19.1) in the SM. The suspended material values ranged between 3.6 and 166.0 mg L−1 (mean 32.6 mg L−1) in the SQ and between 4 and 128.0 mg L−1 (mean 31.8 mg L−1) in the SM. Water transparency varied from 0.12 to 0.91 m (mean 0.48 m). The average salinity and range were significantly higher (Tukey, p = 0.02) in the SM (0.0–25.0, mean 8.8) than in the SQ (0.0–19.0, mean 5.5).
TAN and phosphate values were higher in the SM (p = 0.00). TAN values ranged between 0.20 and 5.44 mg L−1 (mean 2.53 mg L−1) in the SM and between 0.04 and 5.08 mg L−1 (mean 1.60 mg L−1) in the SQ. Phosphate values ranged between 0.01 and 0.11 mg L−1 (mean 0.06 mg L−1) in the SM and between 0.01 and 0.08 mg L−1 (mean 0.02 mg L−1) in the SQ. Nitrite and nitrate values did not differ (p = 0.65) between sites (SM: 0.36–2.18 mg L−1, mean 0.86 mg L−1; SQ: 0.26–3.48 mg L−1, mean 0.98 mg L−1). The sites differed in terms of sediment organic matter content (p = 0.00), which was higher in the SM (0.31–2.3%, mean 1.10%) than in the SQ (0.42–1.79%, mean 0.78%). The variability of the environmental variables is shown in Table 1.
3.2. Community Composition and Abundance
A total of 159 diatom taxa were found on R. maritima leaves during the monitoring period (102 in the SM and 126 in the SQ) (Table S1), including freshwater (30.8%), marine (25.1%), brackish (9.4%) and cosmopolitan (8.8%) taxa. Approximately 25.7% of the taxa were not identified at the species level; therefore, their habitats could not be defined. Comparing the sites (periods with vegetation), we found that 32% of taxa were exclusive to the SQ, 23% to the SM and 45% were common to both sites.
The taxa were distributed in 67 genera. The genera with the highest numbers of species were Nitzschia (19) and Navicula (12), followed by Amphora (8); Tryblionella (7); Planothidium (6); Surirella and Diploneis (5); Cocconeis and Rhopalodia (4); Actinoptychus, Aulacoseira, Cyclotella, Fallacia, Fragilaria, Mastogloia, Pseudostaurosira, Skeletonema and Staurosirella (3); Achnanthes, Bacillaria, Caloneis, Desikaneis, Entomoneis, Eunotia, Gomphonemma, Halamphora, Hyalodiscus, Melosira, Pleurosigma, Seminavis, Tabularia and Terpsinoe (2). Another 35 genera presented single species.
Throughout the study period, 31 taxa were found to be abundant in the SQ and 21 in the SM, with 14 of these taxa being common to both sites: Ambo tenuissimus, Bacillaria paxillifera, Catenula adhaerens, Cocconeis placentula, Fistulifera saprophila, Melosira moniliformis, Navicula cruxmeridionalis, N. cryptotenella, N. frustulum, Pleurosira laevis, Pseudostaurosira brevistriata, P. clavatum, Skeletonema sp.3 and T. tabulata (Figure 3 and Figure 4). While 17 abundant taxa were found only in the SQ (Aulacoseira granulata, Chaetoceros sp., Cyclotella meneghiniana, Cyclotella sp.1, Mastogloia pumila, Nitzschia eutinensis, N. filiformis, N. subcohaerens, Psedostaurosiropsis geocollegarum, Rhopalodia rumrichiae, Seminavis strigosa, Skeletonema potamos, Skeletonema sp.2, Staurosirella guenter-grassii, Staurosirella aff. ovata, Tabularia fasciculata and Tryblionella persuadens), only 7 abundant taxa were exclusive to the SM (Fragilaria sp.1, Navicula sp.3, Navicula sp.5, N. microcephala, Paralia sulcata, Planothidium sp. and Pseudopodosira echinus).
The abundant taxa that were present continuously over time at both sites were A. tenuissimus, C. adhaerens and M. moniliformis. Three taxa were dominant in the SQ (T. tabulata in September and October 2016, M. pumila in May 2017 and M. moniliformis in February 2018) and three in the SM (C. placentula in January, February and May 2017; T. tabulata from April to July 2016; and P. laevis in September 2016) (Figure 5).
In the sequence we present some information about the five dominant taxa.
Tabularia tabulata (C. Agardh) Snoeijs
Dimensions: 185.0–490.0 µm long; 4.5–9.0 µm wide; 11–13 striae of 10 μm.
Marine and freshwater diatom, originally described by Agardh in 1983 as Diatoma tabulatum in the Adriatic Sea locality. The taxon was found in macroalgal samples in the Baltic Sea [61] at salinities of 4 to 7%. Tabularia is an epiphytic and epilitic genus and has a wide distribution worldwide [62]. The relative was similar at both sites (SQ: 0.5–78.7%, mean 19.0%; SM: 0.1–84.5%, mean 22.4%).
Mastogloia pumila (Grunow) Cleve
Dimensions: 25.9–31.4 µm long; 6.6–8.4 µm wide; 26 striae of 10 μm; 6–8 partectas on each side, 4 with sizes of 10 µm.
Marine diatom described by Cleve for slightly brackish waters of the Baltic and Hawaii. The taxon can be epiphytic, epilithic and epipelic [63]. The genus is marine but can also occur in brackish and freshwater environments [64]. The mean relative abundance was higher in the SQ (0.1–57.9%, mean 8.4%) than in the SM (0.1–0.9%, mean 0.3%).
Melosira moniliformis var. octagona (Grunow) Hustedt
Dimensions: 12.3–33.3 µm diameter; 22 areolae of 10 µm on the valve face.
Freshwater diatom that is found in estuarine and marine environments. The species has been found in plankton and sediment samples from the Praia do Cassino and Patos Lagoon Estuary [63,65]. The variety has an octagonal shape in connective view, forming long chains in unoxidized material and double chains after oxidation. Under experimental conditions, it shows optimum growth in salinities between 20 and 30 [66]. The mean relative abundance was similar at both sites (SQ: 0.5–46.8%, mean 7.1%; SM: 0.7–26.6%, mean 8.6%).
Cocconeis placentula Ehrenberg
Dimensions: 17.0–30.5 µm long; 7.6–18.0 µm wide; 18–23 striae of 10 μm.
Freshwater diatom originally found in the roots of the aquatic macrophyte Lemna L. by Ehrenberg. It is found in phanerogams, such as Ruppia maritima [29], Zostera noltei [67] and Posidonia oceanica [48]. The genus and taxon are commonly found with epiphytic habits. The mean relative abundance was higher in the SM (2.3–75.1%, mean 27.8%) than in the SQ (0.3–18.5%, mean 6.1%).
Pleurosira laevis (Ehrenberg) Compère
Dimensions: 65.9–131.4 µm diameter; 11–16 areolae of 10 µm.
Brackish water diatom with cylindrical cells connected by ocelli, forming filaments in a zig zag pattern. It is also found in estuarine regions with freshwater, such as the Rio de La Plata estuary (salinity 0.5), where it was found to be epiphytic of S. californicus [68]. It has also been found as epiphytic [69], as well as in the plankton [64] and sediment [70], in the PLE. The genus is probably one of the few that has found its ideal niche in brackish waters, such as estuaries [62]. The mean relative abundance was higher in the SM (0.1–53.7%, mean 9.9%) than in the SQ (0.1–4.5%, mean 1.1%).
3.3. Spatial and Temporal Variability
Community Attributes: Diversity, Equitability and Dominance
The mean values of the community attributes indicated variability across months and significant differences between sites for all community attributes (Figure 6). In general, higher richness (19–41), diversity (1.4–4.4; mean 3.3) and equitability values (0.3–0.8; mean 0.7) were found in the SQ, and lower dominance (0.1–0.6; mean 0.2) was found compared to the SM. For the SM, the ranges and average values for those attributes were: richness 8.0–30; diversity 0.9–3.7, mean 2.2; equitability 0.3–0.8, mean 0.5; dominance 0.1–0.7, mean 0.4. We found significant spatial differences for all community descriptor indices.
Richness and diversity differed between sites in most comparisons, except in August and November 2016 and February and May 2017. The sites were similar in terms of equitability and dominance in the periods of August, September and November 2016 and in February and May 2017. In December 2016 and February 2018, the sites were similar only in terms of equitability.
In the visual analysis of the NMDS graphs (Figure 7), as seen in both Figure 7A (abundance) and 7B (composition), it was possible to observe that most of the samples were distributed on opposite sides, revealing that the composition and abundance of the PLE diatom community in the more heavily impacted site (SM) differed from the non-impacted site (SQ).
The results of the NMDS were confirmed statistically with PERMANOVAs, which revealed that meadows were distinct in terms of diatom composition and abundance (p < 0.05). According to the Monte Carlo test, the meadows were similar in terms of composition only in the May 2016 and January 2017 periods (p > 0.05). At both sites, temporal variability in the diatom composition and abundance was detected (p < 0.05). In pairwise comparisons, when analyzing the month of collection and the following month (N = 12), we observed distinctions regarding composition (SQ: N = 6; SM: N = 3) and abundance (SQ: N = 10; SM: N = 8). At both sites, the abundance had a more pronounced variability than the composition, which varied more in the SQ than in the SM (Table 2). The differences between the sites in terms of abundance and composition were also observed in the NMDS analyses (Figure 7).
According to the SIMPER analysis, the species with the greatest contributions to the dissimilarities between sites in terms of abundance were: T. fasciculata, M. pumila and R. rumrichiae (April 2016); B. paxillifera, T. fasciculata and A. tenuissimus (May 2016); N. eutinensis, M. pumila and P. brevistriata (June 2016); B. paxillifera, M. pumila and T. fasciculata (July 2016); R. rumrichiae, N. cryptotenella and M. pumila (August 2016); P. laevis, T. tabulata and P. brevistriata (September 2016); T. tabulata, C. adhaerens and P. sulcata (October 2016); Skeletonema sp.2, P. laevis and Navicula sp.3 (November 2016); P. laevis, P. brevistriata and S. guenter-grassii (December 2016); T. tabulata, T. fasciculata and P. brevistriata (January 2017); C. placentula, T. fasciculata and T. tabulata (February 2017); M. pumila, T. tabulata and C. placentula (May 2017); N. microcephala, P. laevis and P. sulcata (February 2018).
The periods with the highest mean dissimilarities (more than 70.0) were July 2016 and May 2017. The taxa that most contributed to dissimilarities between sites in July 2016 (B. paxillifera (6.2%), M. pumila (6.2%), T. fasciculata (5.4%)) had greater abundances in the SQ. In May 2017, M. pumila (12.6%) and T. tabulata (9.6%) had higher abundances in the SQ, while C. placentula (9.4%) had higher abundances in the SM. In general, most taxa that contributed to the dissimilarity had higher abundances in the SQ. The first three taxa of the SIMPER analysis contributed approximately 30% of the dissimilarity between sites. Only three periods had mean dissimilarities below 50 (May 2016, June 2016 and August 2016), again confirming that the sites were distinct in terms of abundance (Table 3).
For the temporal variability of the community, among the comparisons made (n = 12), periods of distinction regarding richness occurred in all the comparisons (SQ: n = 3; SM: n = 6), and they were also noted for diversity (SQ: n = 7; SM: n = 5), equitability (SQ: n = 6; SM: n = 4), dominance (SQ: n = 6; SM: n = 4), abundance (SQ: n = 10; SM: n = 8) and composition (SQ: n = 6; SM: n = 3).
3.4. Correspondence between Epiphytic Diatom Assemblages and Environmental Variables
Canonical correspondence analysis (CCA) showed that the percentage of variance explained by the relationship of the physical and chemical variables with the taxa was 64% (sum of axes 1, 2 and 3) (Figure 8).
The CCA differentiates the sites, with most samples located on the positive side of axis 1 being from the SQ and those on the negative side from the SM. Axis 1 was mainly positively correlated with phosphate and organic matter and negatively correlated with suspended material. Axis 2 was positively related to salinity and suspended material and negatively related to temperature and nitrate + nitrite.
In the SM, the taxa with the highest abundances in periods with the highest phosphate concentrations were: P. leavis, C. radiatus, T. circumsuta, N. cruxmeridionalis (September 2016) and C. placentula (May 2017). May 2017 was also the period with the highest organic matter, TAN and salinity values. The taxa T. americana, T. compressa, M. moniliformis and N. microcephala had their highest abundances in a period with lower phosphate concentrations (February 2018). Despite the low concentration of phosphate, the period of February 2018 had a high concentration of TAN and high salinity. Navicula sp.3 was more abundant in the period with lower suspended material (November 2016). In the SQ, the taxa with the highest abundances in periods with lower salinities were C. crucicula (November 2015), C. meneghiniana (November 2016) and Cyclotella sp.1 (December 2016). November 2016 was also the period with the highest concentration of nitrate + nitrite, phosphate and suspended material. The suspended material had a negative relationship with the water transparency in the SQ (R2 = 0.58).
Comparing the community structure with the environmental variables, in the SM, richness, diversity and equitability were positively (but weakly) related to temperature (R2 = 0.24, 0.20 and 0.17) and negatively related to dominance (R2 = 0.20); in the SQ, richness was negatively related to organic matter and TAN (R2 = 0.12 for both variables). Salinity was negatively related to richness and diversity (R2 = 0.30 for both descriptors).
Our results supported the hypothesis that the community attributes of the diatom assemblages would differ between the impacted and non-impacted areas, with higher values found in the non-impacted site and higher dominance in the impacted site.
4. Discussion
The results of the present study revealed that meadows of Ruppia maritima in PLE sustain rich and diverse epiphytic diatom communities. The total number of diatom taxa found in our study (68 genera and 159 sp) was much higher than values reported for other Ruppia meadows from estuarine areas [40,44]. The richness and composition found here were similar to those found for local brackish marsh plants located in a pristine site [69]. This study also revealed that community structure and composition vary according to season and between sites, driven mainly by changes in salinity and nutrient conditions.
The study sites were marked by significant differences in salinity, nutrients (phosphate and TAN) and sediment organic matter. The higher values of salinity, nutrients and organic matter found in the SM compared to the SQ may have been related to proximity to the ocean and eutrophication sources, entailing receipt of both domestic waste and industrial effluents [71]. Considering that the study sites were classified as brackish water—i.e., intended for the preservation and balance of aquatic communities—the values of nitrogen (TAN) and nitrate found were above the limits established by Brazilian legislation (Nacional Environmental Concil—CONAMA 357/2005 [72]): on average, 6.3 and 4.0 times higher in the SM and SQ for TAN and, in terms of means, 1.2 and 1.4 times higher in the SM and SQ for nitrate.
Values within the limit defined by CONAMA were found only in the period of November 2015 in the SQ (TAN) and January 2016 in both sites (TAN and nitrate). Phosphate concentrations were compared to values considered normal in unpolluted estuaries (0.03 mg L−1; [73,74]), and they were higher in the SQ only in the periods of September and October 2017. In the SM, there were lower values only in the periods of December 2015, July 2016 and February 2018.
According to our results, R. maritima is an important host for epiphytic diatoms, both in impacted and non-impacted areas. The fact that the same species could be studied at both sites implied that there was similar availability of microhabitats for epiphytes due to their similar morphologies. The abundance and diversity of epiphytic communities depend on the host plant, since different seagrass morphologies tend to promote distinct microhabitats for epiphytes [49]. Another study, however, found no differences in community structure among seagrass species during a short sampling period, which agrees with the neutral substrate hypothesis [42]. According to this hypothesis, the substrate does not stimulate or prevent the growth of epiphytes. However, while some macrophytes can be neutral hosts for their epiphytes, others can profoundly affect their production and, in both cases, the community composition can vary significantly between hosts [75]. Despite the similar availability of microhabitats, the differences in the epiphytic diatom communities between the sites did not reveal specificity for R. maritima, which would have indicated the neutrality of this substrate. However, the anthropogenic impact showed a greater influence on the epiphytic diatom community than the morphological similarity of the substrate.
While host preference is an unresolved question in structuring epiphytic diatoms [76], environmental conditions may have equal or greater importance. Despite colonizing the same substrate (R. maritima), the studied epiphytic diatom community showed high heterogeneity between sites. The greater richness, diversity and equitability and higher percentage of exclusive taxa at the SQ site compared to the SM site reflect a better preserved environment and higher water quality. In contrast, high nutrient loads decrease diatom species diversity and promote the dominance of a few taxa [77,78,79], as we observed in the SM. Epiphytic diatoms in sites with high levels of nutrients have a composition that favors dominant species, while sites with lower levels of nutrients, although containing these same species, have lower abundances [80]. Spatial differences in nutrient availability may exert the greatest control over regional variations in epiphyte loads in seagrasses [81].
In addition to nutrient availability, salinity may be a structuring factor in the spatial distribution of the seagrass epiphytic diatom community [22]. We found spatial differences in composition and abundance (CCA) marked by both nutrient availability and salinity (higher in the SM). While salinity negatively affected richness, diversity and equitability in the SQ, the SM community structure was not affected by the variability in salinity, indicating that diatoms may be more generalist and tolerant to salinity variability. In tropical seagrass meadows, differences between communities of epiphytic diatoms growing on T. testudinum were related to salinity levels (marine versus hypersaline) [82]. In the hypersaline site, there were greater numbers of rare taxa and lower richness and diversity than in the more stable marine environment. In our study, the degree of anthropogenic impact and proximity to the ocean influenced the epiphytic communities at the study sites.
In a study with epiphytic diatoms from the Baltic Sea, no reduction in richness related to salinity decrease was observed [26]. Another study found that, in the absence of anthropogenic impacts, stable marine environments enhance algal species’ richness and diversity in R. cirrohosa meadows [83]. In our study, the variability in salinity was very high throughout the year (from 0 to 30), depending mainly on the seasonal cycle of precipitation and fluvial discharge. The autumn months were marked by higher values. Temporal stability and range variability may be more important structuring factors than the average salinity.
Seasonal changes in the epiphytic diatom community were found to be largely related to temperature [22], which was also the main factor responsible for changes in the epiphytic diatom community in subtropical mangroves in South China [84], while lower richness and diversity in diatom epiphytes in marsh plants has been found during winter [85]. For seagrasses, epiphytic biomasses are usually higher in summer months [49,86]. Additionally, some authors found that temperature was positively related to the richness of algal species associated with R. cirrhosa [83], and periods of increase in the diversity of epiphytic diatoms accompanied increases in temperature [87]. The low diversity of epiphytic diatoms during the winter and spring periods and the high diversity during the autumn and summer have been attributed to plant substrate abundance, influenced by freshwater discharge [88]. In addition to seasonality factors (temperature, salinity) and plant substrate availability, the variability in the nutrient pulses was also found to influence the high variability in the composition and abundance of the community over the months.
In our study, seasonality appeared to have distinct effects on community attributes. While it may have affected community composition, our analysis showed that temperature did not have significant effects on diatom community diversity and equitability in the non-impacted site SQ. Except for the reduction during the spring period (September and October 2016), diversity and equitability in the SQ remained high during most of the study period. However, in the impacted site SM, temperature appeared to be related to community variability. In addition, months with similar average temperatures had similar richness, diversity, equitability and dominance (April and May 2016, May and June 2016 (except for equitability) and June and July 2016; and November and December 2016, December 2016 and January 2017 (except richness) and January and February 2017) (Figure 6a–d).
Dominant diatom species are the main food source for grazers [89], and the reduced abundance of high-profile dominant taxa, such as T. tabulata (August 2016) and P. laevis (October 2016), may have been caused by grazing. A previous study [90] found higher densities of benthic macrofauna in the PLE in the summer period, which was related to temperature, but, in February 2018, the non-dominance of C. placentula, observed in the previous period, reflected a community that was more developed and, possibly, experiencing low herbivory. In the SM, abundance in most periods was different but similar in periods of similar temperature (April and May 2016, December 2016 and January 2017 and January and February 2017). The taxa with similar abundances were T. tabulata and C. placentula, which were dominant in some periods. With regard to composition, most periods were similar. The difference in composition between the periods of June and July 2016 may have been due to the different concentrations of nutrients (phosphate), whereas the periods of June and July 2016, October and November 2016 and November and December 2016 may have been distinct due to the reduction in salinity in November 2016.
Increases in TAN concentration and salinity may have altered the community in the SQ, as they coincided with periods of richness and diversity reduction (March, April and October 2016, February and May 2017 and February 2018), and some species were probably not tolerant. Since salinity and TAN concentration varied together, it was difficult to determine which of these factors was most important, but we found that they had no positive effect on the community. The high levels of variability in salinity and TAN concentration can be considered stress factors for the community, but some taxa, such as T. fasciculata and R. runrichiae, were tolerant to variations and were present in abundance under different salinity and TAN conditions. Periods of similar diversity, equitability and dominance (April and May 2016, July and August 2016, November and December 2016 and December 2016 and January 2017) had similar salinities. In July 2016, an increase in diversity occurred together with a reduction in salinity to zero, which may explain the significant difference found in relation to the previous period (June). The observation of differences between the periods in both abundance and composition (April and May 2016, May and June 2016, June and July 2016, September and October 2016, February and May 2017 and May 2017 and February 2018) showed that epiphytic community taxa are constantly dynamic, possibly as a result of the variability of environmental conditions, such as salinity and nutrient availability.
According to the CCA results, the community attributes were significantly related to salinity variability (Figure 8). Freshwater taxa, such S. potamos, N. eutinensis, P. brevistriata, P. clavatum and R. runrichiae, showed higher abundances in the SQ. The negative relationship of S. potamos with salinity was observed by [91] in phytoplankton samples from Patos Lagoon and confirmed in our study. Some marine taxa had higher abundances in the SM (C. jonesiana and P. sulcata), and also in the SQ, during periods of higher salinity (N. obtusa). A greater distance from the estuarine mouth and high variability in salinity (from 0 up to 25), as observed at the SQ site, favor the development of abundant freshwater species, which developed mainly during winter and spring. With increased salinity (summer and autumn), freshwater diatom species were reduced in abundance. At high salinity, freshwater diatoms may not have the ability to produce the osmolarity necessary to generate the same turgor pressure as at low salinity [92]. However, some freshwater taxa negatively related to salinity were still present in lower abundances at intermediate salinities (17 and 19), which shows that they can tolerate salinity variability. As richness and diversity in the SQ were negatively related to salinity and TAN, and these factors vary together, it was difficult to distinguish the main influencing factor. Perhaps environmental fluctuations can lead to the coexistence of various species based on different responses to environmental gradients [66].
The results of the CCA revealed that part of the community variability was also related to nutrient concentrations (Figure 8). Some abundant taxa tolerated the high N and P concentrations found in the SM. Some of these taxa have already been recorded in environments with high nutrient loads, such as C. meneghiniana, N. cryptotenella [93], F. saprophila [94], N. microcephala [95], P. sulcata [96] and P. laevis [97]. Cocconeis placentula also showed tolerance to the highest concentrations of nutrients in the SM, being dominant in May 2017, the period with the highest concentration of phosphate and organic matter. The greater availability of nutrients and lower competition for light in the biofilm may have stimulated the growth of the taxon. In a study with epiphytic diatoms on Z. marina, a positive response from C. placentula to nitrate enrichment was found [98]. Its dominance in the SM may have been the result of a disruption of the community involving a reduction in the abundance of larger species, such as M. moniliformis and P. leavis, which can overlay the innermost layers of the biofilm, where C. placentula is found. This taxon represents the pioneer stage of succession in R. maritima [29] but remained abundant throughout the study period in both study sites. According to [18], low-stature and prostrated taxa, such as C. placentula, are the dominant forms at low nutrient levels. Additionally, in the periods when this taxon was dominant (January, February and May 2017), there was a reduction in the diversity of the community. A previous study [99] also found a reduction in the diversity value when C. placentula was dominant. Some abundant taxa, such as M. pumila and T. fasciculata, were negatively related to nutrients (phosphate and nitrate + nitrite) and their highest abundances occurred in the SQ. Tabularia fasciculata showed a positive relationship with the increase in nutrients in an experimental study, regardless of the presence of grazers [100]; however, the taxon has already been recorded in abundance as an epiphytic in a preserved environment of the PLE [69]. Mastogloia pumila lives in saline environments, such as ponds, estuaries and salt lakes and salt marshes [69,70,101], and we did not find records of its presence as epiphytic in eutrophic environments. Suspended material was also important in the CCA, and higher amounts represented a reduction in water transparency, confirmed by the negative relation found in the SQ. Diatoms can adapt to low light levels and are able to survive in dark estuaries [102]. Some abundant SQ taxa, such as Cyclotella sp.1, S. guenter-grassi, P. brevistriata, S. potamos and T. persuadens, which have positive relations to suspended material, showed that they are also able to develop in higher turbidity in the water column.
5. Conclusions
This study presents, for the first time, a detailed analysis of the spatial and temporal variability of the epiphytic diatom community in Ruppia maritima meadows in Brazil. The meadows of the Patos Lagoon estuary sustain abundant and diverse epiphytic assemblages of diatoms, which are important primary producers and food sources for local economic species, such as invertebrates (shrimp) and small-sized fish (such as juveniles of the Mugilidae family). The distinction between the communities in the impacted and non-impacted sites showed the influence of the anthropogenic nutrient load on epiphytic diatoms, which are less diverse under environmental impacts. The temporal variability of the community structure was influenced by abiotic factors, such as salinity and temperature. The present study contributes to the knowledge about benthic diatoms, one of the most abundant and important groups of epiphytic organisms. Reductions in seagrass meadows, as observed during recent decades, may decrease the complexity of benthic habitats, which is likely to change the abundance and diversity of epiphytic diatoms and their ecological functions, and these are still poorly understood. In addition to studies on other epiphytic groups, future directions should integrate studies on the effect of nutrient increase and grazer pressure on the abundance and diversity of epiphytic algae and the consequences for seagrass abundance.
Supplementary Materials
The following supporting information can be downloaded at: https://www.mdpi.com/article/10.3390/d14100787/s1, Table S1. Complete list of epiphytic diatoms found on Ruppia maritima meadows of Patos Lagoon Estuary between November 2015 and February 2018, registered montly in two studied sites: Saco da Quitéria (SQ) and Saco da Mangueira (SM). The relative abundance (%) of each taxa is indicated for each month. Abundant taxa (•).
Author Contributions
Conceptualization, M.C. and V.C.d.R.; methodology, V.C.d.R.; software, V.C.d.R.; validation, V.C.d.R. and M.C.; formal analysis, V.C.d.R.; investigation, V.C.d.R.; resources, M.C.; data curation, V.C.d.R.; writing—original draft preparation, V.C.d.R. and M.C.; writing—review and editing, V.C.d.R. and M.C.; visualization, V.C.d.R. and M.C.; supervision, M.C.; project administration, M.C.; funding acquisition, M.C. All authors have read and agreed to the published version of the manuscript.
Funding
This research was funded by: Conselho Nacional de Desenvolvimento Científico e Tecnológico (CNPQ), Process number: 141126/2015-9; Coordenação de Aperfeiçoamento de Pessoal de Nível Superior (CAPES), Process number: 88881.189342/2018-01 and Rede Clima—Ministério da Ciência, Tecnologia, Inovações e Comunicações (MCTIC), Process number: 381704/2019-0.
Institutional Review Board Statement
Not applicable.
Informed Consent Statement
Not applicable.
Data Availability Statement
The data used in this study are available in the article.
Acknowledgments
The authors would like to thank the boatmen for help in collecting samples, the Institute of Biology at FURG for the use of microscopes, the Center of Ecology at the University Federal do Rio Grande do Sul (CENECO-UFRGS) for analysis of the water samples and the Laboratory of Phytoplankton and Marine Microorganisms (LABFITO) and the Project PELD for providing the dissolved silicate concentration data.
Conflicts of Interest
The authors declare no conflict of interest.
References
- Michael, T.S.; Shin, H.W.; Hanna, R.; Spafford, D.C. A review of epiphyte community development: Surface interactions and settlement on seagrass. J. Environ. Biol. 2008, 29, 629–638. [Google Scholar] [PubMed]
- Brandt, L.A.; Koch, E.W. Periphyton as a UV-B filter on seagrass leaves: A result of different transmittance in the UV-B and PAR ranges. Aquat. Bot. 2003, 76, 317–327. [Google Scholar] [CrossRef]
- Aho, K.; Beck, E. Effects of epiphyte cover on seagrass growth rates in two tidal zones. Ecology 2011, 2011, 43–44. [Google Scholar]
- Kitting, C.L.; Fry, B.; Morgan, M.D. Detection of inconspicuous epiphytic alga supporting food webs in seagrass meadows. Oecologia 2011, 62, 145–149. [Google Scholar] [CrossRef] [PubMed]
- Orth, R.J.; Van Montfrans, J. Epiphyte-seagrass relationships with an emphasis on the role of micrograzing: A review. Aquat. Bot. 1984, 18, 43–69. [Google Scholar] [CrossRef]
- Connolly, R.M.; Hindell, J.S.; Gorman, D. Seagrass and epiphytic algae support nutrition of a fisheries species, Sillago schomburgkii, in adjacent intertidal habitats. Mar. Ecol. Prog. Ser. 2005, 286, 69–79. [Google Scholar]
- Moncreiff, C.A.; Sullivan, M.J.; Daehnick, A.E. Primary production dymanics in seagrass beds of Mississippi Sound: The contributions of seagrass, epiphytic algae, sand microflora, and phytoplankton. Mar. Ecol. Prog. Ser. 1992, 87, 161–171. [Google Scholar] [CrossRef]
- Kennedy, H.; Beggins, J.; Duarte, C.C.; Fourqurean, J.W.; Holmer, M.; Marbà, N.; Middelburg, J.J. Seagrass sediments as a global carbon sink: Isotopic constraints. Glob. Biogeochem. Cycles 2010, 24, GB4026. [Google Scholar] [CrossRef]
- Duffy, J.E. Biodiversity and the functioning of seagrass ecosystems. Mar. Ecol. Prog. Ser. 2006, 311, 233–250. [Google Scholar] [CrossRef]
- Harlin, M.M. Transfer of products between epiphytic marine algae and host plants. J. Phycol. 1973, 9, 243–248. [Google Scholar]
- Licursi, M.; Gómez, N.; Donadelli, J. Ecological optima and tolerances of coastal benthic diatoms in the freshwater-mixohaline zone of the Río da Plata estuary. Mar. Ecol. Prog. Ser. 2010, 418, 105–117. [Google Scholar] [CrossRef]
- Orth, R.J.; Carruthers, T.J.B.; Dennison, W.C.; Duarte, C.M.; Fourqurean, J.W.; Heck, K.L.; Hughes, A.R.; Kendrick, G.A.; Kenworthy, W.J.; Olyarnik, S.; et al. A Global Crisis for Seagrass Ecosystems. BioScience 2006, 56, 987–996. [Google Scholar] [CrossRef]
- Copertino, S.M.; Creed, J.C.; Lanari, M.O.; Magalhães, K.; Barros, K.; Lana, P.C.; Sordo, L.; Horta, P.A. Seagrass and Submerged Aquatic vegetation (VAS) Habitats of the Coast of Brazil: State of knowledge, conservation and main threats. Braz. J. Oceanogr. 2016, 62, 53–80. [Google Scholar] [CrossRef]
- Frankovich, T.A.; Armitage, A.R.; Wachnicka, A.H.; Gaiser, E.E.; Fourqurean, J.W. Nutrient effects on seagrass epiphyte community structure in Florida bay. J. Phycol. 2009, 45, 1010–1020. [Google Scholar] [CrossRef]
- Mc Intyre, H.L.; Geider, R.J.; Miller, D.C. Microphytobenthos: The Ecological Role of the “Secret Garden” of Unvegetated, Shallow-Water Marine Habitats. I. Distribution, Abundance and Primary Production. Estuaries 1996, 19, 186–201. [Google Scholar] [CrossRef]
- Trobajo, R.; Sullivan, M.J. Apllied diatom studies in estuaries and shallow coastal environments. In Applications for the Environmental and Earth Sciences; Smol, J.P., Stoermer, E.F., Eds.; Cambridge University Press: Cambridge, UK, 2010; pp. 309–323. [Google Scholar]
- Vos, P.C.; Boer, P.L.; Misdorp, R. Sediment stabilizations by benthic diatoms in intertidal sandy shoals; qualitative and quantitative observations. In Tide-influenced Sedimentary Environments and Facies; Boer, P.L., Gelder, A., Nio, S.D., Eds.; D.Reidel: Dordrecht, The Netherlands, 1988; pp. 511–526. [Google Scholar]
- Passy, S.I. Diatom ecological guilds display distinct and predictable behavior along nutrient and disturbance gradients in running waters. Aquat. Bot. 2007, 86, 171–178. [Google Scholar] [CrossRef]
- Lange, K.; Liess, A.; Piggott, J.J.; Townsend, C.R.; Matthaei, C.D. Light, nutrients and grazing Interact to determine stream diatom community composition and functional group structure. Fresh. Biol. 2011, 56, 264–278. [Google Scholar] [CrossRef]
- Pan, J.; Cuadrado, D.G.; Bournod, C.N. Diatom-driven recolonization of microbial mat-dominated siliciclastic tidal flat sediments. FEMS Microbiol. Ecol. 2017, 93, fix111. [Google Scholar] [CrossRef]
- Sterrenburg, F.A.S.; Erftemeijera, P.L.A.; Nienhuis, P.H. Diatoms as Epiphytes on Seagrasses in South Sulawesi (Indonesia) Comparison with Growth on Inert Substrata. Bot. Mar. 1995, 38, 1–7. [Google Scholar] [CrossRef]
- Frankovich, T.A.; Gaiser, E.E.; Zienan, J.C.; Wachninka, A.H. Spatial and temporal distributions of epiphytic diatoms growing on Thalassia testudinum Banks ex König: Relationship to water quality. Hydrobiologia 2006, 569, 259–271. [Google Scholar] [CrossRef]
- Stanca, E.; Parsons, M.L. Examining the dynamic nature of epiphytic microalgae in the Florida Keys: What factors influence community composition? J. Exp. Mar. Biol. Ecol. 2021, 538, 151538. [Google Scholar] [CrossRef]
- Majewska, R.; Zgrundo, A.; Lemke, P.; De Stefano, M. Benthic diatoms of the Vistula River estuary (Northern Poland): Seasonality, substrata preferences, and the influence of water chemistry. Phycol. Res. 2012, 60, 1–19. [Google Scholar] [CrossRef]
- Snoeijs, P. Distribution of epiphytic diatom species composition, diversity and biomass on different macroalgal hosts along seasonal and salinity gradients in the Baltic Sea. Diatom Res. 1994, 9, 189–211. [Google Scholar] [CrossRef]
- Snoeijs, P. Effects of salinity on epiphytic diatom communities on Pilayella litoralis (Phaeophyceae) in the Baltic Sea. Ecoscience 1995, 2, 382–394. [Google Scholar] [CrossRef]
- Pedrini, A.G.; Silveira, I.C.A. Composição taxonômica e estimativa da biomassa das macroalgas epífitas em Ruppia maritima L. na Lagoa de Marapendi, Rio de Janeiro, RJ, Brasil. Atas Soc. Bot. Bras. 1985, 3, 45–60. [Google Scholar]
- Pacobahyba, L.D.; Eskinazi-Leça, E.; Silva-Cunha, M.G.G. Diatomáceas (Bacillariophyceae) epífitas na fanerógama marinha Halodule wrightii Aschers coletada no ambiente costeiro de Itamaracá-PE. Trop. Oceanogr. 1993, 22, 39–64. [Google Scholar]
- Ferreira, S.; Seeliger, U. The colonization Process of algal epiphytes on Ruppia maritma L. Bot. Mar. 1985, 28, 245–249. [Google Scholar] [CrossRef]
- Odebrecht, C.; Secchi, E.R.; Abreu, P.C.A.; Muelbert, J.H.; Uiblein, F. Biota of the Patos Lagoon estuary and adjacent marine coast: Long-term changes induced by natural and human-related factors. Mar. Biol. Res. 2017, 13, 3–8. [Google Scholar] [CrossRef]
- Baumgarten, M.G.Z.; Niencheski, L.F.; Martins, B.A. Saco do Justino (RS-Brasil): Amônio e Fosfato na coluna d’água e na coluna intersticial de uma enseada não contaminada. Atlântica 2005, 27, 113–129. [Google Scholar]
- Baumgarten, M.G.Z.; Niencheski, L.F.H. A coluna sedimentar como reservatório e fonte de nutrientes em enseadas estuarinas. Trop. Oceanogr. 2010, 38, 88–104. [Google Scholar] [CrossRef]
- Copertino, M.; Seeliger, U. Habitas de Ruppia maritima e de macroalgas. In O estuário da Lagoa dos Patos: Um século de transformações; Seeliger, U.C., Odebrecht, C., Castello, J.P., Eds.; FURG: Rio Grande, Brazil, 2010; pp. 91–98. [Google Scholar]
- Belarmino, E.; Nóbrega, M.F.; Grimm, A.M.; Copertino, M.S.; Vieira, J.P.; Garcia, A.M. Long-term trends in the abundance of an estuarine fish and relationships with El Niño climatic impacts and seagrass meadows reduction. Estuar. Coast. Shelf Sci. 2021, 261, 107576. [Google Scholar] [CrossRef]
- Garcia, A.M.; Claudino, M.C.; Mont’Alverne, R.; Pereyra, P.E.R.; Copertino, M.; Vieira, J.P. Temporal variability in assimilation of basal food sources by an omnivorous fish at Patos Lagoon Estuary revealed by stable isotopes (2010–2014). Mar. Biol. Res. 2017, 13, 98–107. [Google Scholar] [CrossRef]
- Lanari, M.; Possamai, B.; Copertino, M.S.; Garcia, A.M. Seasonal and El Niño Southern Oscillation-driven variations in isotopic and elemental patterns among estuarine primary producers: Implications for ecological studies. Hydrobiologia 2021, 848, 593–611. [Google Scholar] [CrossRef]
- Odebrecht, C.; Bergesch, M.; Medeanic, S.; Abreu, P.C. As comunidades de microalgas. In O estuário da Lagoa dos Patos: Um século de transformações; Seeliger, U.C., Odebrecht, C., Castello, J.P., Eds.; FURG: Rio Grande, Brazil, 2010; pp. 51–63. [Google Scholar]
- Abreu, P.C.; Hartmann, C.; Odebrecht, C. Nutrient-rich saltwater and its influence on the phytoplankton of the patos lagoon estuary, Southern Brazil. Estuar. Coast. Shelf Sci. 1995, 40, 219–229. [Google Scholar] [CrossRef]
- Abreu, P.C.; Odebrecht, C.; Niencheski, L.F. Nutrientes dissolvidos. In O Estuário da Lagoa dos Patos: Um Século de Transformações; Seeliger, U.C., Odebrecht, C., Castello, J.P., Eds.; FURG: Rio Grande, Brazil, 2010; pp. 43–48. [Google Scholar]
- Sullivan, M.J. Structural characteristics of a diatom community epiphytic on Ruppia maritima. Hydrobiologia 1977, 53, 81–86. [Google Scholar] [CrossRef]
- Reyes-Velasquez, G. Studies on the diatom flora living on Thalassia testudinum Konig in Biscayne Bay, Florida. Bull. Mar. Sci. 1970, 20, 105–134. [Google Scholar]
- Sullivan, M.J. Epiphytic diatoms of three seagrass species in Mississippi Sound. Bull. Mar. Sci. 1979, 29, 459–464. [Google Scholar]
- Dunton, K.H. Production ecology of Ruppia maritima L. s.1 and Halodule wrightii Aschers. In two subtropical estuaries. Exp. Mar. Biol. Ecol. 1990, 143, 147–164. [Google Scholar]
- Gordon, N.; Adams, J.B.; Bate, G.C. Epiphytes of the St. Lucia Estuary and their response to water level and salinity changes during a severe drought. Aquat. Bot. 2008, 88, 66–76. [Google Scholar]
- Chung, M.H.; Lee, K.S. Species Composition of the Epiphytic Diatoms on the Leaf Tissues of Three Zostera Species Distributed on the Southern Coast of Korea. Algae 2008, 23, 75–81. [Google Scholar] [CrossRef]
- Sullivan, M.J. Taxonomic notes on epiphytic diatoms of Mississippi Sound, U.S.A. Nova Hedwigia, Beih 1979, 64, 241–249. [Google Scholar]
- Dhib, A.; Brahim, M.B.; Turki, S.; Aleya, L. Contrasting key roles of Ruppia cirrhosa in a southern Mediterranean lagoon: Reservoir for both biodiversity and harmful species and indicator of lagoon health status. Mar. Poll. Bull. 2013, 76, 116–127. [Google Scholar] [CrossRef]
- Majewska, R.; D’Alelio, D.; De Stefano, M. Cocconeis Ehrenberg (Bacillariophyta), a genus dominating diatom communities associated with Posidonia oceanica Delile (monocotyledons) in the Mediterranean Sea. Aquat. Bot. 2014, 112, 48–56. [Google Scholar] [CrossRef]
- Mabrouk, L.; Asma, H.; Bradai, M.N. Temporal and bathymetric variation of epiphyte cover and leaf biomass in a Southern Posidonia oceanica (L.) meadow: The case of Mahdia coast, Tunisia. Mar. Ecol. 2016, 38, e12394. [Google Scholar] [CrossRef]
- Marques, W.C.; Moller, O.O. Variabilidade temporal em longo período da descarga fluvial e níveis de água da Lagoa dos Patos, Rio Grande do Sul, Brasil. Rev. Bras. Rec. Hidr. 2008, 13, 155–163. [Google Scholar] [CrossRef]
- Moller, O.; Fernandes, E. Hidrologia e hidrodinâmica. In O Estuário da Lagoa dos Patos: Um Século de Transformações; Seeliger, U., Odebrecht, C., Castello, J.P., Eds.; FURG: Rio Grande, Brazil, 2010; pp. 17–27. [Google Scholar]
- Simonsen, R. The diatom plankton of the Indian Ocean Expedition of R/V “Meteor” 1964–65. Meteor Forsch.-Ergeb. 1974, 19, 1–107. [Google Scholar]
- Lobo, E.; Leighton, G. Estruturas comunitarias de las fitocenosis planctonicas e los sistemas de desembocaduras de rios u esteros de la zona central de Chile. Rev. Biol. Mar. 1986, 22, 1–29. [Google Scholar]
- Baumgarten, M.G.Z.; Wallner-Kersanach, M.; Niencheski, L.F.H. Manual de Análises em Oceanografia Química; Editora da FURG: Rio Grande, Brazil, 2010; p. 174. [Google Scholar]
- Bernardino, A.F.; Barros, F.; Perez, L.F.; Netto, S.A.; Colling, L.A.; Pagliosa, P.R.; Lana, P.C.; Maia, R.C.; Christofoletti, R.A.; Filho, J.S.R.; et al. Monitoramento de ecossistemas bentônicos estuarinos. In Protocolos Para o Monitoramento de Habitats Bentônicos Costeiros—Rede de Monitoramento de Habitats Bentônicos Costeiros—ReBentos; Instituto Oceanográfico da Universidade de São Paulo-SP: São Paulo, Brasil, 2015; pp. 134–154. [Google Scholar]
- The Jamovi Project. Jamovi. (Version 1.6), Computer Software. 2021. Available online: http://www.jamovi.org (accessed on 1 November 2020).
- Hammer, O.; Harper, D.A.T.; Ryan, P.D. PAST: Paleontological Statistics Software Package for Education and Data Analysis. Paleontol. Eleyronica 2001, 4, 9. [Google Scholar]
- Anderson, M.J.; Gorley, R.N.; Clarke, K.R. PERMANOVA + for PRIMER: Guide to Software and Statistical Methods; PRIMER-E: Plymonth, UK, 2008; p. 214. [Google Scholar]
- Melo, A.S.; Hepp, L.U. Ferramentas estatísticas para análises de dados provenientes de biomonitoramento. Oecol. Bras. 2008, 12, 463–486. [Google Scholar] [CrossRef]
- Garcia, M.; Talgatti, D. Morfologia e distribuição de Catenula adhaerens Mereschkowsky (Bacillariophyceae) no sul do Brasil. Iheringia, Sér. Bot. 2011, 66, 99–108. [Google Scholar]
- Snoeijs, P. Studies in the Tabularia fasciculata complex. Diatom Res. 1992, 7, 313–344. [Google Scholar] [CrossRef]
- Round, F.E.; Crawford, R.M.; Mann, D.G. The Diatoms. Biology and Morphology of the Genera; Cambridge University Press: Cambridge, UK, 1990; p. 747. [Google Scholar]
- Sabanci, F.C. Species of Mastogloia (Bacillariophyceae)—New for the Aegean coast of Turkey. Mediterr. Mar. Sci. 2013, 14, 129–140. [Google Scholar] [CrossRef]
- Bergesch, M.; Odebrecht, C.; Abreu, P.C.O. Microalgas do estuário da Lagoa dos Patos: Interação entre o sedimento e a coluna de água. Oecol. Bras. 1995, 1, 273–289. [Google Scholar] [CrossRef]
- Torgan, L.C.; Raupp, S.V. Melosira moniliformis (O.F Müller) C. Agardth var. moniliformis (Bacillariophyta) do estuário da Laguna dos Patos, Rio Grande do Sul, Brasil. Iheringia, Sér. Bot. 2001, 56, 185–196. [Google Scholar]
- Yamamoto, M.; Chiba, T.; Tuji, A. Salinity responses of benthic diatoms inhabiting tidal flats. Diatom Res. 2017, 32, 243–250. [Google Scholar] [CrossRef]
- Lebreton, B.; Richard, P.; Redenac, G.; Borges, M.; Bréret, M.; Arnaud, C.; Blanchard, G.F. Are epiphytes a significant component of intertidal Zostera noltii beds? Aquat. Botany. 2009, 91, 82–90. [Google Scholar] [CrossRef] [Green Version]
- Bauer, D.E.; Gómez, N.; Hualde, P.R. Biofilms coating Schoenoplectus californicus as indicators of water quality in the Río de la Plata Estuary (Argentina). Environ. Minit. Assess. 2007, 133, 309–320. [Google Scholar] [CrossRef]
- Rosa, V.C.; Garcia, M. Diatomáceas (Bacillariophyceae) epífitas em Acrostichum danaeifolium (Pteridaceae) no Arroio Pseudônimo, Pelotas, Rio Grande do Sul, Brasil. Sitientibus Sér. Ciên. Biol. 2013, 13, 1–14. [Google Scholar] [CrossRef]
- Silva, J.G.; Torgan, L.C.; Cardoso, L.S. Diatomáceas (Bacillariophyceae) em marismas no sul do Brasil. Acta Bot. Bras. 2010, 24, 935–947. [Google Scholar] [CrossRef]
- Baumgarten, M.G.Z. A eutrofização das águas de uma enseada do estuário da Lagoa dos Patos (RS) protegida pela legislação ambiental. Fepam em Rev. 2010, 3, 34–42. [Google Scholar]
- Brasil. Conselho Nacional do Meio Ambiente, Resolução CONAMA n° 357 de 2005. Diário Oficial da União da República Federativa do Brasil, 18 de Março de 2005. Available online: http://www.icmbio.gov.br (accessed on 1 June 2020).
- Aminot, A.; Chaussepied, M. Manuel des Analyses Chimiques em Milieu Marin; CNEXO: Brest, France, 1993; p. 395. [Google Scholar]
- Marreto, R.N.; Baumgarten, M.G.Z.; Wallner-Kersanach, M. Trophic quality of Waters in the Patos Lagoon estuary: A comparison between its margins and the port channel located in Rio Grande, RS, Brazil. Acta Limnol. Bras. 2017, 29, e11. [Google Scholar] [CrossRef]
- Gough, S.B.; Gough, L.P. Comment on “primary production of algae growing on natural and artificial aquatic plants: A study of interactions between epiphytes and their substrate” (Cattaneo and Kalff). Limnol. Oceanogr. 1981, 26, 987–988. [Google Scholar] [CrossRef]
- Letáková, M.; Fránková, M.; Paulícková, A. Ecology and applications of freshwater epiphytic diatoms—Review. Cryptogam. Algol. 2018, 39, 3–22. [Google Scholar] [CrossRef]
- Liess, A.; Lange, K.; Schulz, F.; Piggott, J.J.; Matthaei, C.D.; Townsend, C.R. Light, nutrients and grazing Interact to determine diatom species richness via changes to productivity, nutrient state and grazer activity. J. Ecol. 2009, 97, 236–336. [Google Scholar] [CrossRef]
- Huang, D.; Chu, T.; Sheng, Q.; Chen, J.; Wu, J. Variable bottom-up and top-down effects on diversity of different prey assemblages in an estuarine saltmarsh. Mar. Ecol. Prog. Ser. 2013, 472, 15–25. [Google Scholar] [CrossRef]
- Virta, L.; Soininen, J.; Norkko, A. Biodiversity Loss Threatens the Current Functional Similarity of Beta Diversity in Benthic Diatom Communities. Microb. Ecol. 2021, 81, 293–303. [Google Scholar] [CrossRef]
- Eminson, D.F. A comparison of diatom epiphytes their diversity and density, attached to Myriophyllum spicatum L. in Norfolk dykes and broads. Br. Phycol. 1978, 13, 57–64. [Google Scholar] [CrossRef]
- Frankovich, T.A.; Fourqurean, J.W. Seagrass epiphyte loads along a nutrient availability gradient, Florida Bay, USA. Mar. Ecol. Prog. Ser. 1997, 159, 37–50. [Google Scholar] [CrossRef]
- López-Fuerte, O.F.; Siqueiros-Beltrones, D.A.; Hernandez-Almeida, O.U. Epiphytic diatoms of Thalassia testudinum (Hydrocharitaceae) from the Mexican Caribbean. Mar. Biodivers. Rec. 2013, 6, 1–11. [Google Scholar] [CrossRef]
- Mannino, A.M. Temporal and spatial variation of the algal community in a Southern Mediterranean shallow system. Cryptogam. Algol. 2010, 31, 255–272. [Google Scholar]
- Chen, C.P.; Gao, Y.H.; Lin, P. Geographical and seasonal patterns of epiphytic diatoms on a subtropical mangrove (Kandelia candel) in southern China. Ecol. Indic. 2010, 10, 143–147. [Google Scholar] [CrossRef]
- Rosa, V.C.; Garcia, M. Ecological guilds of epiphytic diatoms (Bacillariophyta) on Acrostichum danaeifolium Längst. & Fisch in a subtropical wetland in southern Brazil. Acta Limnol. Bras. (Online) 2015, 27, 311–321. [Google Scholar]
- Lepoint, G.; Havelange, S.; Gobert, S.; Bouquegneau, J.M. Fauna vs flora contribution to the leaf epiphytes biomass in a Posidonia oceanica seagrass bed (Revellata Bay, Corsica). Hydrobiologia 1999, 394, 63–67. [Google Scholar] [CrossRef]
- Ersanli, E.; Gonulol, A. Epiphytic diatoms on Cladophora rivularis (Linnaeus) Hoek (Chlorophyta) and Potamogeton pectinatus Linnaeus (Spermatophyta) in Lake Simenit (Samsun—Turkey). Diatom Res. 2007, 22, 27–44. [Google Scholar] [CrossRef]
- John, J. The distribution of epiphytic diatoms in the Swan River Estuary, Western Australia, in relation to hydrological factors. In Proceedings of the 10th International Diatom Symposium, Joensuu, Finland, 28 August–2 September 1988; pp. 335–344. [Google Scholar]
- Siqueiro-Beltrones, D.A.; Castrejon, E.S. Structure of Benthic Diatom Assemblages from a Mangrove Environment in a Mexican Subtropical Lagoon. Biotropica 1999, 31, 48–70. [Google Scholar]
- Rosa, L.C.; Bemvenuti, C.E. Temporal variability of the estuarine macrofauna of the Patos Lagoon, Brazil. Rev. Biol. Mar. Oceanogr. 2006, 41, 1–9. [Google Scholar] [CrossRef]
- Torgan, L.C.; Becker, V.; Santos, C.B. Skeletonema potamos (Bacillariophyta) in Patos Lagoon, Southern Brazil: Taxonomy and distribution. Rev. Peru. Biol. 2009, 16, 093–096. [Google Scholar]
- Roubeix, V.; Lancelot, C. Effect of salinity on growth, cell size and silification of an euryhaline freshwater diatom: Cyclotella meneghiniana Kütz. Transitional Waters Bull. 2008, 1, 31–38. [Google Scholar]
- Lobo, E.A.; Wetzel, C.E.; Ector, L.; Katoh, K.; Blanco, S.; Mayama, S. Response of epilithic diatom communities to environmental gradients in subtropical temperate Brazilian rivers. Limnetica 2010, 29, 323–340. [Google Scholar] [CrossRef]
- Zgrundo, A.; Lemke, P.; Pniewski, F.; Cox, E.J.; Latala, A. Morphological and molecular phylogenetic studies on Fistulifera saprophila. Diatom Res. 2013, 28, 431–443. [Google Scholar] [CrossRef]
- Khairy, H.M.; Hussein, N.R.; Faragallah, H.M.; Dorgham, M.M. The phytoplankton communities in two eutrophic areas on the Alexandria coast, Egipt. Rev. Biol. Mar. Oceanogr. 2014, 49, 267–277. [Google Scholar] [CrossRef]
- McQuoid, M.R.; Nordberg, K. The diatom Paralia sulcata as an environmental indicator species in coastal sediments. Estuar. Coast. Shelf Sci. 2003, 56, 339–354. [Google Scholar] [CrossRef]
- Gómez, N.; Licursi, M. The Pampean Diatom Index (IDP) for assessment of rivers and streams in Argentina. Aquat. Ecol. 2001, 35, 173–181. [Google Scholar] [CrossRef]
- Coleman, V.L.; Burkholder, J.M. Response of microalgal epiphyte communities to nitrate enrichment in a eelgrass (Zostera marina) meadow. J. Phycol. 1995, 31, 36–43. [Google Scholar] [CrossRef]
- Aykut, T.O.; Balkis-Ozdelice, N.; Durmus, T.; Solak, C.N. Evaluation of the Relationship between Epiphytic Diatoms and Water Quality Parameters in the Büyükçekmece Reservoir. Eur. J. Biol. 2021, 80, 54–68. [Google Scholar] [CrossRef]
- Hillebrand, H.; Worm, B.; Lotze, H.K. Marine microbenthic community structure regulated by nitrogen loading and grazing pressure. Mar. Ecol. Prog. Ser. 2000, 204, 27–38. [Google Scholar] [CrossRef]
- Gotoh, T. Diatoms of Brackish Water, Lake Shinjiand Lake Nakaumi, I. The Genus Mastogloia Thwaites. Acta Phytotax. Geobot. 1990, 41, 143–154. [Google Scholar]
- Lionard, M.; Muylaert, K.; Gansbeke, D.V.; Vyverman, W. Influence of changes in salinity and ligth intensity on growth of phytoplankton communities from the Schelde river and estuary (Belgium/The Netherlands). Hydrobiologia 2005, 540, 105–115. [Google Scholar] [CrossRef]
Figure 1.
Location of the study area: two meadows of Ruppia maritima in the Patos Lagoon estuary (PLE) in the state of Rio Grande do Sul, Brazil. SQ = Saco da Quitéria, SM = Saco da Mangueira. Based on Google Earth.
Figure 1.
Location of the study area: two meadows of Ruppia maritima in the Patos Lagoon estuary (PLE) in the state of Rio Grande do Sul, Brazil. SQ = Saco da Quitéria, SM = Saco da Mangueira. Based on Google Earth.

Figure 2.
Average fluvial discharge, precipitation (30 days prior to each collection) and wind speed (3 days prior to collection) during the study period (November 2015 to February 2018).
Figure 2.
Average fluvial discharge, precipitation (30 days prior to each collection) and wind speed (3 days prior to collection) during the study period (November 2015 to February 2018).

Figure 3.
Melosira moniliformis var. octogona (1–14); Pleurosira leavis (15); Aulacoseira granulata (16–19); Chaetoceros sp. (20); S. potamos (21–22); Skeletonema sp.2 (23–24); Skeletonema sp.3 (25–27); Paralia sulcata (28–32); Cyclotella sp.1 (33–39); Cyclotella striata (40); Cyclotella meneghiniana (41–43); Pseudopodosira echinus (44–47); Ambo tenuissimum (48–60); Pseudostaurosira brevistriata (61–66); P. clavatum (67–69); Pseudostaurosiropsis geocollegarum (70–74); Staurosirella aff. ovata (75–82); S. guenter-grassi (83–84); Fragilaria sp.1 (85–86). Scale bar = 10 μm.

Figure 4.
Tabularia tabulata (87–91); Cocconeis placentula (92–109); Fistulifera saprophila (110–117); Planothidium sp. (118–122); Navicula cryptotenella (123–129); Navicula cruxmeridionalis (130–133); Navicula sp.3 (134–139); Navicula sp.5 (140–142); Mastogloia pumila (143–146); Bacillaria paxillifera (147); Nitzschia filiformis (148); N. subcohaerens var. scotica (149); N. eutinensis (150–157); N. frustulum (158–164); N. microcephala (165–169); Tryblionella persuadens (170–175); Seminavis strigosa (176–179); Catenula adhaerens (180–185); Rhopalodia rumrichiae (186–188). Scale bar = 10 μm.

Figure 5.
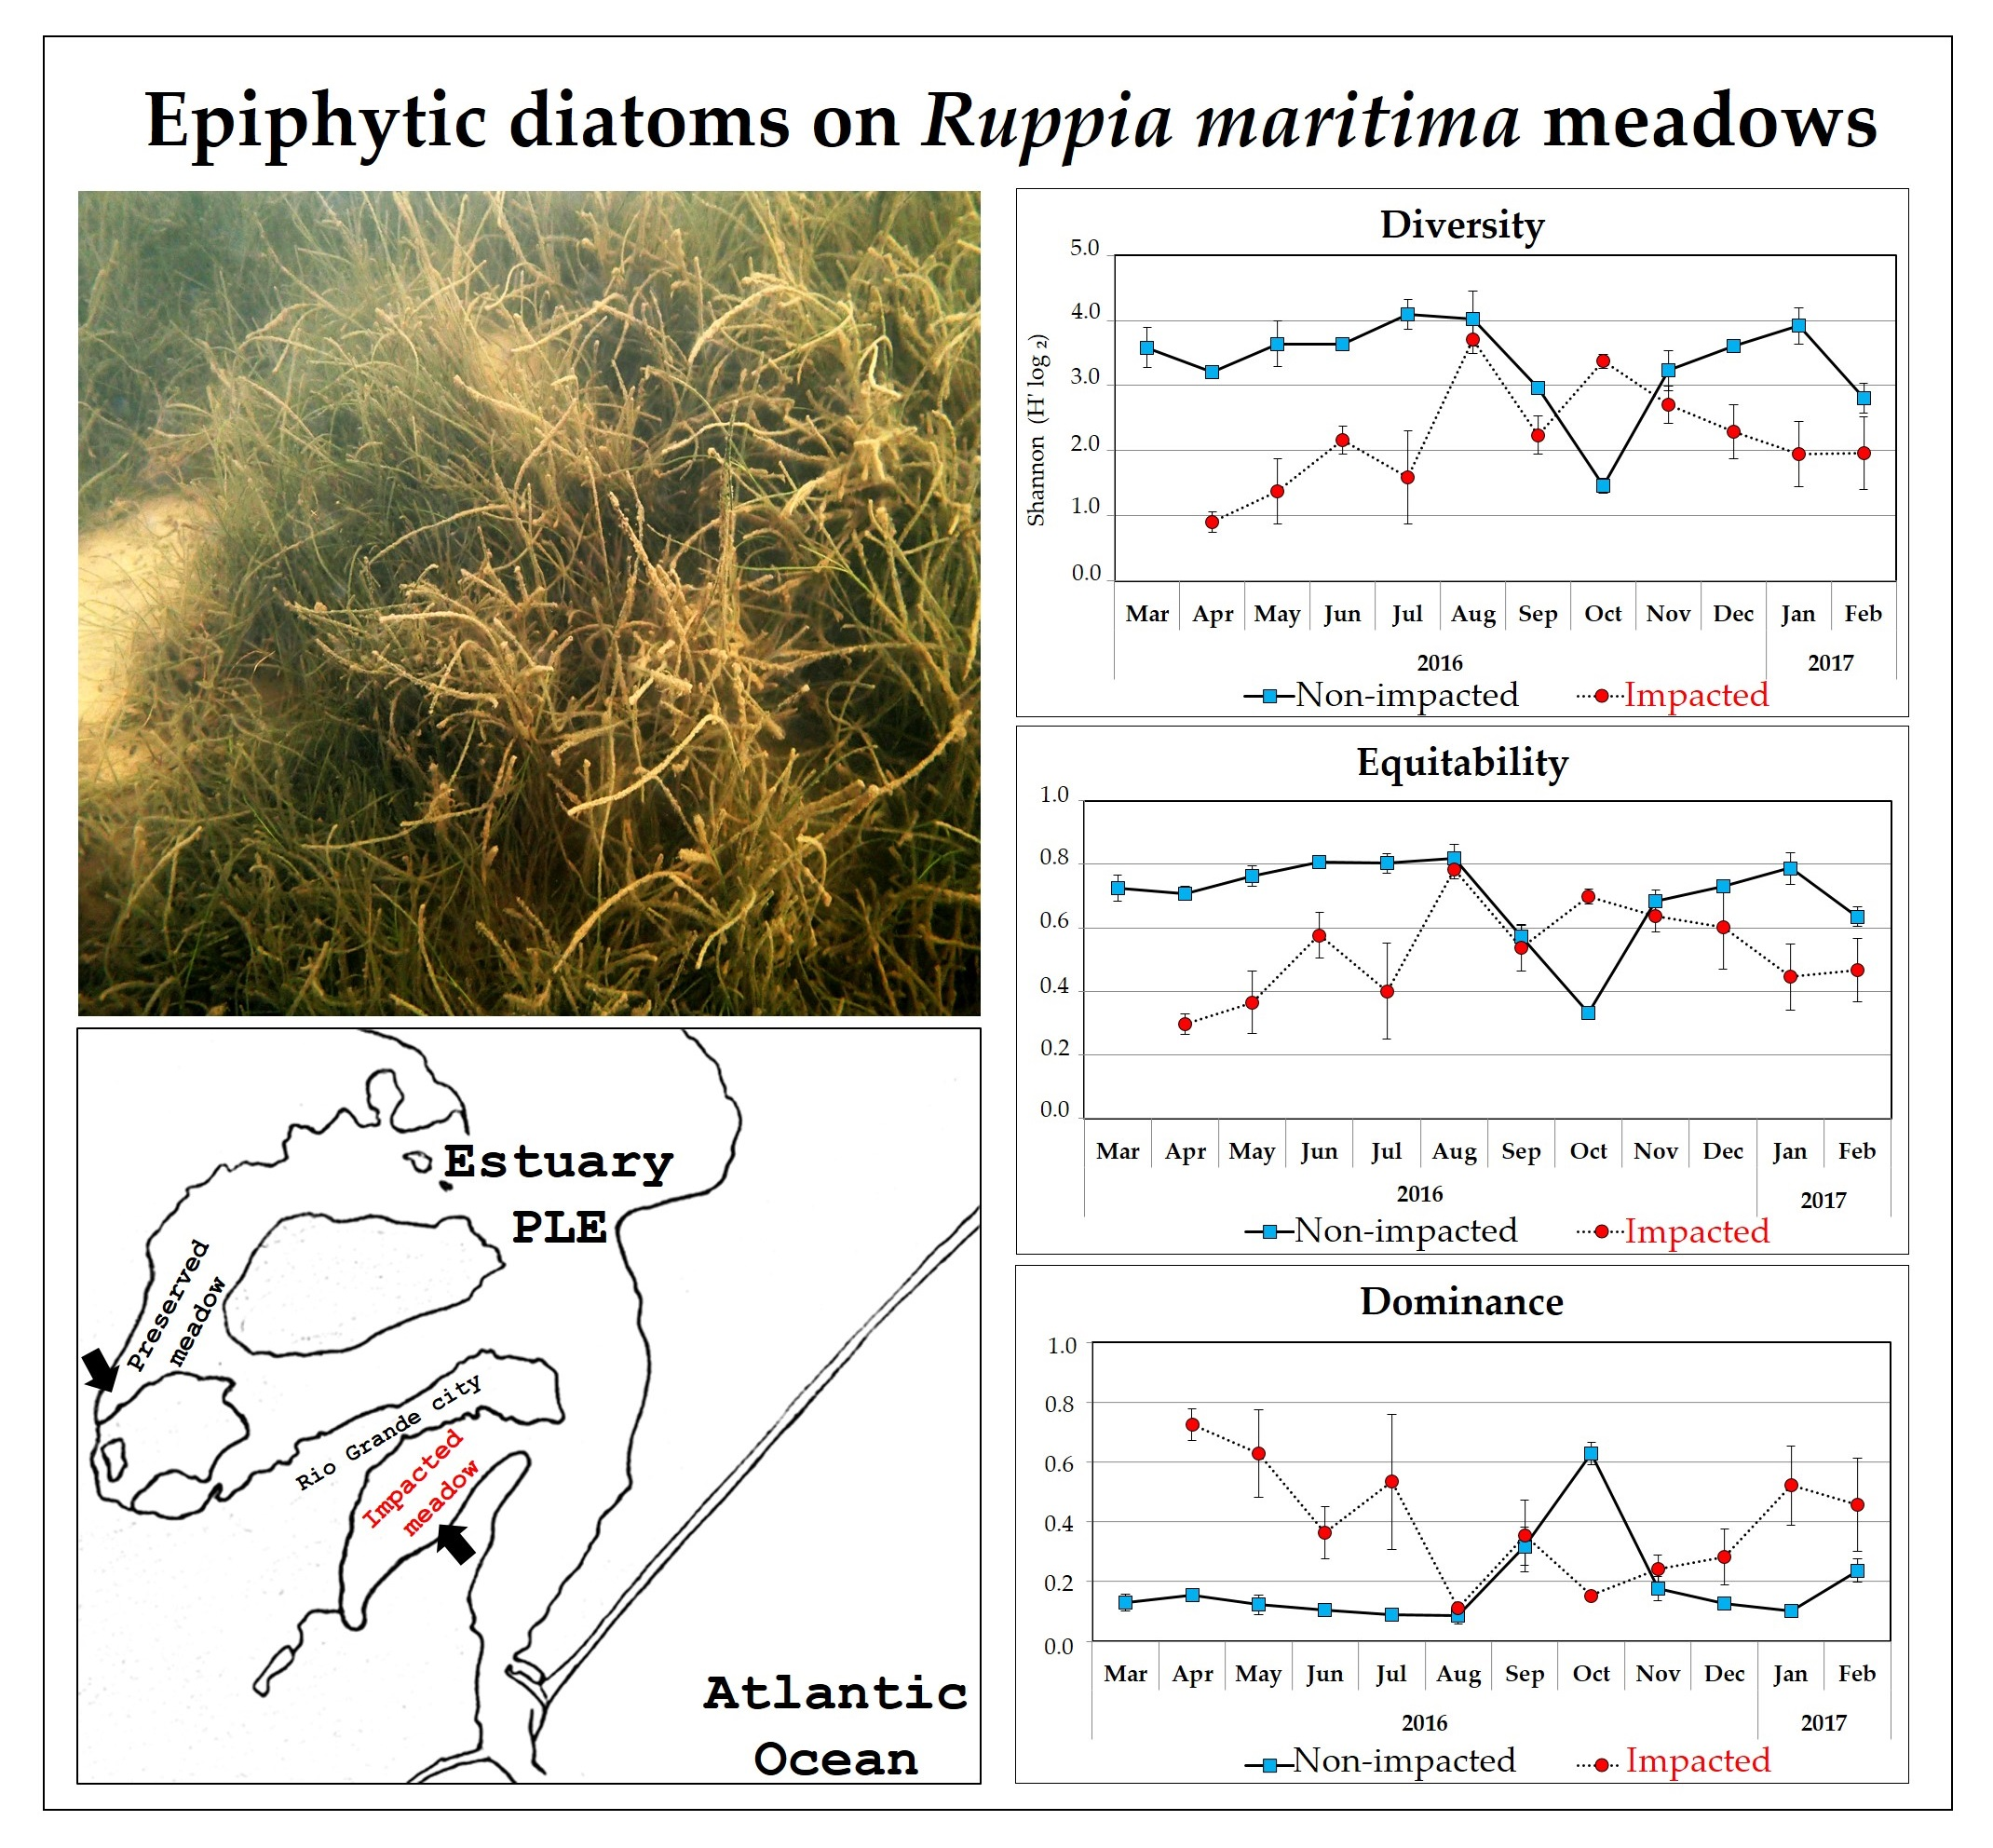
Distribution and proportions of the relative abundance (%) of epiphytic diatoms abundant in the non-impacted site (A) and impacted site (B). Data for diatoms that presented more than 10% abundance in at least one period.
Figure 5.
Distribution and proportions of the relative abundance (%) of epiphytic diatoms abundant in the non-impacted site (A) and impacted site (B). Data for diatoms that presented more than 10% abundance in at least one period.

Figure 6.
Monthly variability in richness (a), diversity (b), equitability (c) and dominance (d) for the epiphytic diatom community of the Saco da Quitéria (SQ) and Saco da Mangueira (SM) during the study period.
Figure 6.
Monthly variability in richness (a), diversity (b), equitability (c) and dominance (d) for the epiphytic diatom community of the Saco da Quitéria (SQ) and Saco da Mangueira (SM) during the study period.

Figure 7.
Results of non-metric multidimensional scaling (NMDS) analysis of samples from both sites during the study period. (A) abundance and (B) composition (presence and absence). Matrix composed of 80 sp. in both analyses. Q = Saco da Quitéria; M = Saco da Mangueira.
Figure 7.
Results of non-metric multidimensional scaling (NMDS) analysis of samples from both sites during the study period. (A) abundance and (B) composition (presence and absence). Matrix composed of 80 sp. in both analyses. Q = Saco da Quitéria; M = Saco da Mangueira.

Figure 8.
Canonical correspondence analysis (CCA) of the epiphytic diatom community in relation to environmental variables across the entire study period (November 2015 to February 2018) at both sites (Saco da Quitéria and Saco da Mangueira). Taxa with a frequency greater than 5%. Transformed data log (x + 1).


Table 1.
Values of environmental variables (temperature (°C), salinity (‰), depth, transparency (m), total suspended solids, phosphate, total ammoniacal nitrogen (TAN), nitrate + nitrite (mg L−1) and organic matter in the sediment (%)) during the study period (November 2015 to February 2018). SQ = Saco da Quitéria, SM = Saco da Mangueira.
| Variables/Periods and Sites | Temperature | Salinity | Depth | Transparency (Secchi Disk) | Total Suspended Solids | Phosphate | Nitrogen (TAN) | Nitrate + Nitrite | Organic Matter (Sediment) | ||||||||||
|---|---|---|---|---|---|---|---|---|---|---|---|---|---|---|---|---|---|---|---|
| SQ | SM | SQ | SM | SQ | SM | SQ | SM | SQ | SM | SQ | SM | SQ | SM | SQ | SM | SQ | SM | ||
| 2015 | November | 24.20 | 20.40 | 0.20 | 1.18 | 0.65 | 0.43 | 0.42 | 0.13 | 7.33 | 74.00 | 0.02 | 0.08 | 0.36 | 0.67 | 0.68 | 2.12 | 0.48 | 0.74 |
| December | 21.70 | 26.50 | 1.60 | 6.80 | 0.55 | 0.63 | 0.38 | 0.20 | 32.00 | 42.83 | 0.01 | 0.03 | 0.50 | 1.28 | 0.54 | 0.39 | 0.70 | 0.50 | |
| 2016 | January | 27.60 | 24.80 | 0.12 | 6.61 | 0.99 | 0.53 | 0.35 | 0.23 | 23.33 | 68.93 | 0.02 | 0.05 | 0.07 | 0.27 | 0.32 | 0.39 | 0.73 | 0.33 |
| February | 28.50 | 27.00 | 0.00 | 6.00 | 0.28 | 0.58 | 0.28 | 0.58 | 20.67 | 16.00 | 0.01 | 0.04 | 0.70 | 2.78 | 0.73 | 0.49 | 0.54 | 0.67 | |
| March | 23.50 | 24.00 | 17.00 | 15.00 | 0.38 | 0.37 | 0.38 | 0.37 | 38.33 | 21.87 | 0.01 | 0.07 | 3.16 | 4.85 | 0.63 | 0.49 | 0.92 | 0.73 | |
| April | 13.00 | 11.00 | 19.00 | 8.00 | 0.53 | 0.55 | 0.53 | 0.55 | 19.33 | 20.93 | 0.02 | 0.06 | 4.01 | 4.79 | 0.60 | 1.31 | 0.83 | 0.90 | |
| May | 14.00 | 12.00 | 15.00 | 10.00 | 0.64 | 1.17 | 0.64 | 0.75 | 38.89 | 26.00 | 0.01 | 0.04 | 2.70 | 1.59 | 0.48 | 0.56 | 0.72 | 1.40 | |
| June | 13.00 | 12.00 | 5.00 | 5.00 | 0.65 | 0.61 | 0.65 | 0.49 | 29.33 | 66.67 | 0.01 | 0.07 | 0.71 | 1.69 | 0.60 | 0.61 | 1.45 | 1.12 | |
| July | 11.00 | 9.00 | 0.00 | 10.00 | 0.51 | 0.81 | 0.51 | 0.81 | 17.67 | 9.00 | 0.01 | 0.01 | 1.59 | 3.58 | 0.47 | 0.59 | 1.17 | 1.83 | |
| August | 16.00 | 14.00 | 1.00 | 6.00 | 0.52 | 0.77 | 0.25 | 0.77 | 40.00 | 24.00 | 0.01 | 0.05 | 0.71 | 2.66 | 0.68 | 0.68 | 0.78 | 0.93 | |
| September | 19.00 | 17.00 | 6.00 | 6.00 | 0.63 | 0.68 | 0.63 | 0.25 | 19.67 | 10.83 | 0.01 | 0.07 | 2.08 | 1.66 | 0.60 | 0.67 | 0.82 | 1.38 | |
| October | 19.00 | 20.00 | 9.00 | 10.00 | 0.86 | 0.89 | 0.32 | 0.34 | 30.00 | 10.00 | 0.01 | 0.06 | 2.54 | 3.74 | 0.56 | 0.61 | 0.79 | 1.34 | |
| November | 19.00 | 19.50 | 1.00 | 5.00 | 0.65 | 0.53 | 0.12 | 0.53 | 70.00 | 6.00 | 0.04 | 0.05 | 1.09 | 1.67 | 3.44 | 1.04 | 0.59 | 0.91 | |
| December | 22.50 | 22.50 | 0.00 | 11.00 | 0.80 | 0.76 | 0.12 | 0.52 | 98.00 | 16.22 | 0.02 | 0.06 | 0.55 | 2.62 | 1.15 | 0.81 | 0.47 | 0.89 | |
| 2017 | January | 25.50 | 24.00 | 5.00 | 8.00 | 0.58 | 0.74 | 0.58 | 0.72 | 15.33 | 29.67 | 0.01 | 0.04 | 2.24 | 2.13 | 0.90 | 0.68 | 0.56 | 1.35 |
| February | 22.00 | 22.00 | 9.00 | 10.00 | 0.64 | 0.86 | 0.64 | 0.86 | 5.60 | 8.40 | 0.01 | 0.05 | 3.54 | 3.79 | 0.78 | 0.68 | 0.90 | 1.45 | |
| March | ND | 19.50 | ND | 7.00 | ND | 0.97 | ND | 0.97 | ND | 23.33 | ND | 0.06 | ND | 3.15 | ND | 0.57 | ND | 1.18 | |
| April | ND | 18.50 | ND | 25.00 | ND | 0.81 | ND | 0.38 | ND | 25.33 | ND | 0.11 | ND | 2.05 | ND | 0.90 | ND | ND | |
| May | 15.00 | 15.50 | 18.00 | 20.00 | 0.55 | 0.70 | 0.55 | 0.70 | 20.67 | 10.27 | 0.01 | 0.07 | 5.00 | 5.30 | 0.65 | 0.69 | 1.05 | 1.99 | |
| June | 13.00 | 17.00 | 0.00 | 0.00 | 1.29 | 0.81 | 0.35 | 0.81 | 29.67 | 19.33 | 0.02 | 0.07 | 0.98 | 0.70 | 1.34 | 1.01 | ND | ND | |
| July | 17.20 | 16.50 | 0.00 | 0.00 | 0.80 | 0.80 | 0.20 | 0.36 | 71.67 | 49.67 | 0.03 | 0.11 | 0.83 | 0.93 | 1.91 | 1.51 | ND | ND | |
| August | 15.50 | 15.00 | 4.00 | 6.00 | 0.85 | 0.60 | 0.85 | 0.60 | 7.00 | 14.00 | 0.01 | 0.07 | 0.52 | 3.11 | 1.16 | 0.93 | 0.78 | 1.08 | |
| September | 17.50 | 17.50 | 0.00 | 5.00 | 0.79 | 0.86 | 0.32 | 0.52 | 18.00 | 28.00 | 0.07 | 0.11 | 1.03 | 2.26 | 1.65 | 1.44 | ND | ND | |
| October | 18.50 | 18.50 | 0.00 | 0.00 | 1.30 | 0.98 | 0.15 | 0.17 | 154.00 | 105.33 | 0.06 | 0.04 | 0.60 | 0.61 | 1.95 | 1.57 | ND | ND | |
| November | 21.00 | 19.80 | 17.00 | 20.00 | 0.91 | 0.99 | 0.91 | 0.55 | 15.67 | 23.67 | 0.02 | 0.06 | 2.75 | 2.72 | 1.17 | 1.00 | 0.51 | 0.81 | |
| December | 21.50 | 22.00 | 1.00 | 6.00 | 0.69 | 0.89 | 0.69 | 0.15 | 15.67 | 74.67 | 0.03 | 0.05 | 0.44 | 1.77 | 0.89 | 0.97 | ND | ND | |
| 2018 | January | 23.00 | 24.00 | 5.00 | 17.00 | 0.90 | ND | 0.90 | ND | 7.50 | 21.00 | 0.01 | 0.04 | 2.11 | 3.62 | 0.71 | 0.63 | ND | ND |
| February | 25.50 | 26.00 | 10.00 | 15.00 | 0.50 | 0.90 | 0.50 | 0.23 | 15.00 | 23.67 | 0.01 | 0.01 | 0.70 | 4.96 | 0.80 | 0.65 | 0.78 | 1.56 | |
| Test | Student’s t | Mann–Whitney | Student’s t | Student’s t | Mann–Whitney | Mann–Whitney | Mann–Whitney | Mann–Whitney | Mann–Whitney | ||||||||||
| p-value | 0.756 | 0.025 | 0.505 | 0.629 | 0.840 | <0.001 | 0.01 | 0.77 | 0.008 | ||||||||||
Table 2.
Summarized results from the PERMANOVAs. Spatial and temporal variation (monthly) in the abundance and composition of the epiphytic diatom community in R. maritima meadows (Saco da Quitéria = SQ, Saco da Mangueira = SM). The months are represented in abbreviated form. For the Monte Carlo test, a p value < 0.05 = significant difference.
| PERMANOVA Results | ||||||||
|---|---|---|---|---|---|---|---|---|
| Spatial Variation | Temporal Variation | |||||||
| Sites | Abundance | Composition | Monthly | Abundance | Composition | |||
| SQ × SM | p = 0.0001 | p = 0.0001 | p = 0.0001 | p = 0.0001 | ||||
| Comparisons (Monte Carlo test p-value) | Comparisons (Monte Carlo test p-value) | |||||||
| SQ × SM | April 2016 | 0.0010 | 0.0115 | SQ | SM | SQ | SM | |
| SQ × SM | May 2016 | 0.0084 | 0.0568 | April × May 2016 | 0.0155 | 0.1127 | 0.0485 | 0.2005 |
| SQ × SM | June 2016 | 0.0015 | 0.0049 | May × June 2016 | 0.0180 | 0.0326 | 0.0455 | 0.0999 |
| SQ × SM | July 2016 | 0.0052 | 0.0183 | June × July 2016 | 0.0181 | 0.0115 | 0.0168 | 0.0307 |
| SQ × SM | August 2016 | 0.0187 | 0.0216 | July × August 2016 | 0.0691 | 0.0131 | 0.0892 | 0.0904 |
| SQ × SM | September 2016 | 0.0061 | 0.0201 | August × September 2016 | 0.0228 | 0.0135 | 0.0529 | 0.1170 |
| SQ × SM | October 2016 | 0.0061 | 0.0076 | September × October 2016 | 0.0394 | 0.0216 | 0.0321 | 0.1540 |
| SQ × SM | November 2016 | 0.0104 | 0.0236 | October × November 2016 | 0.0243 | 0.0106 | 0.0625 | 0.0165 |
| SQ × SM | December 2016 | 0.0050 | 0.0128 | November × December 2016 | 0.0341 | 0.0412 | 0.1373 | 0.0281 |
| SQ × SM | January 2017 | 0.0400 | 0.0565 | December × January 2017 | 0.0523 | 0.1226 | 0.1529 | 0.1506 |
| SQ × SM | February 2017 | 0.0126 | 0.0446 | January × February 2017 | 0.0298 | 0.2053 | 0.0622 | 0.2385 |
| SQ × SM | May 2017 | 0.0078 | 0.0298 | February × May 2017 | 0.0039 | 0.1874 | 0.0127 | 0.6075 |
| SQ × SM | February 2018 | 0.0063 | 0.0105 | May × February 2018 | 0.0051 | 0.0196 | 0.0139 | 0.0735 |
Table 3.
SIMPER analysis with the three taxa that most contributed (%) to the dissimilarities between the impacted and non-impacted areas. AD = average dissimilarity.
Table 3.
SIMPER analysis with the three taxa that most contributed (%) to the dissimilarities between the impacted and non-impacted areas. AD = average dissimilarity.
| Month | Average Dissimilarity | Taxa and Contribution (%) | ||
|---|---|---|---|---|
| April 2016 | AD = 52.56 | T. fasciculata (12.51) | M. pumila (10.6) | R. rumrichiae (9.75) |
| May 2016 | AD = 48.57 | B. paxillifera (7.86) | T. fasciculata (7.39) | A. tenuissimus (6.69) |
| June 2016 | AD = 46.37 | N. eutinensis (10.28) | M. pumila (9.54) | P. brevistriata (8.74) |
| July 2016 | AD = 71.71 | B. paxillifera (6.17) | M. pumila (6.17) | T. fasciculata (5.41) |
| August 2016 | AD = 45.41 | R. rumrichiae (6.14) | N. cryptotenella (6.01) | M. pumila (5.9) |
| September 2016 | AD = 67.21 | P. laevis (8.26) | T. tabulata (6.91) | P. brevistriata (4.39) |
| October 2016 | AD = 61.63 | T. tabulata (8.81) | C. adhaerens (7.09) | P. sulcata (6.44) |
| November 2016 | AD = 61.15 | Skeletonema sp.2 (8.44) | P. laevis (6.04) | Navicula sp.3 (6.02) |
| December 2016 | AD = 66.15 | P. laevis (8.25) | P. brevistriata (7.9) | S. guenter-grassii (6.76) |
| January 2017 | AD = 52.80 | T. tabulata (8.52) | T. fasciculata (4.88) | P. brevistriata (4.5) |
| February 2017 | AD = 54.17 | C. placentula (11.85) | T. fasciculata (10.38) | T. tabulata (9.07) |
| May 2017 | AD = 70.73 | M. pumila (12.65) | T. tabulata (9.64) | C. placentula (9.36) |
| February 2018 | AD = 53.12 | N. microcephala (9.81) | P. laevis (5.44) | P. sulcata (5.39) |
Publisher’s Note: MDPI stays neutral with regard to jurisdictional claims in published maps and institutional affiliations. |
© 2022 by the authors. Licensee MDPI, Basel, Switzerland. This article is an open access article distributed under the terms and conditions of the Creative Commons Attribution (CC BY) license (https://creativecommons.org/licenses/by/4.0/).
Share and Cite
MDPI and ACS Style
da Rosa, V.C.; Copertino, M. Diversity and Variation of Epiphytic Diatoms on Ruppia maritima L., Related to Anthropogenic Impact in an Estuary in Southern Brazil. Diversity 2022, 14, 787. https://doi.org/10.3390/d14100787
AMA Style
da Rosa VC, Copertino M. Diversity and Variation of Epiphytic Diatoms on Ruppia maritima L., Related to Anthropogenic Impact in an Estuary in Southern Brazil. Diversity. 2022; 14(10):787. https://doi.org/10.3390/d14100787
Chicago/Turabian Styleda Rosa, Vanessa Corrêa, and Margareth Copertino. 2022. "Diversity and Variation of Epiphytic Diatoms on Ruppia maritima L., Related to Anthropogenic Impact in an Estuary in Southern Brazil" Diversity 14, no. 10: 787. https://doi.org/10.3390/d14100787
Note that from the first issue of 2016, this journal uses article numbers instead of page numbers. See further details here.