 Ge-Ran Hutang
 Yan Tong
 Xun-Ge Zhu1,2
 Li-Zhi Gao
- 1Germplasm Bank of Wild Species in Southwestern China, Kunming Institute of Botany, Chinese Academy of Sciences, Kunming, Yunnan, China
- 2University of Chinese Academy of Sciences, Beijing, China
- 3Engineering Research Center for Selecting and Breeding New Tropical Crop Varieties, Ministry of Education, College of Tropical Crops, Hainan University, Haikou, China
Background: Biologists have long debated the drivers of the genome size evolution and variation ever since Darwin. Assumptions for the adaptive or maladaptive consequences of the associations between genome sizes and environmental factors have been proposed, but the significance of these hypotheses remains controversial. Eragrostis is a large genus in the grass family and is often used as crop or forage during the dry seasons. The wide range and complex ploidy levels make Eragrostis an excellent model for investigating how the genome size variation and evolution is associated with environmental factors and how these changes can ben interpreted.
Methods: We reconstructed the Eragrostis phylogeny and estimated genome sizes through flow cytometric analyses. Phylogenetic comparative analyses were performed to explore how genome size variation and evolution is related to their climatic niches and geographical ranges. The genome size evolution and environmental factors were examined using different models to study the phylogenetic signal, mode and tempo throughout evolutionary history.
Results: Our results support the monophyly of Eragrostis. The genome sizes in Eragrostis ranged from ~0.66 pg to ~3.80 pg. We found that a moderate phylogenetic conservatism existed in terms of the genome sizes but was absent from environmental factors. In addition, phylogeny-based associations revealed close correlations between genome sizes and precipitation-related variables, indicating that the genome size variation mainly caused by polyploidization may have evolved as an adaptation to various environments in the genus Eragrostis.
Conclusion: This is the first study to take a global perspective on the genome size variation and evolution in the genus Eragrostis. Our results suggest that the adaptation and conservatism are manifested in the genome size variation, allowing the arid species of Eragrostis to spread the xeric area throughout the world.
Introduction
Genome size is a fundamental biological characteristic for the organism. Variation in genome size was thought to have “functional consequences” correlated with the environmental conditions and individual phenotypes (Knight et al., 2005; Moraes et al., 2022). Thus, the genome size variation is an essential parameter to understand the evolutionary models of the species. Genome sizes are also affected by environmental factors as well (Faizullah et al., 2021). The nuclear genome size varied among land plants with 12-fold in mosses to 2,342-fold in angiosperms (Leitch and Leitch, 2013), evolutionary and environmental implications behind this diversity are still largely unknown. Up to now, opinions on increasing or decreasing genome size could be divided into two types: (1) plants with small genomes adapted to all environmental conditions, while those with large genomes were limited in a narrow area and tended to be excluded from extreme habitats for the short growing season (Knight and Ackerly, 2002) and redundant noncoding DNA (Vinogradov, 2003; Knight et al., 2005; Pyšek et al., 2018); and (2) species with large genomes were also found in more seasonal or arid areas as they have chosen a mechanism of cell expansion rather than rapid division to cope with extreme environments (Grime and Mowforth, 1982). As Bennett (1987) indicated, large genomes have enabled plants to generate superior traits in adverse habitats. In addition, evolution is an efficient way to elucidate genome size variation with the “adaptive theory” or “junk DNA” theory (Petrov, 2001; Pellicer et al., 2018). To tackle the questions raised above, phylogenetic comparative methods (PCMs) are increasingly used in evolutionary biology to test evolutionary associations between genome sizes and environmental conditions and resolve the confusion over the consequences of additional DNA in genome size. Moreover, the evolutionary process of bioclimatic niches and geographical factors may reflect conservation, diversification, and adaptation in a phylogenetic context (Butler and King, 2004; Kozak and Wiens, 2010; Wiens et al., 2010). For example, studies on “phylogenetic niche conservatism” (PNC) (Wiens and Graham, 2005; Losos, 2008) have paid more attention to the variation of environmental factors. It is a potential explanation of the species adapted to new or changing environments (Ackerly, 2003). However, the ecological factors that determine evolutionary models leading to the genome size variation are yet to be fully elucidated.
Eragrostis Wolf, the largest genus comprising more than 350 species in the subfamily Chloridoideae (Poaceae) (Van den Borre and Watson, 1994), is widely distributed in diverse ecological environments. Eragrostis species often grow on sandy, clay, rocky slopes and gravel soils. The majority of Eragrostis species are common grasses without clear use, and only a few species are used as forage grasses. Eragrostis species can maintain high productivity even under arid or intensive grazing conditions, leading to some species deemed as “miracle grass” in the last century (Cox et al., 1988). Some Eragrostis species have been used for soil conservation and fodder crops in Africa, America and Australia (Zeid et al., 2011). In Africa, wild grains of some species were used as famine food by humans (Watt and Breyer-Brandwijk, 1962; Burkill, 1995). Cereal crops that can grow under various stresses with minimal agricultural inputs are essential (Assefa et al., 2017). Eragrostis tef (Zucc.) Trotter, commonly known as Teff, originated in Ethiopia, and fills this pivotal role due to nutritional merits and tolerance to harsh environments, becoming a healthy alternative food in the xeric areas (Alaunyte et al., 2012; Abraham, 2015; Cheng, 2018; McSteen and Kellogg, 2022). Due to the global climate changes, the desertification zone is expanding slowly, making it urgent to mine the untapped potential of plant species in drylands (Brown, 2012). Thus, this genus is well suited to study drought adaptation for its remarkable viability in dry habitats (Colom and Vazzana, 2001; Balsamo et al., 2006; Degu et al., 2008; Ginbot and Farrant, 2011; Buerdsell et al., 2022). Additionally, Eragrostis species have varied ploidy levels, which are recognized as a major driver of genomic variation. However, there are only three species in genus Eragrostis have been measured in previous studies. (http://data.kew.org/cvalues). Thus, the genus Eragrostis is a good model to test the genome size variation and evolution in a global context and to find the correlations between genome sizes and environmental factors.
The monophyletic nature of the genus Eragrostis has been controversial for years (Van den Borre and Watson, 1994; Ingram and Doyle, 2007; Ingram, 2010; Girma et al., 2018). Ingram and Doyle (2007) attributed this confusion to the large number of species in Eragrostis and its unclear phylogenetic relationship with closely related genera. However, some classifications in Eragrostis have been proposed. The genus was divided into several subgroups with various anatomical types (Ellis, 1977; Prendergast et al., 1986; Van den Borre and Watson, 1994; Ingram, 2010). Molecular phylogenetic analyses were recently performed based on plastid and nuclear data using limited samples of Eragrostis (Ingram and Doyle, 2004; Ingram and Doyle, 2007; Somaratne et al., 2019; Liu et al., 2021). Although Barrett et al. (2020) investigated 118 species of Eragrostidinae, they primarily put emphasis on the phylogeny of Eragrostis in Australia. Another contentious question in the phylogenetic relationship of Eragrostis is the presumed progenitors of E. tef (allotetraploid; 2n = 4x = 40). Although it has been long recognized that E. tef was originated from two diploid progenitors, the true progenitors of E. tef were still ambiguous (Jones et al., 1978; Doyle, 1999; Ingram and Doyle, 2003). Up to eighteen species have been reported as the presumed ancestors of E. tef (Girma et al., 2018). Among these presumed ancestors, E. pilosa has a close relationship with E. tef (Costanza et al., 1979; Ketema, 1991; Ayele et al., 1999; Ayele and Nguyen, 2000; Tefera et al., 2001; Ingram and Doyle, 2003). However, Girma et al. (2018) proposed that E. pilosa could be an intermediate progenitor, providing robust evidence for E. aethiopica, a diploid species (2n = 2x =20) (Bekele and Lester, 1981; Tavassoli, 1986), being the progenitor close to E. tef and E. pilosa. A well-resolved phylogenetic tree of this genus will greatly help to determine the diploid ancestor of E. tef.
In this study, we reconstructed the phylogeny of Eragrostis using plastid data and ITS regions based on 66 representative samples from the worldwide distributions. ITS region is often used to trace the origin and evolution of allopolyploids at low taxonomic level (Soltis et al., 2008), and plastid data can also be employed to determine the maternal parents of E. tef assuming their maternally inherited attribution in grasses (Mogensen, 1988). We further estimated genome sizes of Eragrostis 66 samples based on flow cytometric experiments, including previously identified taxa (E. spectabilis, E. minor and E. tef) for comparisons. We investigated genome size variation across clades, extending to the distributions, ranges and life styles. We tried to demonstrate the evolutionary models of genome sizes and environmental factors (such as geographical distributions and climatic niches) based on tempo, mode and phylogenetic signal in evolution in an attempt to select the best model through history. We evaluated the correlations between genome sizes and environmental factors in a phylogenetic context, which is capable of revealing environmental forces in shaping genome size variation. Finally, we reconstructed the ancestral states of climatic niche correlates to see environmental changes of Eragrostis species. Throughout the study, we reviewed the phylogeny and environmental conditions of each Eragrostis species, given the implications for the response of Eragrostis species to future climate changes.
Materials and Methods
Taxon sampling and DNA sequencing
Most Eragrostis species are native to Africa, Australia and America (Cufodontis, 1953; Costanza, 1978; Lazarides, 1997). Our samples not only covered the above-mentioned distribution, but also included those species from Europe and Asia. We summarized the information of 66 individuals representing 47 species (E. cylindriflora with 3 samples; E. tef with 18 cultivars) in this study (see Tables 1, S1). Seeds were germinated in pots filled with sterile soil, and placed in a naturally lit glasshouse (Kunming Institute of Botany, Chinese Academy of Science). In order to evaluate the data accuracy, we planted the samples in 2017 and 2020, respectively. Total genomic DNA was isolated from fresh leaves following a modified cetyltrimethylammonium bromide (CTAB) protocol (Li et al., 2013). One nuclear locus (ITS) and three chloroplast regions (rbcL, matK, trnL-trnF) were employed for DNA sequencing. The primers used for polymerase chain reactions (PCR) and sequencing are presented in Table S2. The PCR experiments were performed in a 27 μl volume containing 13.5 μl of 2 × Taq polymerase mix (Tiangen Biotech), 1.5 μl of each primer, 1.5 μl of DNA template and 9 μl sterile deionized water. The amplification parameters for all regions according to the following protocol: 94°C for 5 min, followed by 35 cycles of 94°C for 1min, 45°C for 1min, 72°C for 1 min 30 s, and a final 10 min extension at 72°C. The PCR products were cleaned using polyethylene glycol (PEG) precipitation protocol (Wen et al., 2007). DNA sequencing was performed with BigDye Terminator Cycle Sequencing kit (Applied Biosystems, Foster City, CA, USA) and ABI PRISM 3730 genetic analyzer (ABI). The program Sequencer 4.8 (Gene Code Corporation) was employed to assemble the generated sequences.
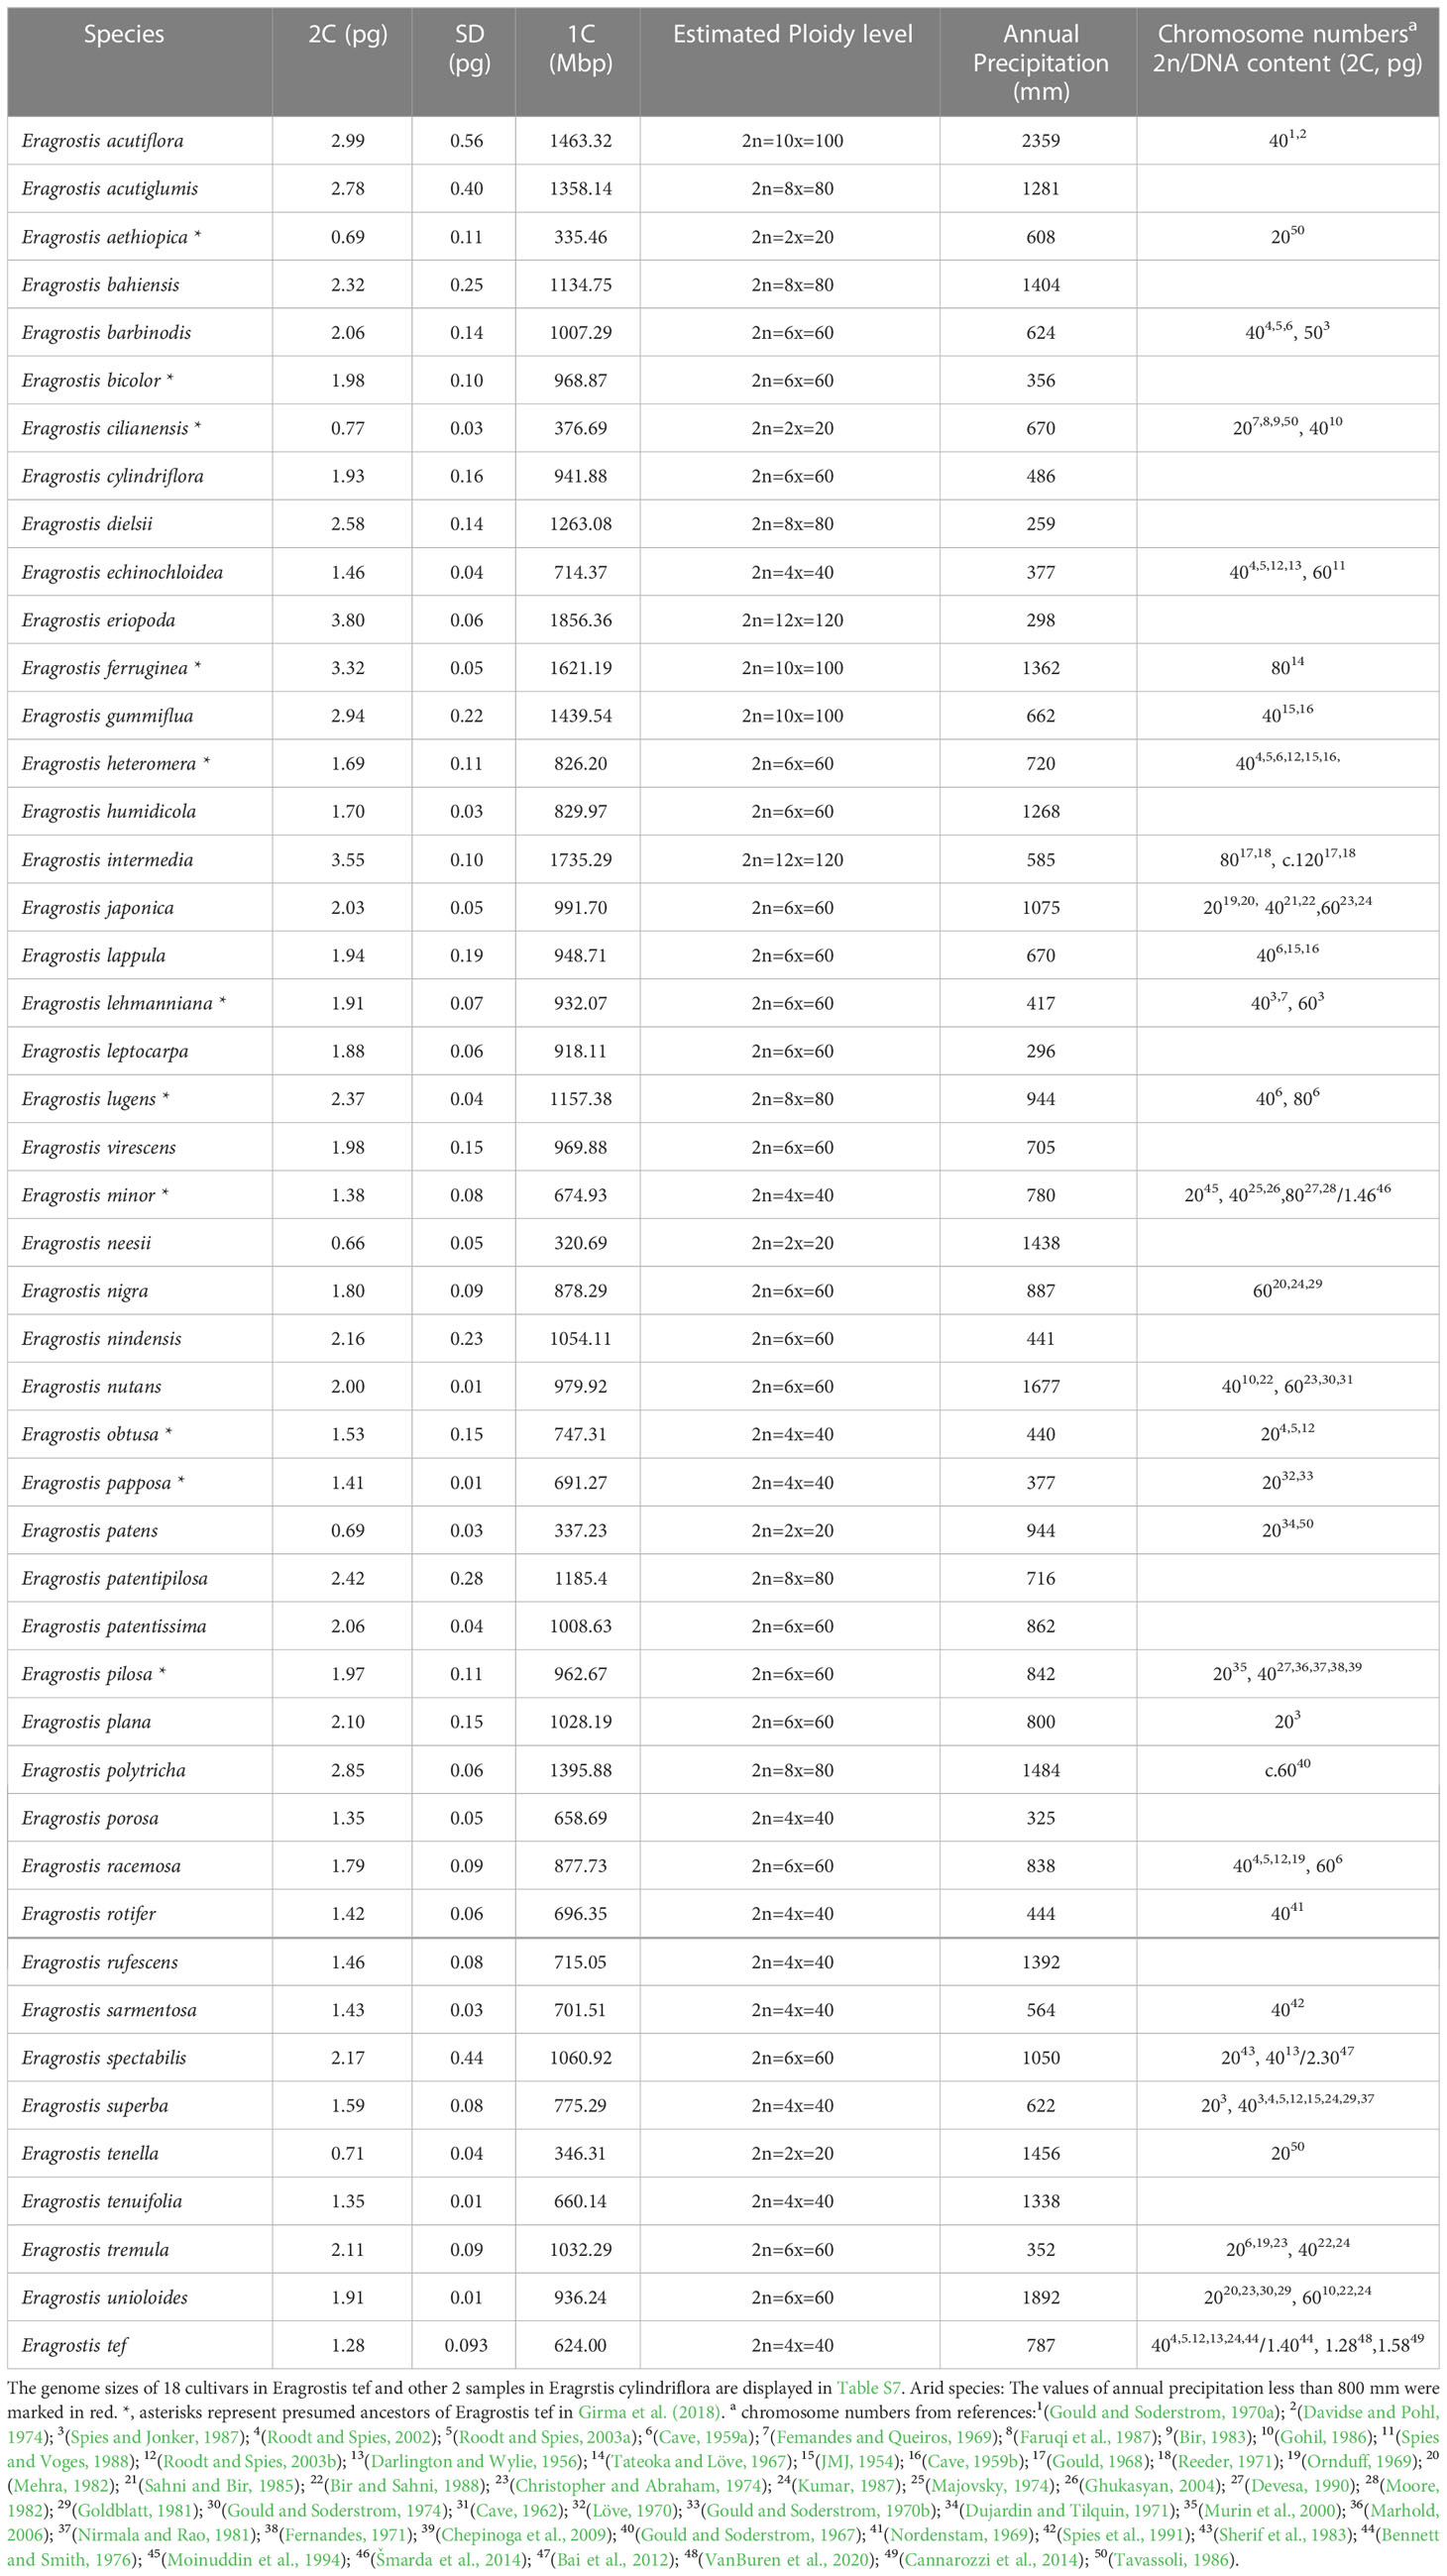
Table 1 Summary of Eragrostis species included in this study.
Phylogenetic analyses
A total of 66 individuals of Eragrostis and the four outgroup species were included in our phylogenetic analyses. Based on the results of Peterson et al. (2010), two species from Cotteinae (Cottea pappophoroides, Enneapogon desvauxii) and two species from Uniolinae (Tetrachne dregei, Uniola paniculata) were downloaded from NCBI to act as outgroups (Table S3). Sequences of ITS, matK, trnL-trnF and rbcL regions were aligned and combined in MUSCLE software (version 3.8.31) (Edgar, 2004). All sequences have been deposited in National Genomics Data Center under BioProject number CRA007592. We used maximum likelihood (ML) and Bayesian analyses to infer phylogenetic relationships for both separated and combined data. All gaps were treated as missing data. The ML analyses being conducted using RAxML software with GTR + I + G4 model selected in Modeltest-ng (Darriba et al., 2020). The bootstrap values (BS) were estimated with 1,000 replicates for internal branch support. The BS values of 90-100 were a statistically significant occurrence, while 89-90 was interpreted as a moderate support (Peterson et al., 2010). Phylogenetic analyses were also performed using the Bayesian analyses in MrBayes version 3.2.7 on the XSEDE CIPRES platform (Ronquist et al., 2012). The best model for the Bayesian analyses was selected in jModeltest 2.1.4 (Darriba et al., 2012) of TIM + I + G with a gamma shape (G) of 0.704. Each Bayesian analysis was run for 10,000,000 generations. The analysis was run until the value of the standard deviation of split frequencies dropped below 0.01. The percentage of the sampled values discarded as burn-in was set at 25%, and then the remaining trees were used to construct the consensus tree. The posterior probabilities (PP) of 0.95-1.00 were considered as significant probabilities (Peterson et al., 2010). The plastid and ITS data sets were separately processed in DnaSP version 6.12.03 software (Rozas et al., 2017) for calculating the characteristics of sequences. The final consensus trees were uploaded to iTOL (http://itol.embl.de) for editing and visualization.
Genome size estimation
The prevalence of polyploids in the genus Eragrostis even exists within one species (Burson and Voigt, 1996), making it complicated to calculate the 1C DNA values, and thus, we interpreted 2C DNA content as genome size in this study. We measured genome sizes of all samples using two reference standards: Oryza sativa L. ssp. japonica cv. Nipponbare (389 Mbp) (Sasaki, 2005) and Solanum lycopersicum (900 Mbp) (Tomato Genome Consortium, 2012). The coefficient of variation (CV) less than 5% was considered as a reliable estimate. Nuclei suspensions were improved according to two-step procedure using Otto I and Otto II buffers (Otto, 1990). 5 cm2 pieces of young leaves of the samples and the standards were chopped separately, using a scalpel in a petri dish containing 1ml of Otto I buffer (1 M citric acid and 0.5% Tween 20) on ice. Samples were incubated at room temperature for 60 min and shaken lightly at the same time. Suspensions were filtered through a 50-μm nylon filter and nuclei were stained with 1 mL Otto II buffer (0.4 M Na2HPO4.12 H20) supplemented with PI (final concentration 50 ug/ml) and RNAase. Three to five replicates were analyzed for every sample, and for each replicate, 20,000 nuclei were measured using a BD FACSCalibur (USA) flow cytometer, which had equipped with a 15 mW, 488 nm argon ion laser. The results of flow cytometry were further analyzed by using the Cellquest software (BD Biosciences). To ensure reliability and repeatability of the obtained results, 3-13 replicates of genome size estimates were performed per species (Table S4). The mean genome size per species was used in subsequent data analyses (Tables 1, S1).
Models of trait evolution
Phylogenetic signal, evolutionary mode and tempo values of the genome sizes and environmental traits across the phylogeny were investigated in this study. Pagel’s lambda (λ), kappa (κ) and delta (δ) were estimated using the geiger (Harmon et al., 2008) and phytools (Revell, 2012) packages in R version 4.1.0 (Team, 2013). Pagel’s parameters involving different branch length transformations were used for exploring evolutionary trend of a given trait. The parameter λ indicates different effects of phylogenetic signals of biological traits, κ is related to gradualism or punctuated evolution models, and δ represents evolutionary tempo through the history (Pagel, 1997; Pagel, 1999). We selected λ parameter to test phylogenetic signal due to its better performance than the other indices (Münkemüller et al., 2012).
Brownian motion (BM) and Ornstein-Uhlenbeck (OU) models were popular for the trait evolution (Blomberg et al., 2020). We compared the fitness of six models, including BM, OU, No-signal (λ forced = 0) and Pagel’s three models (λ, δ and κ), through ML estimations in the R package geiger (Harmon et al., 2008). The No-signal model forced the λ value to zero, namely, the hypothesis of no phylogenetic signal during the evolution of traits. We used log likelihood and Akaike information criterion (AIC) (Akaike, 1974; Hurvich and Tsai, 1989) values as the metrics for our model performance. Likelihood ratio tests (LRTs) (Vuong, 1989) were used to select the best fitting model for each variable. BayesTraits version 3.0.5 (Pagel and Meade, 2004) was used to verify the ML results of model testing and evaluate whether our traits were suitable for random-walk (model A) or directional model (model B). Bayesian MCMC approach was used to calculate the expected and observed values in different models. In a MCMC analysis, we estimated the log marginal likelihood using 100 stones and 10,000 iterations per stone. We selected the best fitting model depending on Log Bayes Factors (Log BF), which were calculated from the log marginal likelihood values between two models. In order to trace the evolutionary histories of climatic niches in the genus Eragrostis, we reconstructed the ancestral states of selected climatic niches using the Mesquite 3.6 (Maddison and Maddison, 2019) with parsimony method.
Environmental data
The occurrence of each of the Eragrostis species under study were extracted from the Global Biodiversity Information Facility (GBIF, https://doi.org/10.15468/dl.y3uyqm). We filtered out erroneous data points (for example, points from the sea) using CoordinateCleaner package in R. The resulting distribution data set contained 99,334 localities, with records larger than 150 data points per species. Only two species (E. humidicola and E. acutiglumis) had narrow range, which were represented by few localities fewer than 50 records. We calculated the medium values of latitudes, longitudes and elevations recorded in the GBIF. These data were then used to calculate the latitudinal and longitudinal ranges.
We obtained 19 bioclimatic variables from the WorldClim 2.1 climate database based on the filtered records (https://www.worldclim.org/data/worldclim21.html) (Fick and Hijmans, 2017). We chose the resolution of 5 mins according to the Du et al. (2017). The data matrix of these 19 bioclimatic niche variables was a summary of the medium value of several climatic dimensions in precipitation and temperature. In addition to climatic niches, we incorporated four climatic niche breadths (Liu et al., 2020) as following: WLNBT, the mean value of the difference between max temperature (warmest month) and min temperature (coldest month) for each locality of a species; SNBT, the differences between max temperatures (warmest month) and min temperatures (coldest month) across all localities of a species; WLNBP, the mean value of the difference between precipitation (wettest-quarter) and precipitation (driest-quarter) for each locality of a species; SNBP, the differences between precipitations (wettest-quarter) and precipitations (driest-quarter) for all localities of a species. Arid environments can be divided into three types based on annual precipitation value: arid zone (< 800 mm), hyper-arid zone (< 300 mm) and semi-arid zone (300-800 mm) (Salem, 1989). In this study, we classified species distributed in arid zones as arid species and others as non-arid species. An overview map of arid species distribution was generated in software ArcGIS 10.8 (ESRI, Redlands, CA, USA).
Regression analyses
We evaluated the relationships between the genome sizes and environmental factors using phylogenetic generalized least-squares (PGLS) approach in R package caper (Orme et al., 2013) and ape (Paradis and Schliep, 2019). PGLS model incorporating phylogenetic signal (λ) into matrix, making the regression models more reliable. In PGLS model, λ parameter was adjusted to the optimized value through maximum likelihood method, while κ and δ value were set to one (Revell, 2010). To investigate the issue of whether a more restricted model is better than the less restricted model, the AIC value and LRTs were used to compare the three regression models: non-phylogenetic least-squares analysis (OLS, λ = 0), phylogenetic independent contrasts analyses (PIC, λ = 1) (Felsenstein, 1985; Blomberg et al., 2012) and PGLS (λ = ML). The significant related environmental factors are presented in the scatter plots with p value and correlation coefficients.
Results
Phylogenetic relationships
We tested incongruence length differences (ILD) before we combined ITS and plastid data. The p value for ILD was not less than 0.01, therefore, there may be no significant incongruence between ITS and plastid data. Additionally, we reconstructed phylogenies using ITS and plastid data, separately (see Figures S1, S2). The resulting average lengths of the ITS and plastid data were 757 and 3,010 characters, respectively, of which 49 and 93 characters were variable, and 30 and 43 were informative sites. The results showed relatively low bootstrap values for plastid and ITS trees, respectively, and we thus combined the plastid and ITS data for the subsequent analyses. The aligned data matrix for all samples contained 66 sequences and 3,813 characters. Our results showed that the Bayesian tree was identical to the ML strict consensus tree (Figure 1).
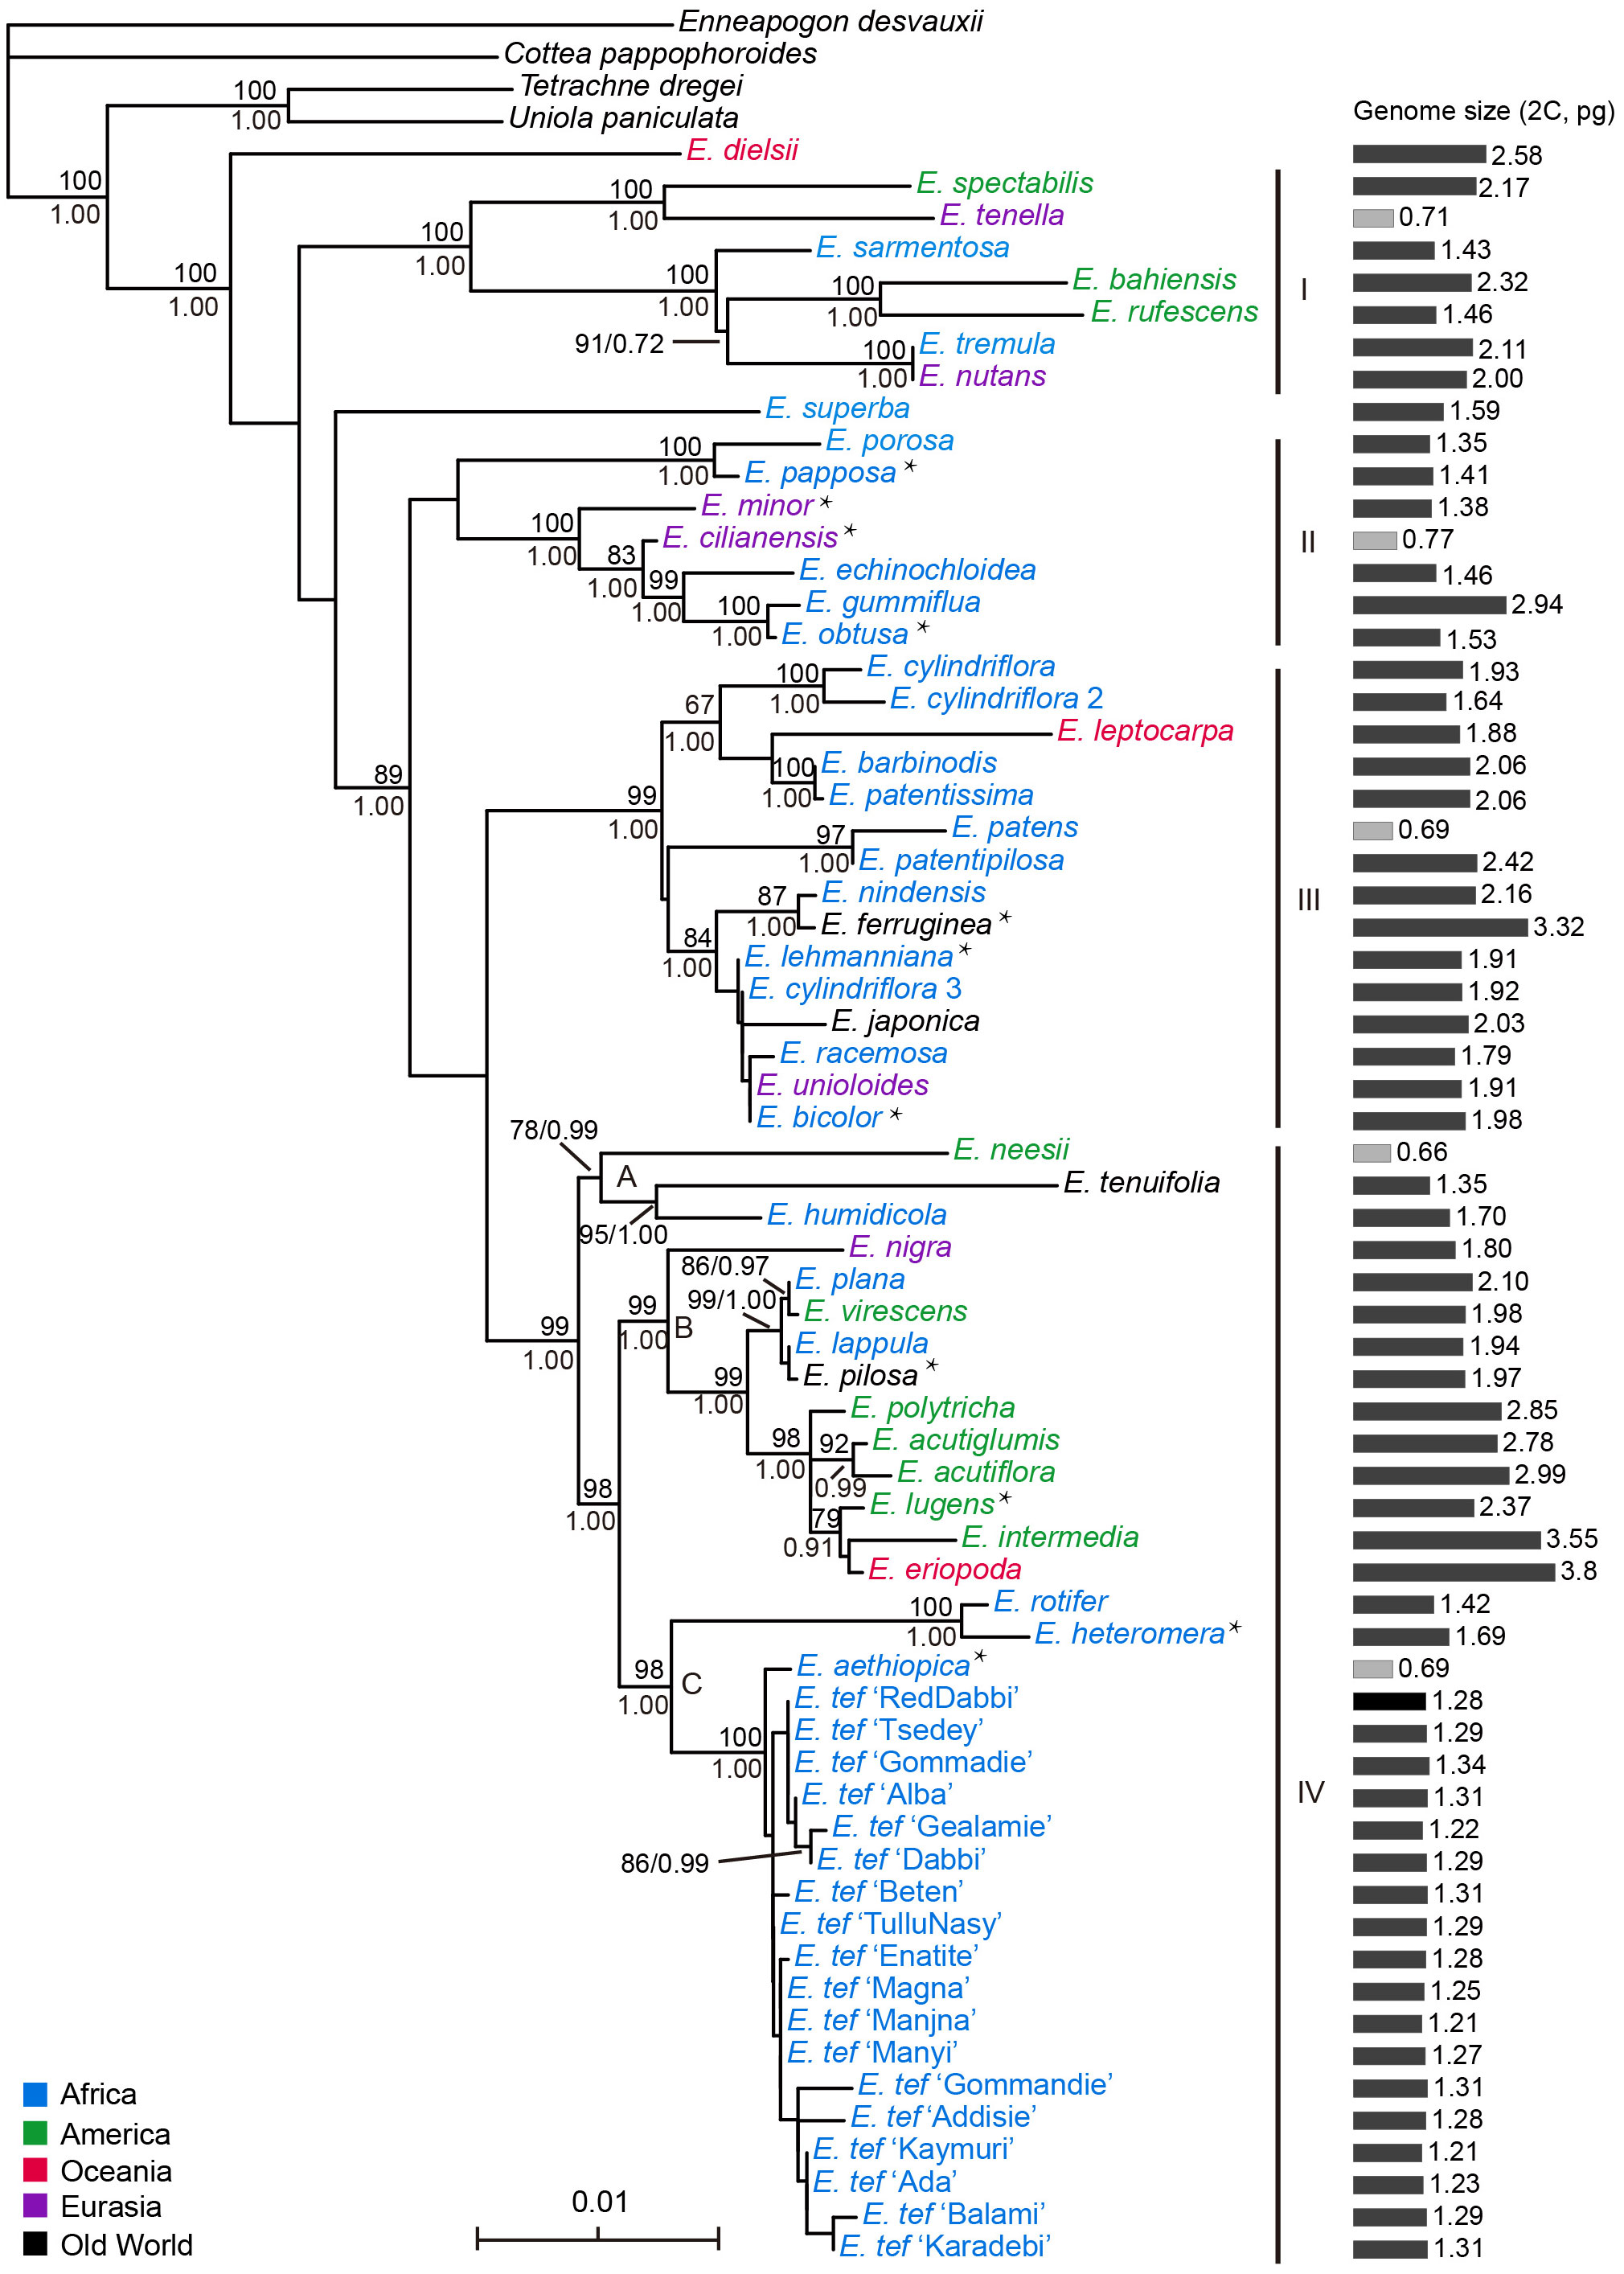
Figure 1 Phylogenetic relationships and genome sizes of Eragrostis species. Phylogram of best maximum likelihood tree reconstructed by combined plastid and nuclear ITS data. Numbers above branches are BS values larger than 50%. Numbers below branches are PP values of the Bayesian tree. Taxon color in Eragrostis clade corresponding to the centralized distribution area as follows: Africa = blue, America (North America and South America) = green, Australia (or Oceania) = red, Eurasia = purple, Old World = black. “Old World” refers to Europe, Africa, and Asia. Genome sizes (2C, pg) of Eragrostis species are presented in grey bars on the right side with small genomes indicated in light grey. *, asterisks represent presumed ancestors of Eragrostis tef in Girma et al. (2018).
We next compared the clades with high bootstrap values among these three trees (ITS, plastid and ITS + plastid). These three phylogenies revealed small discordance. Plastid and ITS trees together supported the monophyly of Eragrostis and the basal position of E. dielsii. Species of Clade I also formed a strongly supported clade (BS = 100) in plastid tree. However, the two sister clades in Clade I were separated in the ITS tree. The species of large subclade (BS = 100, PP = 1.00) in Clade II, except for E. minor in plastid tree, were all formed a single clade in both ITS and plastid trees. Subclade (BS = 84, PP = 1.00) of Clade III were also formed a monophyly in ITS and plastid trees. E. tef cultivars and E. aethiopica were grouped together in both ITS and plastid trees, which is similar to the Clade IV in Figure 1. The only difference is the two species of E. heteromera and E. rotifer were nested within E. tef cultivars in plastid tree.
The monophyly of Eragrostis was strongly supported by BS value of 100%, and PP value of 1.00. The Australia endemic species E. dielsii, which had a controversial position in Eragrostis phylogeny, became the basal species in this clade. The core Eragrostis can be further divided into the four clades, termed Clade I-IV (Figure 1). After the divergence of E. dielsii, the Clade I diverged at first, followed by the Clade II, and finally the Clade III and IV appeared simultaneously. Species included in these clades come from different continents, which were marked in different colors to represent their concentrated area (Figure 1). These four clades were supported with BS values more than 98% except the Clade II (BS = 48%, PP = 0.93). Clade I comprised species from America, Africa and Eurasia was strongly supported (BS = 100%, PP = 1.00). The African native species E. superba was sister to the Clade II-IV. Two well supported subclades were resolved in Clade II, mainly from South/North Africa, comprising four suggested ancestors (E. papposa, E. minor, E. cilianensis and E. obtusa) of E. tef (Jones et al., 1978; Girma et al., 2018). They were found to be polyphyletic within this clade. The Clade III consisted of two subclades, one of which was moderately supportive (BP = 67%, PP = 1.00). Eurasian E. ferruginea and African E. lehmanniana in subclade (BP = 84%, PP = 1.00) of Clade III, had also been identified as the closely relatives of E. tef (Girma et al., 2018). Clade IV (BS = 99%, PP = 1.00) diverged into three subclades (IV-A, IV-B and IV-C), with moderate to strong BS values, comprising 18 accessions of E. tef and its presumed ancestors (E. lugens, E. heteromera and E. aethiopica) proposed by Jones et al. (1978); Costanza et al. (1979); Bekele and Lester (1981) and Girma et al. (2018). Three species of E. neesii, E. tenuifolia and E. humidicola formed a sister clade (IV-A; BS = 78%, PP = 0.99) to the IV-B and IV-C. In subclade IV-B (BS = 99, PP = 1.00), two species of E. lugens and E. intermedia belonged to the intermedia complex in the early taxonomic period (Witherspoon, 1975), had close relationship in our study. Previous studies suggested that the E. pilosa was close to E. tef (Ayele et al., 1999; Ayele and Nguyen, 2000; Ingram and Doyle, 2003), but E. pilosa and teff cultivars were polyphyletic in this study. Different sampling could possibly explain this discrepancy. Our results showed that E. aethiopica, E. heteromera and E. rotifer from Africa were most closely related to E. tef in the subclade IV-C (BS = 98%, PP = 1.00). Among them, E. aethiopica and E. heteromera were proposed as ancestors of E. tef (Girma et al., 2018).
The four clades were partially supported by the blade anatomy analyses of the Eragrostis species, according to the previously defined types of NAD-ME-like, PCK-like, and Intermediate (Ellis, 1977; Prendergast et al., 1986; Ingram, 2010). Clade I was characterized by the PCK-like type, except E. spectabilis and E. rufescens (without anatomy information). The anatomical type NAD-ME-like was randomly dispersed in the other three clades. Interestingly, the presumed progenitors of E. tef mentioned above were dispersed into different clades rather than forming a single clade, whereas they shared a similar blade type of Intermediate, except E. papposa and E. obtusa with NAD-ME-like type.
Genome size variation
The genome size estimates of 66 Eragrostis accessions representing globally geographical origins were reported in this study. The chromosome numbers and DNA contents formerly reported were also collected and given in Table 1 and Table S1. Our results showed that genome sizes differed up to 6-fold, ranging from 0.66 pg in E. neesii to 3.8 pg in E. eriopoda (Figure 2A). The five species (E. tenella, E. cilianensis, E. patens, E. neesii and E. aethiopica) with the smallest 2C-value (0.66-0.77 pg) were half that of E. tef, indicating that they might be diploid rather than tetraploid, supporting previous chromosome counting with 2n = 2x = 20 (Dujardin and Tilquin, 1971; Fernandes, 1971; Bir, 1983; Gohil, 1986; Tavassoli, 1986; Faruqi et al., 1987). The three species with the largest genomes were E. ferruginea, E. intermedia and E. eriopoda (3.32-3.80 pg), showing that they might be decaploid or with even higher ploidy levels, confirmed by previous chromosome counting with 2n=12x=120 (Tateoka and Löve, 1967; Gould, 1968; Reeder, 1971) (Table 1). Among the 11 presumed progenitors of E. tef (Girma et al., 2018) (indicated by asterisks in Figure 1), genome sizes ranged from 0.69 pg in E. aethiopica to 3.32 pg in E. ferruginea, and their ploidy levels fluctuated from diploid to decaploid. Although, the genome sizes varied by 4.8-fold in presumed ancestors of E. tef, they seemed still within the range of genome size variation of our examined samples (indicated with asterisk; Table 1). Additionally, previous studies reported that E. cilianensis and E. lehmanniana contained multiple cytotypes (Bekele and Lester, 1981; Voigt et al., 1992), but we failed to observe such results in this study. The DNA contents (2C-value) were estimated for the three species of Eragrostis, including E. spectabilis (2.30 pg) (Bai et al., 2012), E. minor (1.46 pg) (Šmarda et al., 2014) and E. tef (1.40 pg) (Bennett and Smith, 1976). Our results obtained in this study are quite consistent with the formerly reported genome sizes for these three species (Table 1), suggesting the reliability of experimental methodology. Notably, we observed an average genome size of 1.28 pg for the 18 E. tef varieties (2n = 4x = 40) (Table S1), which was in accordance with the recently published genome sequences of 1.27pg (VanBuren et al., 2020).
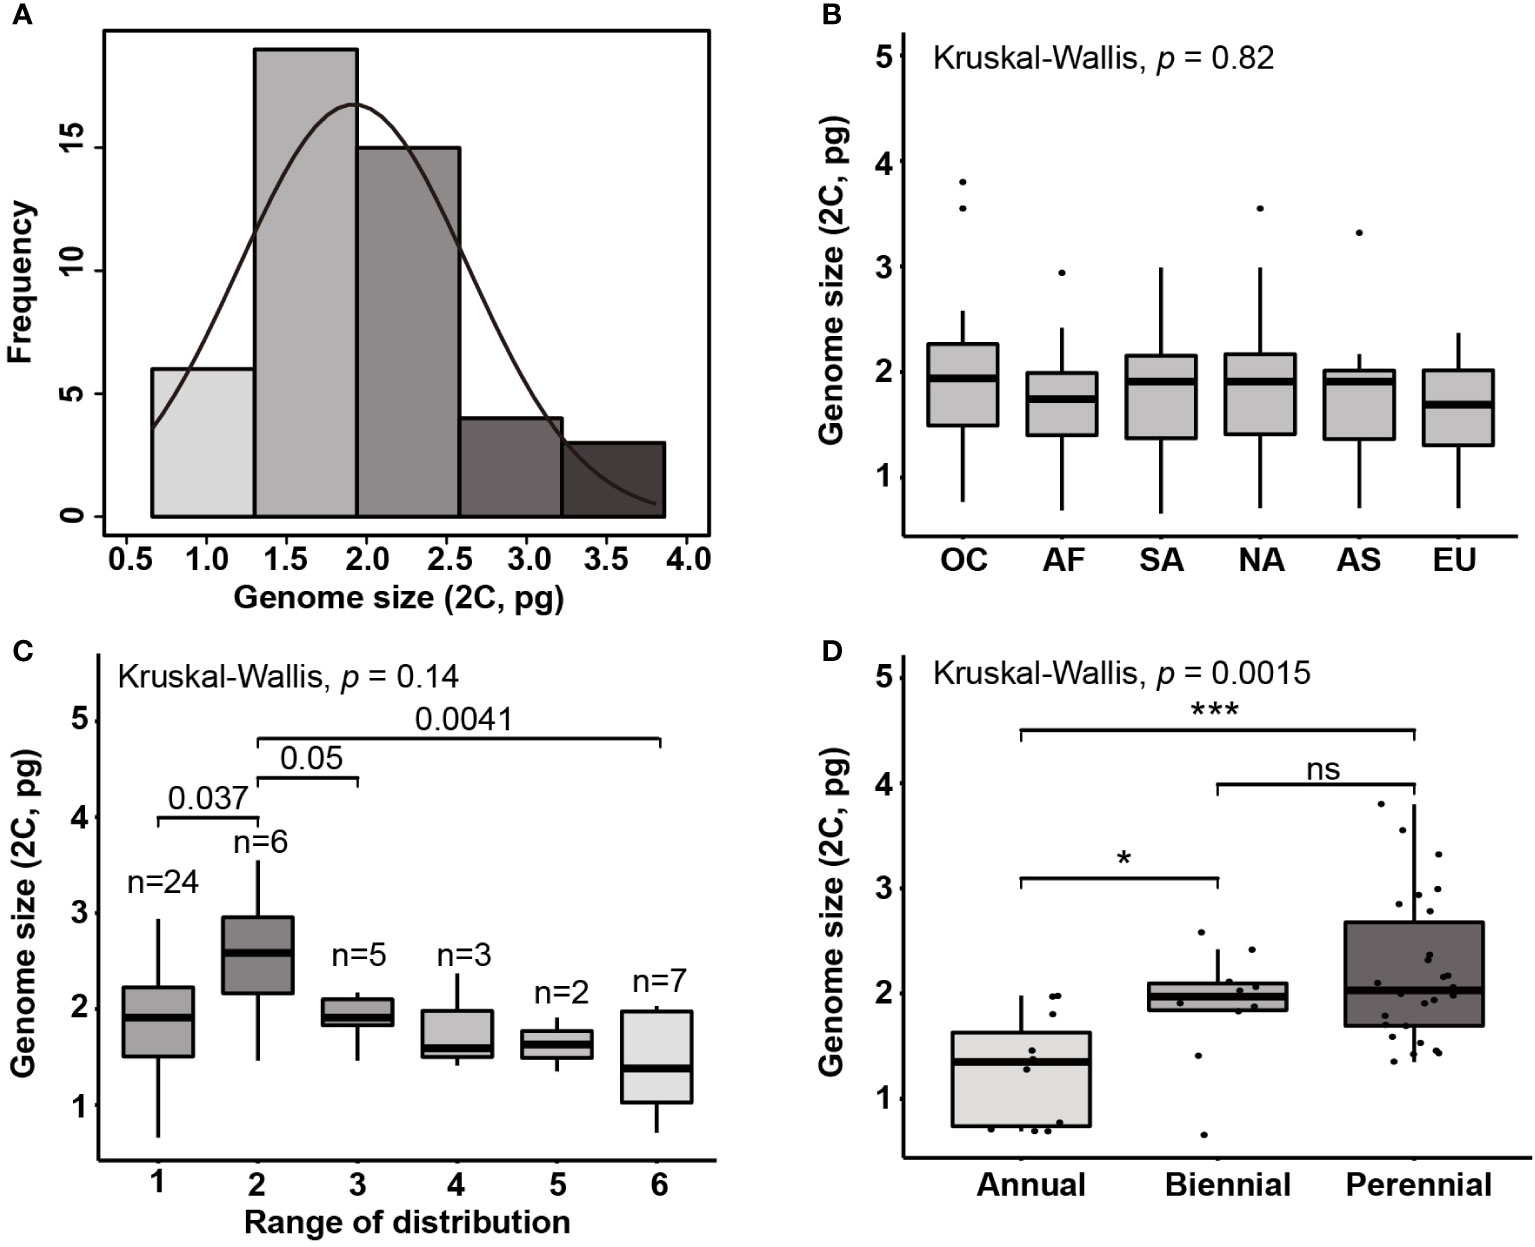
Figure 2 (A) Histogram of genome sizes (2C; pg) in Eragrostis and the normal density curve. Boxplots show the genome size variation on (B) six continents (C) range of distribution (occupied continents) and (D) life styles. The value of occupied continents corresponding to species occurred in one continent to six continents, according to the distribution data from GBIF. OC, Oceania; AF, Africa; SA, South America; NA, North America; AS, Asia; EU, Europe. Ns, not statistically significant; ***, p < 0.001; *, p < 0.05.
Given the morphological variability and wide range of Eragrostis species, we analysed the genome size variation among different clades, distribution ranges and life styles. There were no significant differences in genome sizes among the four clades (p = 0.284; Kruskal-Wallis test). Within each clade, genome sizes varied limitedly in Clade II (0.71-2.32 pg) and greatest in Clade IV (0.66-3.80 pg). Interestingly, we found that at least one annual species of each clade was small in genome size, which are indicated in light grey colour (0.66-0.77 pg) (Figure 1; Table 1).
We then tested genome size variation among six continents, as shown by the Kruskal-Wallis test. Our results showed that differences were not statistically significant (p = 0.820; Figure 2B). We first attempted to only consider the concentrated area for each species, however, some species occurred in more than one continent. Thus, the number of continents occupied by each species was used to represent the ranges of species by following Wang et al. (2016). However, Eragrostis is much more widely distributed than Betula, and thus, we used the number of continents occupied by species to represent the distribution range. We divided samples into six groups, 1 for one continent and 6 for six continents (Table S5). The group occupied six continents had the smaller genome size than the group occupied two continents (Wilcoxon test, p = 0.004; Figure 2C; Table S5). The group occupied two continents also exhibited differences with groups occupied one and three continents (Wilcoxon test, p = 0.037, p = 0.050, respectively; Figure 2C). Moreover, perennial species had larger genome sizes than the annual species (p < 0.001; Wilcoxon test) (Figure 2D).
Genome size evolution
The comparisons among the six evolutionary models (see Materials and methods) showed that the kappa model fitted best in genome size with the lowest AIC score (Table 2). Estimates of Pagel’s λ indicated that the genome size exhibited a moderate phylogenetic signal with a lambda value of 0.75 (Table 2) and LRTs verified the results (Table S6). Indeed, we observed that several species with overlapping distributions or genome sizes tended to have close relationships in subclades. In addition, BayesTraits results suggest that λ value of genome size was significantly greater than zero but lower than one (Table S7), indicating that genome size failed to evolve under a pure Brownian motion. Environmental factors may also play an important role in determining genome sizes of Eragrostis. The estimates of Pagel’s δ was 3.00, which was significantly different from 1 (Table S7), referring to the occurrence of specific adaptation. Estimates of the Pagel’s κ value revealed that short branches contributed proportionally more to the genome size evolution (κ = 0.43; Table 2). Although genome size had a strong phylogenetic signal, the λ value was still significantly different from 1 (Table S7), indicating that genome size was not very suitable for either pure Brownian motion (λ = 1) or No-signal model (λ = 0). BM and OU are basic models used in continuous variables, and thus, we compared the log likelihood of the basic models through LRTs. The results indicated that the restricted model (BM) fitted the data better than the less restricted model (OU), because we accepted the H0 hypothesis that assumes the restrictions are ‘true’ (p = 0.334). Hence, it is likely that the genome size evolved towards a BM model through the history. Besides, the Log BF of the model B was not significantly different from the model A, confirming that the genome size fitted the random walk better than the evolution of directional trend (Table S7).
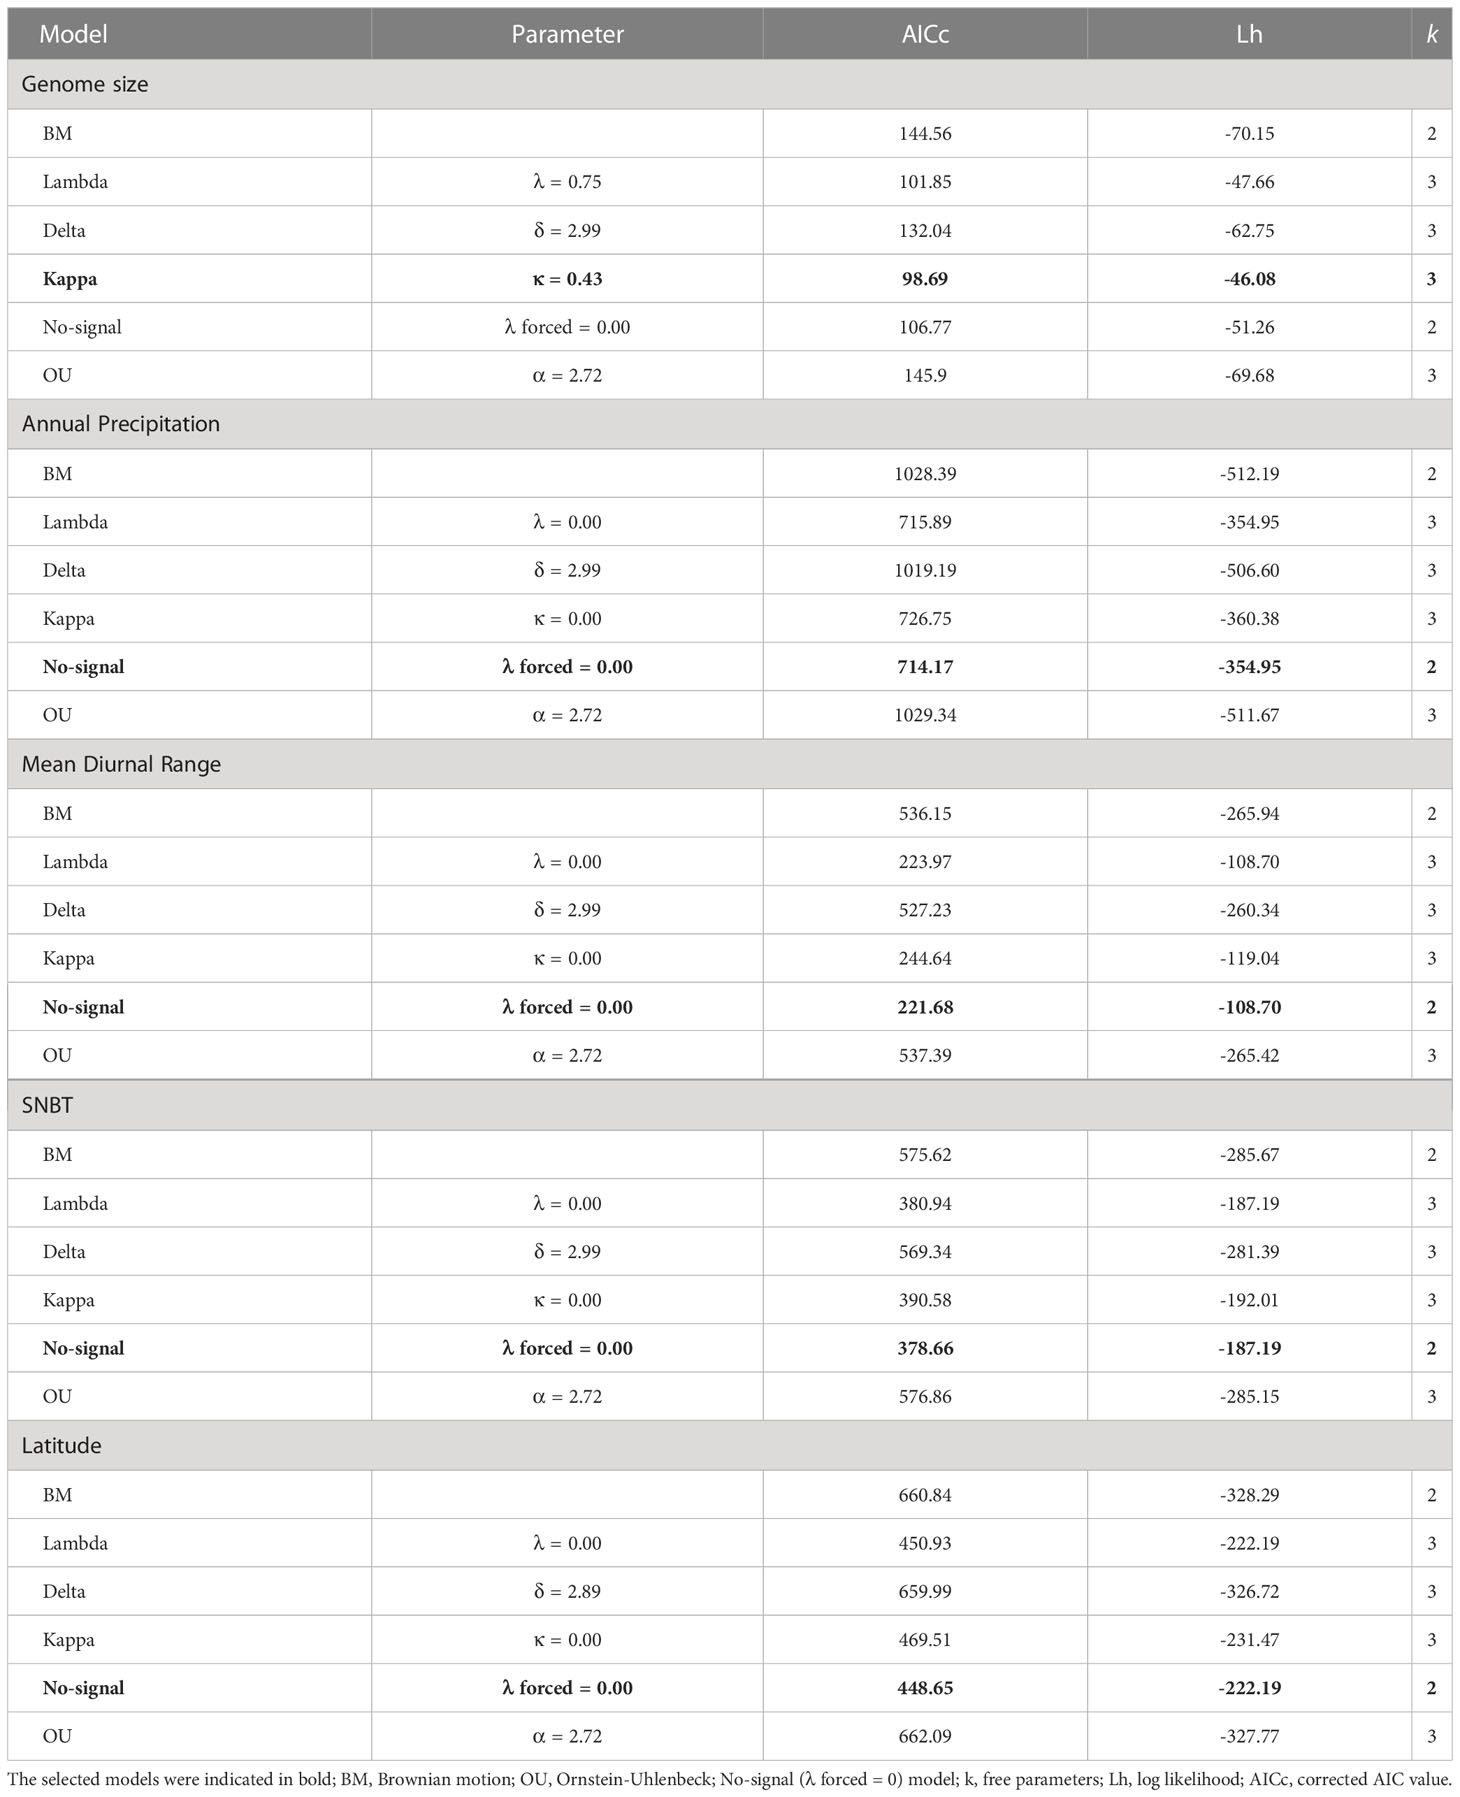
Table 2 Selection for the best evolutionary model of genome size and environmental factors in the genus Eragrostis.
As for geographical factors (latitude, longitude and elevation), the model that best fitted the data was No-signal model (λ forced = 0.00; all p > 0.05 between the λ and No-signal model; Tables 2, S6, S8) based on the AICc criterion, indicating a lack of phylogenetic signals in these geographical variables. The LRTs between basic models did not achieve significance at the 0.05 level, suggesting that BM models performed better than OU models in all geographical factors (p = 0.307-0.320; Table S6). The Log BF provided strong evidence that the δ values for geographical factors were all greater than 1 (δ = 2.89-2.99; Tables 2, S7, S8), indicating that there was either a temporally latter trait evolution or an accelerated evolution over time. These three geographical variables were consistent with the punctuated evolution (κ = 0.00; Tables 2, S8), which was supported by both ML and MCMC methods (Table S7).
Evolutionary patterns of all climatic niches were similar to geographical variables to fit a No-signal model (Tables 2, S8) and a high value of δ (δ = 2.99) (Tables 2, S8). Estimated values of κ were generally low and significantly different from one in all climatic niches (Tables 2, S7, S8). The lambda, kappa, and delta models clearly outperformed the BM models except that four variables (temperature annual range, latitude, SNBP and WLNBT) showed no significant differences between the delta and BM models (Tables 2, S6, S8). The OU models had never shown any significant differences from the BM models based on the LRTs in all climatic niches (Table S6).
Correlations between genome sizes and environmental factors
Exploring the correlations between genome sizes and environmental factors was one way to offer evidence for the evolutionary adaptation of plants (Petrov, 2001; Šmarda et al., 2014; Bilinski et al., 2018). The results of regression analyses between genome sizes and environmental factors used in three models are presented (Tables 3, S9; Figure S3). Overall, there were no correlations between the genome sizes and the environmental factors (with the exception of eastern longitude) in ordinary regression models, whereas after phylogeny correction, significant genome size variation in Eragrostis could be explained by eight factors in the PGLS models (Table 3). In fact, trait evolution usually depends on phylogeny, and the PGLS approach incorporates the value of phylogenetic signal as covariance into the regression analyses, giving a better way to handle our data. Indeed, LRTs in all variables showed that the PGLS models fitted our data better than OLS significantly (all p < 0.001; Tables 3, S9). The PIC model assumed that the traits of closely related species evolved independently under the Brownian motion. Although some correlations were not as strong as expected in a strict Brownian model, LRTs chose PGLS regression as the best fitting model, i.e. precipitation of wettest month showed high correlation with genome size in PIC model, but LRTs chose PGLS model with no correlation (Table S9).
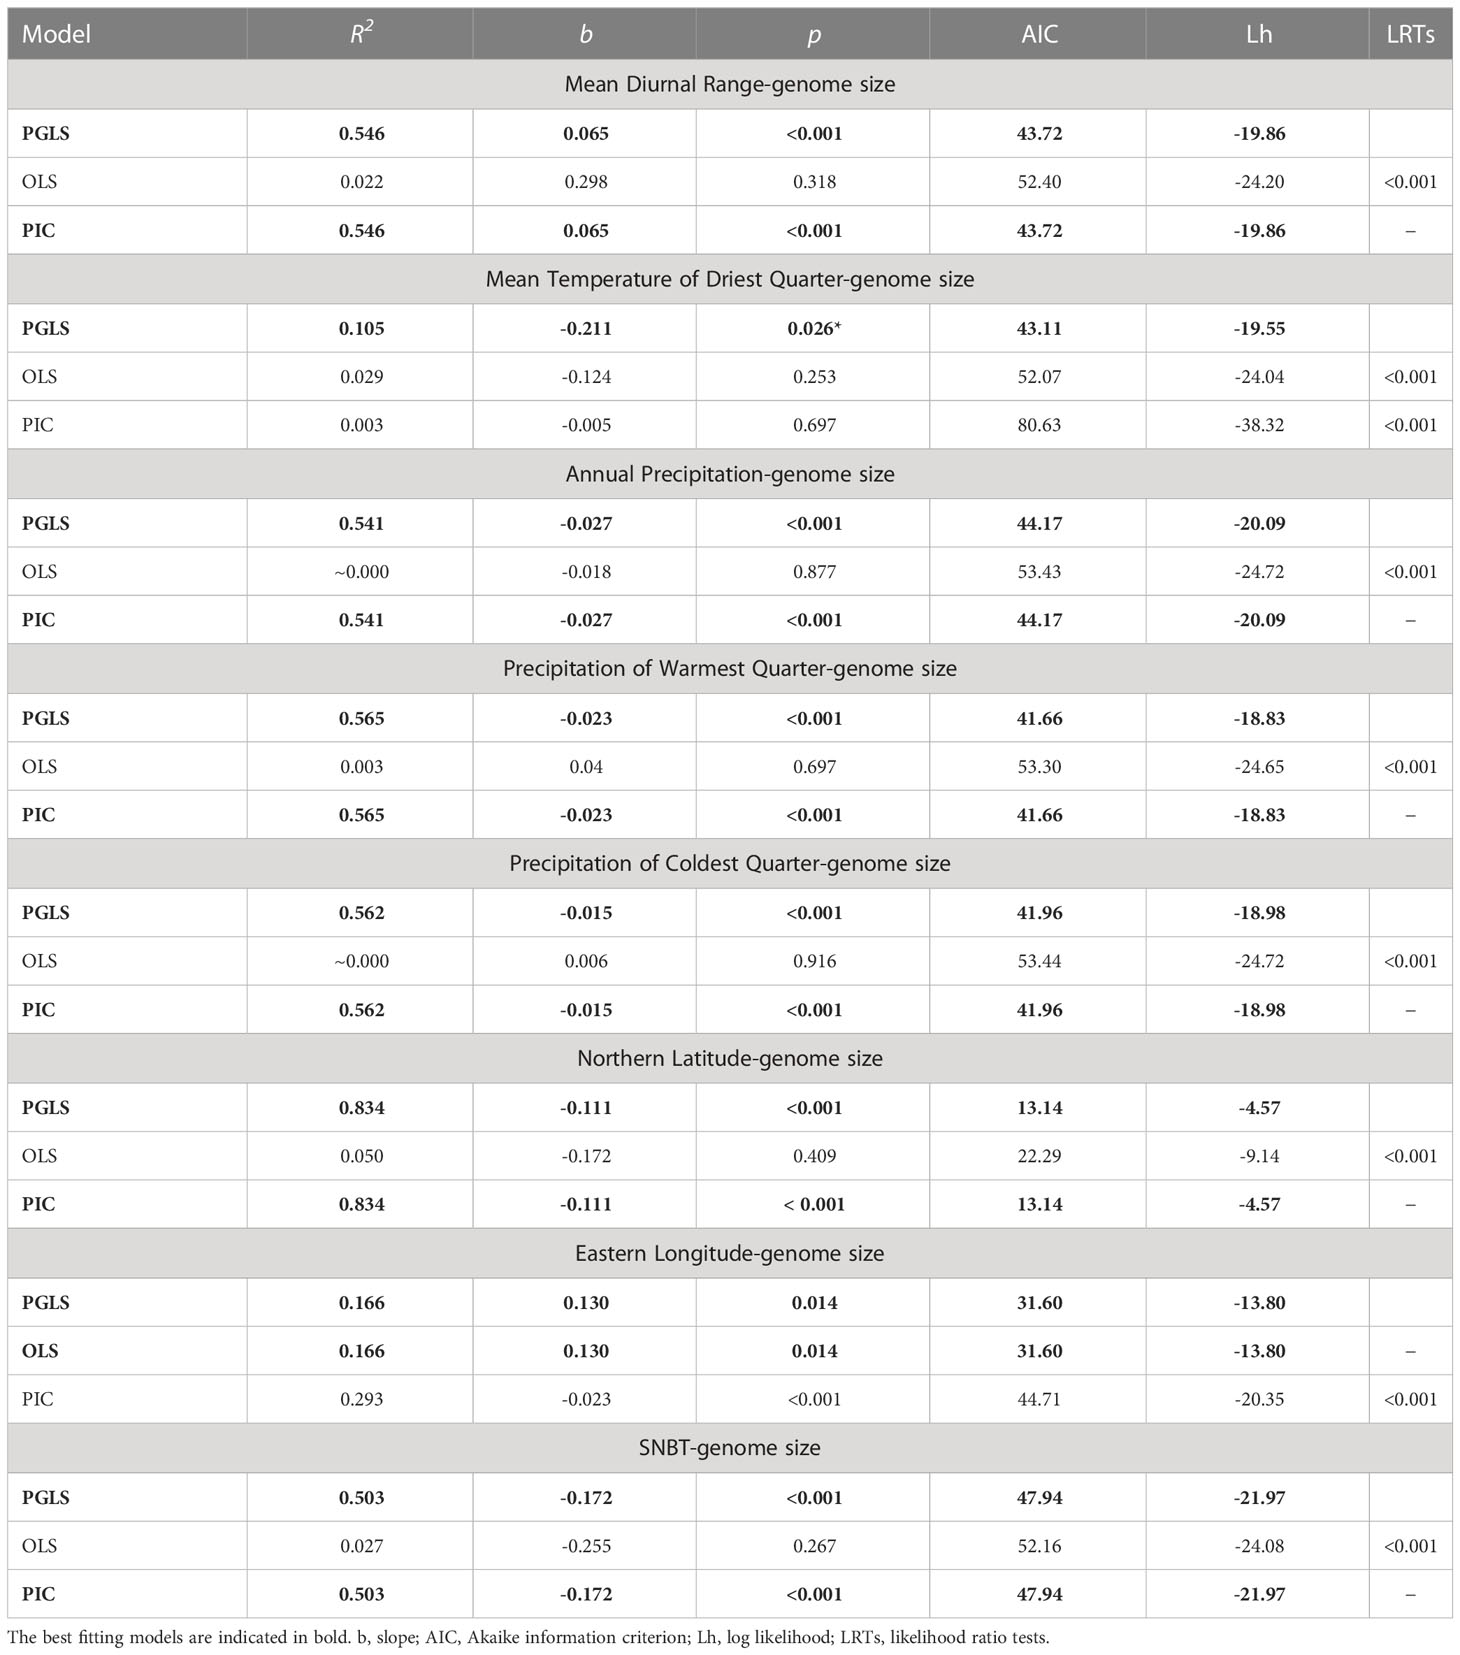
Table 3 Summary of associations between Eragrostis genome sizes (2C, pg) and environmental factors tested by three regression models.
There were significant negative relationships between genome sizes and the three climatic niches associated with precipitation, including annual precipitation, precipitation of warmest quarter and precipitation of coldest quarter (R2 = 0.541, R2 = 0.565 and R2 = 0.562, respectively; p < 0.001; Table 3). For temperature niches, genome size was significantly positively associated with the mean diurnal range (R2 = 0.546, p < 0.001), and negatively correlated with SNBT (R2 = 0.503, p < 0.001) and the mean temperature of driest quarter (R2 = 0.105, p < 0.05) (Table 3). The relationships between genome sizes and geographical distributions were also investigated. There was a slightly significant positive relationship between the genome size and eastern longitude (R2 = 0.166, p < 0.05; Table 3), which was the only exception when the OLS model fitted the data better than the PIC model. In contrast, a significant negative relationship was observed between genome size and northern latitude in the PGLS model (R2 = 0.834, p < 0.001; Table 3). However, the correlation coefficient in the northern latitude was probably unreliable due to the small sample distributions in the northern hemisphere. In these eight correlated variables, the PIC regression models gave similar results to those of the PGLS, except for the mean temperature of driest quarter and the eastern longitude, showing that the assumed Brownian motion in the PIC models was correct (Blomberg et al., 2012).
Climatic niches, ancestral states and global distribution
We reconstructed ancestral character states only for SNBT, mean diurnal range and annual precipitation, all of which had strong evolutionary associations with genome sizes. Ancestral states were inferred using the maximum parsimony method for all nodes of the phylogenetic tree, but only some key nodes are presented in Figure S4 (labeled with numbers). The results of ancestral reconstruction showed that the common ancestors of the Eragrostis clade came from semi-arid areas (~648 mm of annual precipitation) with the mean diurnal range of approximately 13°C. Climatic niche values of ancestral nodes were estimated between 596 mm to 928 mm for precipitation, and between 12°C to 15°C for the mean diurnal range. In the terminal taxa, E. dielsii, the most basal species in the clade Eragrostis showed the lowest annual precipitation at only 259 mm, and E. acutiflora in Clade IV showed a maximum value of 2,359 mm. The diurnal range value varied from 7°C in E. nutans to 16°C in E. lehmanniana (Figures 3, S4). Thus, the climatic conditions in the reconstructed ancestral nodes were much more stable than the extant species. Besides, approximately 50% of extant species with annual precipitation lower than 800 mm were distributed across the phylogenetic tree for each clade (Figure 3). Indeed, the Wilcoxon tests showed that there was no difference in annual precipitation between the clades (p > 0.05), except for the Clade II (p = 0.039), by comparing each group with the base value. Within a particular Clade II, all species had low precipitation and remained relatively stable to basal nodes (Figures 3, S4). Interestingly, most of the key nodes corresponding to the ancestors of two clades had intermediate values between them. This can be observed, for example, the Node-1 value was estimated at 701 mm of annual precipitation, which was between 660 mm (Node-9) and 764 mm (Node-5). For SNBT, the ancestral status of this genus was estimated to be 49°C (Node-1), with a slow increase during the evolution towards Clade II (Node-9, 56°C) and a gradual decrease during the evolution towards Clade IV (Node-6, 43°C). The annual species E. pilosa had the greatest niche breadth, from -36°C to 45°C (SNBT = 81°C). Conversely, a perennial species of E. humidicola, narrowly inhabited in Central Africa (Senzota, 1982), had the smallest habitat temperature breadth from 9°C to 32°C (SNBT = 23°C) (Figure S4). Notably, our estimates of these three ancestral climatic niches revealed signs of both increase and decrease in the four clades (Clade I-IV).
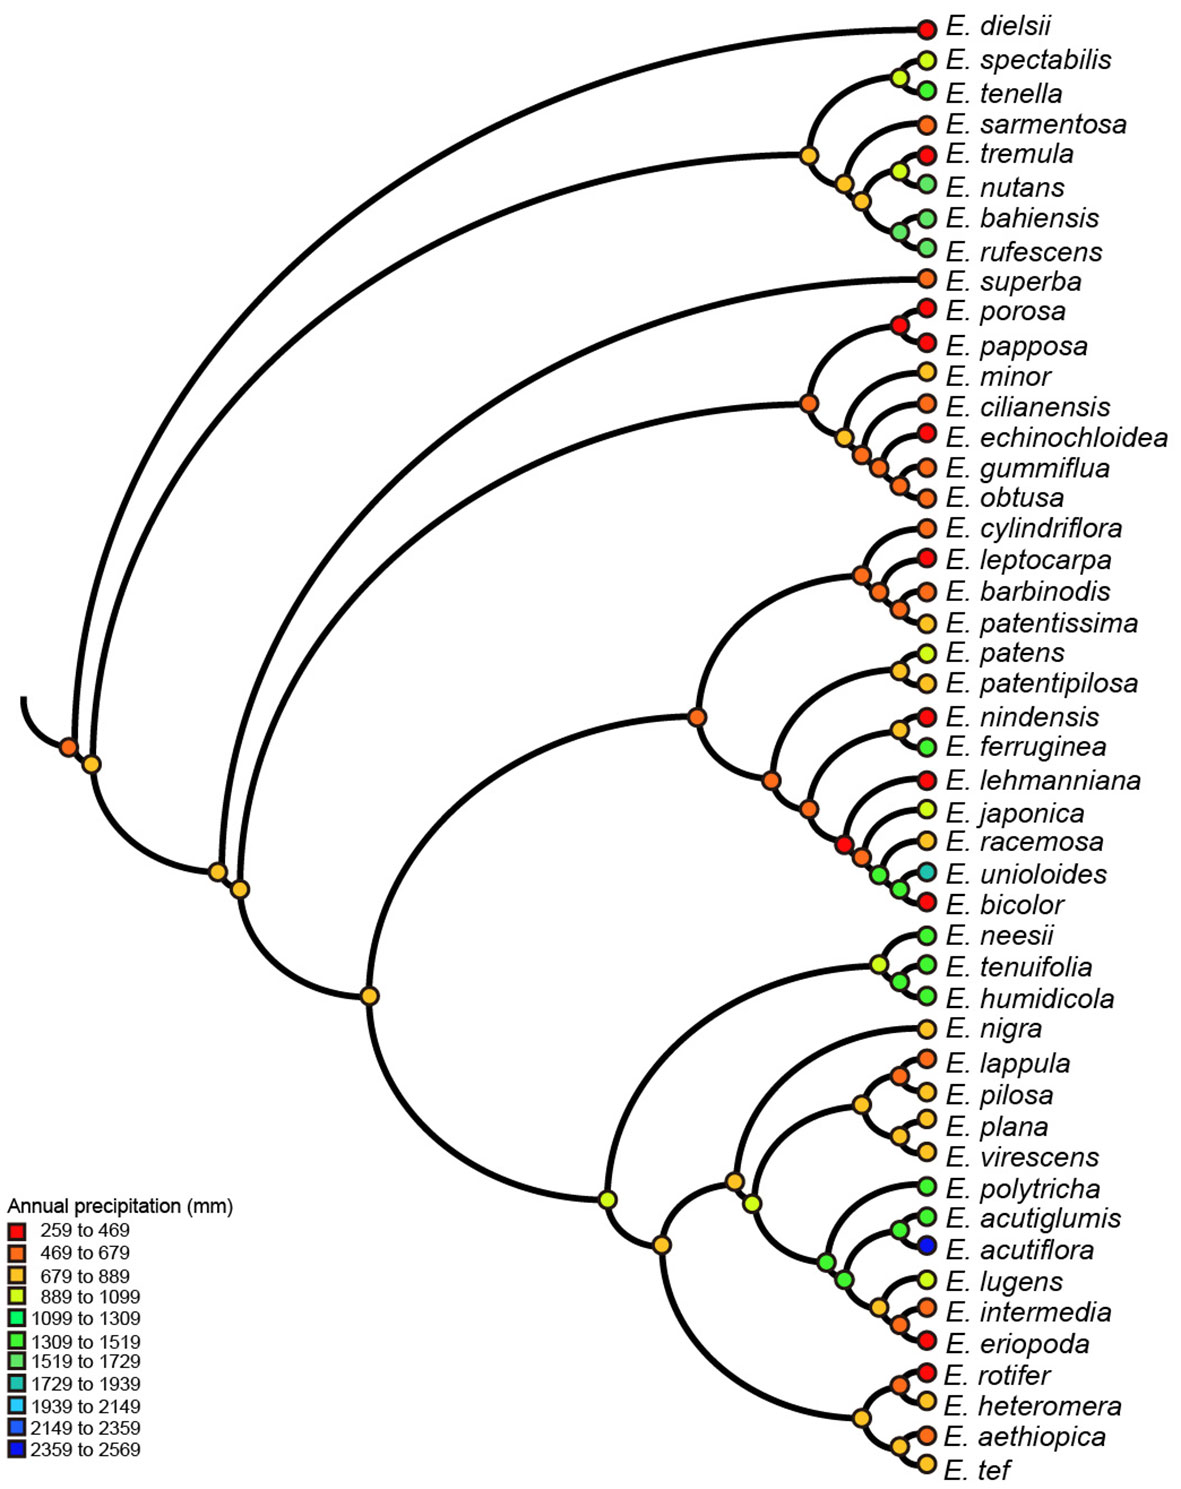
Figure 3 Parsimony reconstruction of ancestral annual precipitation (mm) on Eragrostis consensus tree (balls & sticks). Different values of precipitation were marked as different colors.
A global distribution map is presented to review the dispersal of Eragrostis species (Figure 4). Unexpectedly, the arid species (red dots) showed a similar distribution area when compared to the published map of “Arid Lands of the World” (http://pubs.usgs.gov/gip/deserts/what/world.html). South Africa, North America and Australia showed the greatest coincidence with the Eragrostis species in the arid areas (areas surrounded by green dashed lines). Arid species inhabited almost all of these three continents and were partially dispersed in North Africa, South America and Eurasia. Of these arid species, E. aethiopica endemic to South Africa had the smallest genome size of 0.69 pg, while E. eriopoda native to Australia had the largest genome size of 3.80 pg. The four species of E. tef, E. cilianensis, E. minor, and E. virescens, had relatively small C-values (0.77-1.98 pg), mainly distributed in semi-arid zones around the world (Northam et al., 1993; Ketema, 1997; Martini and Scholz, 1998; Rajbhandari et al., 2016). In contrast, the three species of E. dielsii, E. leptocarpa and E. eriopoda had relatively large C-values (1.88-3.80 pg), which were endemic to Australia with annual precipitation less than 300 mm.
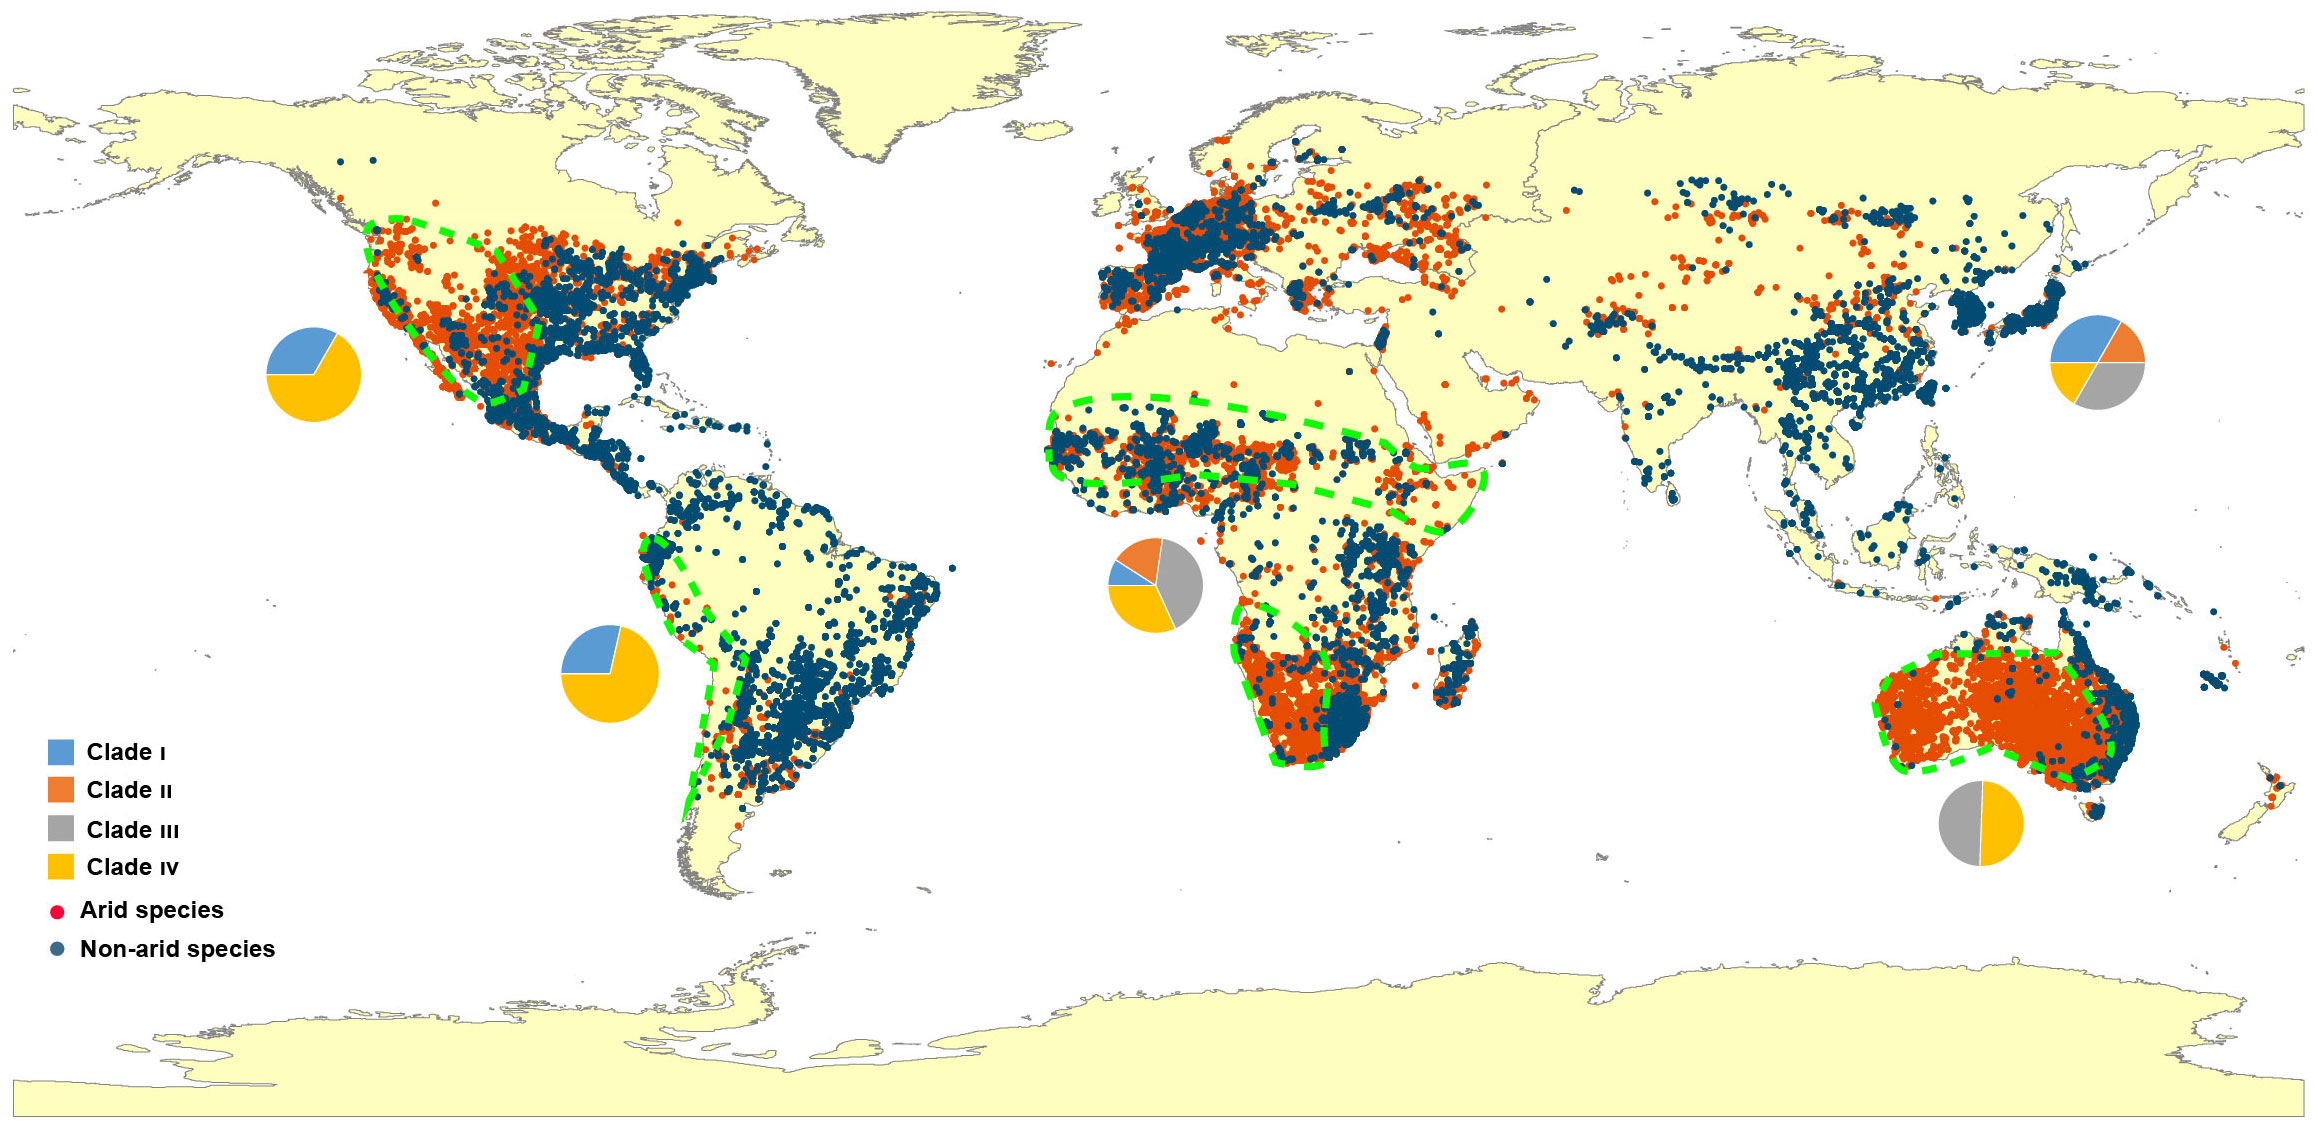
Figure 4 Map of locations and distributions of Eragrostis species used in this study. The regions surrounded by the green dashed lines represent the overlapping arid areas according to the arid species and the survey of International Arid Lands Consortium (http://pubs.usgs.gov/gip/deserts/what/world.html). Red dots, arid species; Dark blue dots, Non-arid species. The pie charts indicate the proportion of four major Clade I-IV in each continent. Blue, Clade I; Orange, Clade II; Grey, Clade III; Yellow, Clade IV.
We finally investigated the genome size variation in 27 arid species across Africa, America and Australia. Perennial species had a higher percentage in the arid zones of these three continents (Figure S5A). However, genome sizes of arid species showed no differences between these three fully occupied arid areas (p = 0.610; Figure S5B). When we divided all species into arid and non-arid groups, the significance of the differences was not confirmed by the Wilcoxon test (Figure S5C), even among different life style groups (Figure S5D).
Discussion
Phylogenetic relationships and genome size variation
Previous studies have put efforts to investigate the monophyly of Eragrostis, but until recently, it is still a controversial issue. Our results strongly support the monophyletic origin of Eragrostis, which is in accordance with the phylogeny analyses of combined rps16 and trnL-F (Ingram, 2010) and complete chloroplast genomes (Somaratne et al., 2019). Nevertheless, other researchers proposed opposing opinions that they have reintegrated some previously separated species into Eragrostis (Hilu and Alice, 2001; Ingram and Doyle, 2004; Ingram and Doyle, 2007; Peterson et al., 2010). Different and limited sampling may be responsible for these discrepancies, and thus the origin of this large genus still needs further investigation.
The infrageneric classification of Eragrostis has been complicated due to the occurrence of polyploids, and only a few studies have resolved some close relationships (Ingram and Doyle, 2007; Ingram, 2010; Girma et al., 2018; Barrett et al., 2020; Liu et al., 2021). The E. dielsii growing in a drier area of Australia with precipitation less than 300 mm annual year was the basal species of the Eragrostis clade in this study. This finding is consistent with former results by Ingram and Doyle (2007), in their waxy and rps16 tree, by Girma et al. (2018), in their new waxy gene tree, by Peterson et al. (2010), in their nuclear ITS sequence analyses, and by Barrett et al. (2020), in their combined plastid (rpl32-trnL, rps16, rps16-trnK) and ITS analyses. A revision of Eragrostis in Australia mentioned that E. dielsii was also a salt-tolerant plant (Lazarides, 1997). Thus, due to its taxonomic status and its tolerance to aridity, further efforts are required to explore its important role in Eragrostis. Additionally, another important species of Eragrostis was E. tef, whose ancestors are still unknown. The combined data and plastid data alone (Figure S1) together support that E. aethiopica, E. heteromera and E. rotifer were closely related to E. tef. To identify the diploid teff donors (Ingram and Doyle, 2003; Girma et al., 2018; VanBuren et al., 2020), however, a well-resolved phylogeny based on high-quality sequences is still needed, which is critical in exploring the complex evolutionary history of this allopolyploid crop.
Genome size variation has long been linked to life styles and ranges, while we are still wondering whether this link is stable. If so, it could be possible to choose the area in which a plant would grow best (Bennett, 1987). It is well known that genome size variation has effects on distribution ranges of species (Knight and Ackerly, 2002; Knight et al., 2005). This was observed in the genus Eragrostis, supporting the hypothesis that species with smaller genomes occupy a wider area than the species with larger genomes (Grotkopp et al., 2004; Lavergne et al., 2010; Pandit et al., 2014). Invasive ability of the species with small genomes, such as E. tenella, E. minor and E. curvula, which were reported as invasive plant species (Guido et al., 2019; Roberts et al., 2021; Wróbel et al., 2021; Buerdsell et al., 2022), could explain their global dispersal (Bennett et al., 1998; Grotkopp et al., 2004). Overall, our study suggests that genome size variation in Eragrostis is one of important drivers affecting global distribution, and species with smaller genome sizes tend to have a more extensive distribution than those of larger sizes.
The genome size of land plants has generally shown a non-normal or skewed distribution (Leitch and Leitch, 2013). In contrast, the genome size of Eragrostis in this study was subjected to normal distribution with large and small genomes in equivalent numbers (Figure 2A). Normal distribution of genome size was also found in six continents, and species with the small genome size occurred in each clade and continent. Besides, genome size variation showed no difference among continents and clades. Hence, most continents or phylogenetic clades might follow a similar pattern of genome size variation. It is interesting to note that this kind of trend, without differences between continents, has also been documented in other worldwide species like Chenopodium (Mandak et al., 2016), duckweeds (Wang et al., 2011) and Carex (Chung et al., 2011). Our results indicate that small genome size favored annual species. This is consistent with previous studies, which claimed that annuals or ephemerals were either rare or absent from those very large amounts of DNA (Price and Bachmann, 1975; Bennett, 1987; Enke et al., 2011; Qiu et al., 2019).
Evolutionary dynamics
The genome size variation in Eragrostis was found to have a moderate phylogenetic signal, indicating that the genome size evolution may be associated with the phylogenetic relationships. Many species have shown strong phylogenetic signals, which may be related to the heritable characteristic of genome size (de Ricqlès et al., 2008). The presence of a complete phylogenetic signal, a value λ approaching one, suggests that genome size did not evolve in an adaptive fashion (Blomberg et al., 2003; Pandit et al., 2014). However, the LRTs results showed that the phylogenetic signal was significantly different from 1, indicating the occurrence of adaptive evolution in Eragrostis species (Gregory, 2005; Gregory and Johnston, 2008). This observation was also supported by the results of our PGLS analyses, showing that genome size was significantly related to climatic variables. Furthermore, climatic niches and geographical factors showed similar λ model with lacking of phylogenetic signal, indicating that PNC did not exist (Losos, 2008). The likely explanation is that existing species were less likely to maintain their ancestral environmental features and adapted to new niches (Wiens and Graham, 2005). These evolutionary models were further confirmed by the ancestral states of the climatic niches. Annual precipitation showed that the ancestral states for Eragrostis has undergone several reductions and increases along different clades, as well as the expansions of SNBT and mean diurnal range, indicating that existing species had a larger area than their ancestors did.
Evolution often breaks down or bursts out under punctuated model (Eldredge, 1993; Gregory, 2004; Pagel et al., 2006). Our results suggest punctuated environmental changes, and the genome size of Eragrostis evolved in more punctuated than graduated behaviors. This finding is in good agreement with Elena et al. (1996), who claimed that evolution went punctuated when environmental changes became erratic. Punctuated evolution of genome size has been reported in some other plants, such as Melanocrommyum (Gurushidze et al., 2012), Liliaceae (Leitch et al., 2007), Orobanche (Weiss-Schneeweiss et al., 2006), and bromeliads (Müller et al., 2019). However, the drastic genome size variation of Eragrostis may also be a result of whole genome duplication, as multiple ploidy levels have been reported in this genus (Tavassoli, 1986).
Tempo estimates of all variables, including genome sizes and environmental factors, gave consistent results with δ values from 2.69 to 2.99. All variables may have experienced species-specific adaptation or accelerated evolution over time, with more diversification during recent evolutionary history, as seen in other taxa (Kang et al., 2014; Müller et al., 2019; Martínez-Méndez et al., 2019). In Eragrostis, most arid species from the recently diversified clades could explain the latter evolution model. However, the cause of this tendency still remains unsolved.
Environmental correlation and global dispersal
Genome size variation associated with diverse environmental factors have often been interpreted as a kind of adaptation in response to the precipitation or temperature changes (Bennett, 1987; Wakamiya et al., 1993; Petrov, 2001; Whitney et al., 2010; Kang et al., 2014; Jordan et al., 2015; Trávníček et al., 2019). Previous opinions about plant species with large genome sizes remain controversial. It was suggested that the extra DNA content would have maladaptive consequences and tend to be excluded from the extreme environments (e.g. high temperature, low precipitation) (Knight and Ackerly, 2002; Knight et al., 2005). In this study, however, we found the contrary evidence. Our PGLS results suggest that genome sizes appeared to have strong correlations to precipitation related niches but nothing was related to precipitation seasonality. Specifically, species with larger genomes preferred less precipitation than the species with smaller genomes. Not coincidentally, similar trends of larger genomes in arid areas were also reported (Kalendar et al., 2000; Torrell and Vallès, 2001; Bureš et al., 2004; Grotkopp et al., 2004; Souza et al., 2019). Considering that ploidy levels are great drivers of genome sizes in the genus Eragrostis, one likely interpretation is that large genomes indeed represent plant species with higher ploidy levels, which possess superior phenotypes, may be better adapted to extreme environmental conditions. In addition, plant species with large genomes have been proposed to survive in extreme habitats through cell inflation instead of cell division (Grime and Mowforth, 1982).
Although the correlation coefficients in the temperature niches were smaller than the precipitation-related niches, the mean diurnal range also showed a close relationship with genome size in Eragrostis. The mean diurnal range was considered as a climatic risk factor because a major change in diurnal temperature could increase plant mortality (Kan et al., 2007; Briga and Verhulst, 2015). In this study, genome size was positively correlated with the mean diurnal range, indicating that Eragrostis species with large genomes, in other words, higher levels of polyploids may be more permissible in habitats where diurnal temperatures vary greatly. Correlations between genome sizes and mean diurnal ranges were also found in wild wheat, Primulina and Ranunculus auricomu (Özkan et al., 2010; Kang et al., 2014; Paule et al., 2018). It is well known that the climatic niche variables are interdependent, and thus, the relationships among them were further considered in a context of association with genome size variation. An intimate relationship was established between annual precipitation and mean diurnal range with negative significance in the OLS and PGLS models (R2 =0.530, p < 0.001), suggesting that the genome size variation in Eragrostis may result from the combined effects of precipitation and temperature. Additionally, previous studies suggested that genome size variation along geographic gradients was often regarded as adaptive signatures (Rayburn and Auger, 1990; Bottini et al., 2000; Kang et al., 2014; Bilinski et al., 2018; van Boheemen et al., 2019). We observed a positive relationship between genome size and eastern longitude, telling that adaptive evolution may occur in Eragrostis. Not surprisingly, this kind of phenomenon has already been reported in Hieracium, Allium and Bituminaria bituminosa (Walker et al., 2006; Chrtek et al., 2009; Duchoslav et al., 2013). Overall, our global analyses highlight a likely role of climatic niches in shaping the genome size evolution of Eragrostis. The association of precipitation with the genome size variation may be indicative of the widespread occurrence of Eragrostis species in arid area. However, the global dispersal of Eragrostis species is probably more complicated than we thought. Other factors such as human activities may have influenced the dispersal of Eragrostis.
The ancestors of the extant Eragrostis species originated in arid areas, indicating that drought tolerance may already be apparent in ancestral states. While large genomes were correlated with low precipitation, some species with small genomes also occurred in arid zones (e.g. E. tef, E. cilianensis, E. minor, and E. virescens). It was reported that species with small seeds and genomes had advantages in terms of plant invasion (Grotkopp et al., 2004; Lavergne et al., 2010). Indeed, E. cilianensis, E. minor and E. virescens have been used as introduced species in the livestock industry in many countries (Martini and Scholz, 1998; Peterson and Giraldo-Canas, 2012). This may be one of the explanations for the global spread of Eragrostis species, and their increasing drought tolerance ability on other lands. Furthermore, the absence of PNC in the precipitation niche variables implied that the species departed from the original habitats. The ancestral reconstruction indicated that the existing niches may come from a decrease or increase of the ancestral states in each clade. We thus hypothesize that Eragrostis species with large genome sizes or high polyploidy levels may have dispersed into new niches with even drier or wetter conditions in each clade. Repeated adaptation to similar climatic gradients has resulted in the rapid spread of invasive plants (van Boheemen et al., 2019). Therefore, species-specific adaptations to environmental changes might occur several times in Eragrostis because of complicated polyploidy history across the global area. This may explain why each clade had a similar pattern of variation for both large and small genomes from different areas. Such results were also observed in the large subfamily Bromelioideae, the most diverse clade of Bromeliaceae (Silvestro et al., 2014; Müller et al., 2019). Considering a large number of Eragrostis species are still missing in this study, more sampling is necessary to understand the environmental correlation and the global dispersal in a context of genome size evolution in Eragrostis.
To our knowledge, this is the first study to investigate the genome size variation and evolution in the genus Eragrostis. Our results suggest that an evolutionary adaptation of genome sizes, which mainly originated from complicated polyploidization history, were associated with precipitation in the genus Eragrostis across their global distribution. The significant negative correlation between the genome sizes and precipitations seemingly supports an adaptive consequence of the genome size evolution in Eragrostis. The expansion of climatic niches throughout the history and the species-specific adaptation model in genome size further confirm that the large genomes of Eragrostis species have evolved as evolutionary products in various environments. In fact, adaptations to the drought climate and other extreme environments have been proven in the cultivated species of E. tef (Assefa et al., 2015), and indeed, the slime cells around seeds were a possible explanation for Eragrostis species growing in arid habitats (Kreitschitz et al., 2009).
In summary, conservatism and adaptation seem paradoxical on the surface. Our results strongly support the view that adaptation and conservatism of genome sizes, which mainly resulted from a large number of polyploidization events, play important roles in the evolution in the genus Eragrostis. To cope with the environmental changes, as an evolutionary consequence of polyploidization, genome sizes have varied largely and evolved adaptively on one hand. On the other hand, phylogenetic conservatism of the genus may have provided a certain degree of gene flow, accelerated the drought resistance genes to be transferred across species, and finally led to a worldwide distribution of Eragrostis species in the arid area. Indeed, the mechanisms of genome size variation and evolution in Eragrostis remain largely unsolved, awaiting for the availability of several high-quality reference genomes. We hope that this study will help to understand the adaptive potentials of Eragrostis in the exploitation of arid areas, thereby promoting the crop and livestock in the future.
Data availability statement
The datasets presented in this study can be found in online repositories. The names of the repository/repositories and accession number(s) can be found in the article/Supplementary Material.
Author contributions
LG, G-RH, and YT planed and designed the research. G-RH, YT, and X-GZ conducted the experiments. G-RH analyzed the data, LG and G-RH wrote and revised the manuscript. All authors contributed to the article and approved the submitted version.
Funding
This work is supported by the Hundred Talents Program of Chinese Academy of Sciences and a start-up grant from Hainan University to LG.
Acknowledgments
We would thank Dr. Zerihun Tadele (Institute of Plant Sciences, University of Bern) for providing the materials.
Conflict of interest
The authors declare that the research was conducted in the absence of any commercial or financial relationships that could be construed as a potential conflict of interest.
Publisher’s note
All claims expressed in this article are solely those of the authors and do not necessarily represent those of their affiliated organizations, or those of the publisher, the editors and the reviewers. Any product that may be evaluated in this article, or claim that may be made by its manufacturer, is not guaranteed or endorsed by the publisher.
Supplementary material
The Supplementary Material for this article can be found online at: https://www.frontiersin.org/articles/10.3389/fpls.2023.1066925/full#supplementary-material
References
Abraham, R. (2015). Achieving food security in Ethiopia by promoting productivity of future world food tef: A review. Adv. Plants Agric. Res. 2, 45. doi: 10.15406/apar.2015.02.00045
Ackerly, D. D. (2003). Community assembly, niche conservatism, and adaptive evolution in changing environments. Int. J. Plant Sci. 164, S165–S184. doi: 10.1086/368401
Akaike, H. (1974). A new look at the statistical model identification. IEEE Trans. Automat. Contr. 19, 716–723. doi: 10.1109/TAC.1974.1100705
Alaunyte, I., Stojceska, V., Plunkett, A., Ainsworth, P., Derbyshire, E. (2012). Improving the quality of nutrient-rich teff (Eragrostis tef) breads by combination of enzymes in straight dough and sourdough breadmaking. J. Cereal Sci. 55, 22–30. doi: 10.1016/j.jcs.2011.09.005
Assefa, K., Cannarozzi, G., Girma, D., Kamies, R., Chanyalew, S., Plaza-Wüthrich, S., et al. (2015). Genetic diversity in tef [Eragrostis tef (Zucc.) trotter]. Front. Plant Sci. 6. doi: 10.3389/fpls.2015.00177
Assefa, K., Chanyalew, S., Tadele, Z. (2017). “Tef, Eragrostis tef (Zucc.) Trotter,” in Millets and sorghum: Biology and genetic improvement. Ed. Patil, J. V. (Hoboken: John Wiley & Sons Ltd), 226–266.
Ayele, M., Nguyen, H. (2000). Evaluation of amplified fragment length polymorphism markers in tef, Eragrostis tef (Zucc.) trotter, and related species. Plant Breed. 119, 403–409. doi: 10.1046/j.1439-0523.2000.00512.x
Ayele, M., Tefera, H., Assefa, K., Nguyen, H. T. (1999). Genetic characterization of two Eragrostis species using AFLP and morphological traits. Hereditas 130, 33–40. doi: 10.1111/j.1601-5223.1999.00033.x
Bai, C., Alverson, W. S., Follansbee, A., Waller, D. M. (2012). New reports of nuclear DNA content for 407 vascular plant taxa from the united states. Ann. Bot. 110, 1623–1629. doi: 10.1093/aob/mcs222
Balsamo, R., Willigen, C. V., Bauer, A., Farrant, J. (2006). Drought tolerance of selected Eragrostis species correlates with leaf tensile properties. Ann. Bot. 97, 985–991. doi: 10.1093/aob/mcl068
Barrett, R. L., Peterson, P. M., Romaschenko, K. (2020). A molecular phylogeny of Eragrostis (Poaceae: Chloridoideae: Eragrostideae): Making lovegrass monophyletic in Australia. Aust. Syst. Bot. 33, 458–476. doi: 10.1071/SB19034
Bekele, E., Lester, R. N. (1981). Biochemical assessment of the relationships of Eragrostis tef (Zucc.) trotter with some wild Eragrostis species (Gramineae). Ann. Bot. 48, 717–725. doi: 10.1093/oxfordjournals.aob.a086178
Bennett, M. D. (1987). Variation in genomic form in plants and its ecological implications. New Phytol. 106, 177–200. doi: 10.1111/j.1469-8137.1987.tb04689.x
Bennett, M. D., Leitch, I. J., Hanson, L. (1998). DNA Amounts in two samples of angiosperm weeds. Ann. Bot. 82, 121–134. doi: 10.1006/anbo.1998.0785
Bennett, M. D., Smith, J. B. (1976). Nuclear DNA amounts in angiosperms. Philos. Trans. R. Soc Lond. B Biol. Sci. 274, 227–274. doi: 10.1098/rstb.1976.0044
Bilinski, P., Albert, P. S., Berg, J. J., Birchler, J. A., Grote, M. N., Lorant, A., et al. (2018). Parallel altitudinal clines reveal trends in adaptive evolution of genome size in Zea mays. PloS Genet. 14, e1007162. doi: 10.1371/journal.pgen.1007162
Bir, S. S., Sahni, M. A. (1988). Cytomorphological studies on members of genus Eragrostis v. wolf. from punjab plain (north India). J. Cytol. Genet. 23, 118–131.
Blomberg, S. P., Garland, T., Jr., Ives, A. R. (2003). Testing for phylogenetic signal in comparative data: behavioral traits are more labile. Evolution 57, 717–745. doi: 10.1111/j.0014-3820.2003.tb00285.x
Blomberg, S. P., Lefevre, J. G., Wells, J. A., Waterhouse, M. (2012). Independent contrasts and PGLS regression estimators are equivalent. Syst. Biol. 61, 382–391. doi: 10.1093/sysbio/syr118
Blomberg, S. P., Rathnayake, S. I., Moreau, C. M. (2020). Beyond Brownian motion and the ornstein-uhlenbeck process: stochastic diffusion models for the evolution of quantitative characters. Am. Nat. 195, 145–165. doi: 10.1086/706339
Bottini, M. C. J., Greizerstein, E. J., Aulicino, M. B., Poggio, L. (2000). Relationships among genome size, environmental conditions and geographical distribution in natural populations of NW Patagonian species of Berberis L.(Berberidaceae). Ann. Bot. 86, 565–573. doi: 10.1006/anbo.2000.1218
Briga, M., Verhulst, S. (2015). Large Diurnal temperature range increases bird sensitivity to climate change. Sci. Rep. 5, 1–9. doi: 10.1038/srep16600
Brown, L. (2012). World on the edge–how to prevent environmental and economic collapse (New York, London: W. W. Norton & Company).
Buerdsell, S. L., Milligan, B. G., Lehnhoff, E. A. (2022). Extreme drought induces rapid declines in co-occurring native Bouteloua eriopoda and invasive Eragrostis lehmanniana. Ecosphere 13, e4048. doi: 10.1002/ecs2.4048
Bureš, P., Wang, Y. F., Horová, L., Suda, J. (2004). Genome size variation in central European species of Cirsium (Compositae) and their natural hybrids. Ann. Bot. 94, 353–363. doi: 10.1093/aob/mch151
Burkill, H. M. (1995). The useful plants of West tropical Africa, Vol. 3. (Richmond, UK: Royal Botanic Gardens Kew).
Burson, B. L., Voigt, P. W. (1996). Cytogenetic relationships between the Eragrostis curvula and E. lehmanniana complexes. Int. J. Plant Sci. 157, 632–637. doi: 10.1086/297384
Butler, M. A., King, A. A. (2004). Phylogenetic comparative analysis: a modeling approach for adaptive evolution. Am. Nat. 164, 683–695. doi: 10.1086/426002
Cannarozzi, G., Plaza-Wüthrich, S., Esfeld, K., Larti, S., Wilson, Y. S., Girma, D., et al. (2014). Genome and transcriptome sequencing identifies breeding targets in the orphan crop tef (Eragrostis tef). BMC Genom. 15, 1–21. doi: 10.1186/1471-2164-15-581
Cave, M. S. (1959a). Index to plant chromosome numbers for 1958 (North Carolina (NC: University of North Carolina Press).
Cave, M. S. (1959b). Index to plant chromosome numbers supplement (Berkeley: California Botanical Society).
Cave, M. S. (1962). Index to plant chromosome numbers for 1961 (Chapel Hill: Univ. of North Carolina Press).
Cheng, A. (2018). Shaping a sustainable food future by rediscovering long-forgotten ancient grains. Plant Sci. 269, 136–142. doi: 10.1016/j.plantsci.2018.01.018
Chepinoga, V. V., Aleksandr A, G., Enushchenko, I. V., Rosbakh, S. A. (2009). IAPT/IOPB chromosome data 8. Taxon 58, 1281–1314. doi: 10.1002/tax.584017
Christopher, J., Abraham, A. (1974). Studies on the cytology and phylogeny of south Indian grasses II. Sub-family Eragrostoideae. Cytologia 39, 561–571. doi: 10.1508/cytologia.39.561
Chrtek, J., Jr., Zahradníček, J., Krak, K., Fehrer, J. (2009). Genome size in Hieracium subgenus Hieracium (Asteraceae) is strongly correlated with major phylogenetic groups. Ann. Bot. 104, 161–178. doi: 10.1093/aob/mcp107
Chung, K. S., Weber, J. A., Hipp, A. L. (2011). Dynamics of chromosome number and genome size variation in a cytogenetically variable sedge (Carex scoparia var. scoparia, cyperaceae). Am. J. Bot. 98, 122–129. doi: 10.3732/ajb.1000046
Colom, M. R., Vazzana, C. (2001). Drought stress effects on three cultivars of Eragrostis curvula: photosynthesis and water relations. Plant Growth Regul. 34, 195–202. doi: 10.1023/A:1013392421117
Costanza, S. H. (1978). Literature and numerical taxonomy of t'ef (Eragrostis tef). MSc thesis (Urbana, Illinois: Cornell University).
Costanza, S. H., Dewet, J. M. J., Harlan, J. R. (1979). Literature review and numerical taxonomy of Eragrostis tef (T’ef). Econ. Bot. 33, 413–424. doi: 10.1007/BF02858337
Cox, J. R., Martin R, M., Ibarra F, F., Fourie, J. H., Rethman, N. F. G., Wilcox, D. G. (1988). The influence of climate and soils on the distribution of four African grasses. J. Range Manage. 41, 127–139. doi: 10.2307/3898948
Cufodontis, G. (1953). Enumeratio plantarum aethiopiae spermatophyta. Bull. Jard. botanique Natl. Belg. 1, 23–42. doi: 10.2307/3666938
Darlington, C. D., Wylie, A. P. (1956). Chromosome atlas of flowering plants (London: George Alien & Unwin Ltd).
Darriba, D., Posada, D., Kozlov, A. M., Stamatakis, A., Morel, B., Flouri, T. (2020). ModelTest-NG: A new and scalable tool for the selection of DNA and protein evolutionary models. Mol. Biol. Evol. 37, 291–294. doi: 10.1093/molbev/msz189
Darriba, D., Taboada, G. L., Doallo, R., Posada, D. (2012). jModelTest 2: more models, new heuristics and parallel computing. Nat. Methods 9, 772–772. doi: 10.1038/nmeth.2109
Davidse, G., Pohl, R. W. (1974). Chromosome numbers, meiotic behavior, and notes on tropical American grasses (Gramineae). Can. J. Bot. 52, 317–328. doi: 10.1139/b74-042
Degu, H. D., Ohta, M., Fujimura, T. (2008). Drought tolerance of Eragrostis tef and development of roots. Int. J. Plant Sci. 169, 768–775. doi: 10.1086/588064
de Ricqlès, A., Padian, K., Knoll, F., Horner, J. R. (2008). On the origin of high growth rates in archosaurs and their ancient relatives: Complementary histological studies on Triassic archosauriforms and the problem of a “phylogenetic signal” in bone histology. Ann. Paléontol 2, 57–76. doi: 10.1098/rspb.2011.2441
Devesa, J. A. (1990). Contribucion al conocimiento cariologico de las poaceae an extremadura II. Bull. Soci. Brot. 63, 153–205.
Doyle, J. J. (1999). Nuclear protein-coding genes in phylogeny reconstruction and homology assessment: Some examples from leguminosae. Plant Syst. Evol., 229–254. doi: 10.1201/9781439833278.ch12
Du, Y.-p., Bi, Y., Zhang, M.-f., Yang, F.-p., Jia, G.-x., Zhang, X.-h. (2017). Genome size diversity in Lilium (Liliaceae) is correlated with karyotype and environmental traits. Front. Plant Sci. 8. doi: 10.3389/fpls.2017.01303
Duchoslav, M., Šafářová, L., Jandová, M. (2013). Role of adaptive and non-adaptive mechanisms forming complex patterns of genome size variation in six cytotypes of polyploid Allium oleraceum (Amaryllidaceae) on a continental scale. Ann. Bot. 111, 419–431. doi: 10.1093/aob/mcs297
Dujardin, M., Tilquin, J. P. (1971). IOPB chromosome numbers reports XXXIII. Taxon 20, 609–614. doi: 10.1002/j.1996-8175.1978.tb03513.x
Edgar, R. C. (2004). MUSCLE: Multiple sequence alignment with high accuracy and high throughput. Nucleic Acids Res. 32, 1792–1797. doi: 10.1093/nar/gkh340
Eldredge, N. (1993). Punctuated equilibrium comes of age. Nature 366, 223–227. doi: 10.1038/366223a0
Elena, S. F., Cooper, V. S., Lenski, R. E. (1996). Response: Mechanisms of punctuated evolution. Science 274, 1749–1750. doi: 10.1126/science.274.5293.1749
Ellis, R. P. (1977). Distribution of the kranz syndrome in the southern African Eragrostoideae and panicoideae according to bundle sheath anatomy and cytology. Agroplantae 973–110.
Enke, N., Fuchs, J., Gemeinholzer, B. (2011). Shrinking genomes? Evidence from genome size variation in Crepis (Compositae). Plant Biol. 13, 185–193. doi: 10.1111/j.1438-8677.2010.00341.x
Faizullah, L., Morton, J. A., Hersch-Green, E. I., Walczyk, A. M., Leitch, A. R., Leitch, I. J. (2021). Exploring environmental selection on genome size in angiosperms. Trends Plant Sci. 26, 1039–1049. doi: 10.1016/j.tplants.2021.06.001
Faruqi, S. A., Quraish, H. B., Inamuddin, M. (1987). Studies in Libyan grasses. x. chromosome number and some interesting features. Ann. Bot. 45, 75–102.
Felsenstein, J. (1985). Phylogenies and the comparative method. Am. Nat. 125, 1–15. doi: 10.1086/284325
Femandes, A., Queiros, A. (1969). Contribution a connaissance cytotaxonomique des spermatophyta du portugal. i. gramineae. Bol. Soc Brot. 43, 20–140.
Fernandes, A. (1971). Contribution à la connaissance cytotaxinomique des spermatophyta du portugal. II. compositae. Bol. Soc Brot. 2, 5–121.
Fick, S. E., Hijmans, R. J. (2017). WorldClim 2: new 1-km spatial resolution climate surfaces for global land areas. Int. J. Climatol. 37, 4302–4315. doi: 10.1002/joc.5086
Ghukasyan, A. (2004). Extent of karyological study of Armenian grasses (Poaceae). Fl Rastitel’n Rastitel’n Resursy Armeii 15, 85–89.
Ginbot, Z. G., Farrant, J. M. (2011). Physiological response of selected Eragrostis species to water-deficit stress. Afr. J. Biotechnol. 10, 10405–10417. doi: 10.5897/AJB.9000398
Girma, D., Cannarozzi, G., Weichert, A., Tadele, Z. (2018). Genotyping by sequencing reasserts the close relationship between tef and its putative wild Eragrostis progenitors. Diversity 10, 17. doi: 10.3390/d10020017
Goldblatt, P. (1981). Index to plant chromosome numbers 1975-1978. Monogr. Syst. Bot. Missouri Bot. Gard. 5, 1–553. doi: 10.2307/2806772
Gould, F. W. (1968). Chromosome numbers of Texas grasses. Canad. J. Bot. 46, 1315–1325. doi: 10.1139/b68-175
Gould, F. W., Soderstrom, T. R. (1967). Chromosome numbers of tropical American grasses. Am. J. Bot. 54, 676–683. doi: 10.2307/2398863
Gould, F. W., Soderstrom, T. R. (1970a). Chromosome numbers of some Mexican and Colombian grasses. Canad. J. Bot. 48, 1633–1639. doi: 10.1139/b70-241
Gould, F. W., Soderstrom, T. R. (1970b). IOPB chromosome number reports XXV. Taxon 19, 104–105. doi: 10.1002/j.1996-8175.1970.tb02985.x
Gould, F. W., Soderstrom, T. R. (1974). Chromosome numbers of some Ceylon grasses. Canad. J. Bot. 52, 1075–1090. doi: 10.1139/b74-136
Gregory, T. R. (2004). Macroevolution, hierarchy theory, and the c-value enigma. Paleobiology 30, 179–202. doi: 10.1666/0094-8373(2004)030%3C0179:MHTATC%3E2.0.CO;2
Gregory, T. R. (2005). “Genome size evolution in animals,” in The evolution of the genome. Ed. Gregory, T. R. (Cambridge: Academic Press), 3–87.
Gregory, T. R., Johnston, J. S. (2008). Genome size diversity in the family drosophilidae. Heredity 101, 228–238. doi: 10.1038/hdy.2008.49
Grime, J. P., Mowforth, M. A. (1982). Variation in genome size–an ecological interpretation. Nature 299, 151–153. doi: 10.1038/299151a0
Grotkopp, E., Rejmánek, M., Sanderson, M. J., Rost, T. L. (2004). Evolution of genome size in pines (Pinus) and its life-history correlates: supertree analyses. Evolution 58, 1705–1729. doi: 10.1111/j.0014-3820.2004.tb00456.x
Guido, A., Hoss, D., Pillar, V. D. (2019). Competitive effects and responses of the invasive grass Eragrostis plana in río de la plata grasslands. Austral Ecol. 44, 1478–1486. doi: 10.1111/aec.12822
Gurushidze, M., Fuchs, J., Blattner, F. R. (2012). The evolution of genome size variation in drumstick onions (Allium subgenus Melanocrommyum). Syst. Bot. 37, 96–104. doi: 10.1600/036364412X616675
Harmon, L. J., Weir, J. T., Brock, C. D., Glor, R. E., Challenger, W. (2008). GEIGER: investigating evolutionary radiations. Bioinformatics 24, 129–131. doi: 10.1093/bioinformatics/btm538
Hilu, K. W., Alice, L. A. (2001). A phylogeny of chloridoideae (Poaceae) based on matK sequences. Syst. Bot. 26, 386–405. doi: 10.1043/0363-6445-26.2.386
Hurvich, C. M., Tsai, C. L. (1989). Regression and time series model selection in small samples. Biometrika 76, 297–307. doi: 10.1093/biomet/76.2.297
Ingram, A. L. (2010). Evolution of leaf blade anatomy in Eragrostis (Poaceae). Syst. Bot. 35, 755–765. doi: 10.1600/036364410X539844
Ingram, A. L., Doyle, J. J. (2003). The origin and evolution of Eragrostis tef (Poaceae) and related polyploids: evidence from nuclear waxy and plastid rps16. Am. J. Bot. 90, 116–122. doi: 10.3732/ajb.90.1.116
Ingram, A. L., Doyle, J. J. (2004). Is Eragrostis (Poaceae) monophyletic? insights from nuclear and plastid sequence data. Syst. Bot. 29, 545–552. doi: 10.1600/0363644041744392
Ingram, A. L., Doyle, J. J. (2007). Eragrostis (Poaceae): Monophyly and infrageneric classification. Aliso 23, 595–604. doi: 10.5642/aliso.20072301.44
JMJ, D. W. (1954). Chromosome numbers of a few south African grasses. Cytologia 19, 97–103. doi: 10.1508/cytologia.19.97
Jones, B. M. G., Ponti, J., Tavassoli, A., Dixon, P. A. (1978). Relationships of the Ethiopian cereal t′ ef (Eragrostis tef (Zucc.) trotter): evidence from morphology and chromosome number. Ann. Bot. 42, 1369–1373. doi: 10.1093/oxfordjournals.aob.a085583
Jordan, G. J., Carpenter, R. J., Koutoulis, A., Price, A., Brodribb, T. J. (2015). Environmental adaptation in stomatal size independent of the effects of genome size. New Phytol. 205, 608–617. doi: 10.1111/nph.13076
Kalendar, R., Tanskanen, J., Immonen, S., Nevo, E., Schulman, A. H. (2000). Genome evolution of wild barley (Hordeum spontaneum) by BARE-1 retrotransposon dynamics in response to sharp microclimatic divergence. Proc. Nat. Acad. Sci. 97, 6603–6607. doi: 10.1073/pnas.110587497
Kan, H., London, S. J., Chen, H., Song, G., Chen, G., Jiang, L., et al. (2007). Diurnal temperature range and daily mortality in shanghai, China. Environ. Res. 103, 424–431. doi: 10.1016/j.envres.2006.11.009
Kang, M., Tao, J., Wang, J., Ren, C., Qi, Q., Xiang, Q. Y., et al. (2014). Adaptive and nonadaptive genome size evolution in karst endemic flora of China. New Phytol. 202, 1371–1381. doi: 10.1111/nph.12726
Ketema, S. (1991). “Germplasm evaluation and breeding work on teff (Eragrostis tef),” in Plant genetic resources of Ethiopia, vol. 323 . Ed. Engels, J. M. (Cambridge: Cambridge University Press).
Ketema, S. (1997). Tef-Eragrostis tef (Zucc.) (Rome: Institute of Plant Genetics and Crop Plant Research, Gatersleben/International Plant Genetic Resources Institute).
Knight, C. A., Ackerly, D. D. (2002). Variation in nuclear DNA content across environmental gradients: A quantile regression analysis. Ecol. Lett. 5, 66–76. doi: 10.1046/j.1461-0248.2002.00283.x
Knight, C. A., Molinari, N. A., Petrov, D. A. (2005). The large genome constraint hypothesis: evolution, ecology and phenotype. Ann. Bot. 95, 177–190. doi: 10.1093/aob/mci011
Kozak, K. H., Wiens, J. J. (2010). Niche conservatism drives elevational diversity patterns in Appalachian salamanders. Am. Nat. 176, 40–54. doi: 10.1086/653031
Kreitschitz, A., Tadele, Z., Gola, E. M. (2009). Slime cells on the surface of Eragrostis seeds maintain a level of moisture around the grain to enhance germination. Seed Sci. Res. 19, 27–35. doi: 10.1017/S0960258508186287
Kumar, V. (1987). Chromosome atlas of flowering plants of the Indian subcontinent (Calcutta, India: Botanical Survey of India).
Lavergne, S., Muenke, N. J., Molofsky, J. (2010). Genome size reduction can trigger rapid phenotypic evolution in invasive plants. Ann. Bot. 105, 109–116. doi: 10.1093/aob/mcp271
Lazarides, M. (1997). A revision of Eragrostis (Eragrostideae, eleusininae, poaceae) in Australia. Aust. Syst. Bot. 10, 77–187. doi: 10.1071/SB96002
Leitch, I. J., Beaulieu, J., Cheung, K., Hanson, L., Lysak, M., Fay, M. (2007). Punctuated genome size evolution in liliaceae. J. Evol. Biol. 20, 2296–2308. doi: 10.1111/j.1420-9101.2007.01416.x
Leitch, I. J., Leitch, A. R. (2013). “Genome size diversity and evolution in land plants,” in Plant genome diversity. Ed. Leitch, I. J. (Heidelberg: Springer), 307–322.
Li, J., Wang, S., Yu, J., Wang, L., Zhou, S. (2013). A modified CTAB protocol for plant DNA extraction. Chinese Bull. Bot. 48, 72. doi: 10.3724/sp.j.1259.2013.00072
Liu, K., Wang, R., Guo, X. X., Zhang, X. J., Qu, X. J., Fan, S. J. (2021). Comparative and phylogenetic analysis of complete chloroplast genomes in Eragrostideae (Chloridoideae, poaceae). Plants 10, 109. doi: 10.3390/plants10010109
Liu, H., Ye, Q., Wiens, J. J. (2020). Climatic-niche evolution follows similar rules in plants and animals. Nat. Ecol. Evol. 4, 753–763. doi: 10.1038/s41559-020-1158-x
Losos, J. B. (2008). Phylogenetic niche conservatism, phylogenetic signal and the relationship between phylogenetic relatedness and ecological similarity among species. Ecol. Lett. 11, 995–1003. doi: 10.1111/j.1461-0248.2008.01229.x
Löve, Á. (1970). IOPB chromosome number reports. XXV. Taxon 19, 102–113. doi: 10.1002/j.1996-8175.1970.tb02985.x
Maddison, W. P., Maddison, D. R. (2019). Mesquite, version 3.6: A modular system for evolutionary analysis (Tucson: University of Arizona).
Majovsky, J. (1974). Index of chromosome numbers of Slovakian flora (part 4). Acta Fac. Rerum Nat. Univ. Comenianae Bot. 23, 1–23.
Mandak, B., Krak, K., Vit, P., Pavlikova, Z., Lomonosova, M. N., Habibi, F., et al. (2016). How genome size variation is linked with evolution within Chenopodium sensu lato. Perspect. Plant Ecol. Evol. Syst. 23, 18–32. doi: 10.1016/j.ppees.2016.09.004
Martínez-Méndez, N., Mejía, O., Ortega, J., Méndez-de la Cruz, F. (2019). Climatic niche evolution in the viviparous Sceloporus torquatus group (Squamata: Phrynosomatidae). PeerJ 6, e6192. doi: 10.7717/peerj.6192
Martini, F., Scholz, H. (1998). Eragrostis virescens j. presl (Poaceae), a new alien species for the Italian flora. Willdenowia 28, 59–63. doi: 10.3372/wi.28.2805
McSteen, P., Kellogg, E. A. (2022). Molecular, cellular, and developmental foundations of grass diversity. Science 377, 599–602. doi: 10.1126/science.abo5035
Mogensen, H. L. (1988). Exclusion of male mitochondria and plastids during syngamy in barley as a basis for maternal inheritance. Proc. Natl. Acad. Sci. 85, 2594–2597. doi: 10.1073/pnas.85.8.2594
Moinuddin, M., Vahidy, A. A., Ali, S. (1994). Chromosome counts in arundinoideae, chloridoideae, and pooideae (Poaceae) from Pakistan. Ann. Mo. Bot. Gard. 81, 784–791. doi: 10.2307/2399923
Moore, D. M. (1982). Flora europaea check-list and chromosome index (Cambridge: Cambridge University Press).
Moraes, A. P., Engel, T. B. J., Forni-Martins, E. R., de Barros, F., Felix, L. P., Cabral, J. S. (2022). Are chromosome number and genome size associated with habit and environmental niche variables? Insights from the Neotropical orchids. Ann. Bot. 130, 11–25. doi: 10.1093/aob/mcac021
Müller, L. L. B., Zotz, G., Albach, D. C. (2019). Bromeliaceae subfamilies show divergent trends of genome size evolution. Sci. Rep. 9, 1–12. doi: 10.1038/s41598-019-41474-w
Münkemüller, T., Lavergne, S., Bzeznik, B., Dray, S., Jombart, T., Schiffers, K., et al. (2012). How to measure and test phylogenetic signal. Methods Ecol. Evol. 3, 743–756. doi: 10.1111/j.2041-210X.2012.00196.x
Murin, A., Svobodova, Z., Majovsky, J., Ferakova, V. (2000). Chromosome numbers of some species of the Slovak flora. Thaiszia J. Bot. 9, 31–40.
Nirmala, A., Rao, P. N. (1981). In chromosome number reports LXX. Taxon 30, 78. doi: 10.1002/j.1996-8175.1981.tb00731.x
Nordenstam, B. (1969). Chromosome studies on south African vascular plants. Bot. Notiser 122, 398–408.
Northam, F. E., Old, R. R., Callihan, R. H. (1993). Little lovegrass (Eragrostis minor) distribution in Idaho and Washington. Weed Technol. 7, 771–775. doi: 10.1017/S0890037X00037696
Orme, D., Freckleton, R., Thomas, G., Petzoldt, T., Fritz, S., Isaac, N., et al. (2013) The caper package: comparative analysis of phylogenetics and evolution in r. Available at: http://caper.r-forge.r-project.org.
Ornduff, R. (1969). Index to plant chromosome number for 1967. Regnum Veg. 59, 1–129. doi: 10.1002/j.1996-8175.1974.tb04035.x
Otto, F. (1990). DAPI staining of fixed cells for high-resolution flow cytometry of nuclear DNA. Methods Cell Biol. 33, 105–110. doi: 10.1016/S0091-679X(08)60516-6
Özkan, H., Tuna, M., Kilian, B., Mori, N., Ohta, S. (2010). Genome size variation in diploid and tetraploid wild wheats. AoB Plants 2010, plq015. doi: 10.1093/aobpla/plq015
Pagel, M. (1997). Inferring evolutionary processes from phylogenies. Zool. Scr. 26, 331–348. doi: 10.1111/j.1463-6409.1997.tb00423.x
Pagel, M. (1999). Inferring the historical patterns of biological evolution. Nature 401, 877–884. doi: 10.1038/44766
Pagel, M., Meade, A. (2004). A phylogenetic mixture model for detecting pattern-heterogeneity in gene sequence or character-state data. Syst. Biol. 53, 571–581. doi: 10.1080/10635150490468675
Pagel, M., Venditti, C., Meade, A. (2006). Large Punctuational contribution of speciation to evolutionary divergence at the molecular level. Science 314, 119–121. doi: 10.1126/science.1129647
Pandit, M. K., White, S. M., Pocock, M. J. (2014). The contrasting effects of genome size, chromosome number and ploidy level on plant invasiveness: a global analysis. New Phytol. 203, 697–703. doi: 10.1111/nph.12799
Paradis, E., Schliep, K. (2019). Ape 5.0: An environment for modern phylogenetics and evolutionary analyses in r. Bioinformatics 35, 526–528. doi: 10.1093/bioinformatics/bty633
Paule, J., Dunkel, F. G., Schmidt, M., Gregor, T. (2018). Climatic differentiation in polyploid apomictic Ranunculus auricomus complex in Europe. BMC Ecol. 18, 1–12. doi: 10.1186/s12898-018-0172-1
Pellicer, J., Hidalgo, O., Dodsworth, S., Leitch, I. J. (2018). Genome size diversity and its impact on the evolution of land plants. Genes 9, 88. doi: 10.3390/genes9020088
Peterson, P. M., Giraldo-Canas, D. (2012). The genus Eragrostis (Poaceae: Chloridoideae) in northwestern south America (Colombia, Ecuador, and peru): Morphological and taxonomic studies. Biblioteca José Jerónimo Triana. 24, 1–195.
Peterson, P. M., Romaschenko, K., Johnson, G. (2010). A classification of the chloridoideae (Poaceae) based on multi-gene phylogenetic trees. Mol. Phylogen. Evol. 55, 580–598. doi: 10.1016/j.ympev.2010.01.018
Petrov, D. A. (2001). Evolution of genome size: New approaches to an old problem. Trends Genet. 17, 23–28. doi: 10.1016/S0168-9525(00)02157-0
Prendergast, H. D. V., Hattersley, P. W., Stone, N. E., Lazarides, M. (1986). C4 acid decarboxylation type in Eragrostis (Poaceae) patterns of variation in chloroplast position, ultrastructure and geographical distribution. Plant Cell Environ. 9, 333–344. doi: 10.1111/1365-3040.ep11611719
Price, H. J., Bachmann, K. (1975). DNA Content and evolution in the microseridinae. Am. J. Bot. 62, 262–267. doi: 10.1002/j.1537-2197.1975.tb12352.x
Pyšek, P., Skálová, H., Čuda, J., Guo, W. Y., Suda, J., Doležal, J., et al. (2018). Small genome separates native and invasive populations in an ecologically important cosmopolitan grass. Ecology 99, 79–90. doi: 10.1002/ecy.2068
Qiu, F., Baack, E. J., Whitney, K. D., Bock, D. G., Tetreault, H. M., Rieseberg, L. H., et al. (2019). Phylogenetic trends and environmental correlates of nuclear genome size variation in Helianthus sunflowers. New Phytol. 221, 1609–1618. doi: 10.1111/nph.15465
Rajbhandari, K. R., Bhatt, G. D., Chhetri, R., Gajurel, J. P. (2016). Eragrostis cilianensis (Poaceae), a new record for Nepal. Plant Resour 38, 12–13.
Rayburn, A. L., Auger, J. (1990). Genome size variation in Zea mays ssp. mays adapted to different altitudes. Theor. Appl. Genet. 79, 470–474. doi: 10.1007/BF00226155
Reeder, J. R. (1971). Notes on Mexican grasses IX. miscellaneous chromosome numbers–3. Brittonia 23, 105–117. doi: 10.2307/2805426
Revell, L. J. (2010). Phylogenetic signal and linear regression on species data. Methods Ecol. Evol. 1, 319–329. doi: 10.1111/j.2041-210X.2010.00044.x
Revell, L. J. (2012). Phytools: An r package for phylogenetic comparative biology (and other things). Methods Ecol. Evol. 3, 217–223. doi: 10.1111/j.2041-210X.2011.00169.x
Roberts, J., Florentine, S., van Etten, E., Turville, C. (2021). Germination biology of four climatically varied populations of the invasive species African lovegrass (Eragrostis curvula). Weed Sci. 69, 210–218. doi: 10.1017/wsc.2020.99
Ronquist, F., Teslenko, M., van der Mark, P., Ayres, D. L., Darling, A., Höhna, S., et al. (2012). MrBayes 3.2: efficient Bayesian phylogenetic inference and model choice across a large model space. Syst. Biol. 61, 539–542. doi: 10.1093/sysbio/sys029
Roodt, R., Spies, J. J. (2002). Chromosome studies on African plants. 18. the subfamily chloridoideae. Bothalia 32, 240–249.
Roodt, R., Spies, J. J. (2003a). Chromosome studies in the grass subfamily chloridoideae. i. basic chromosome numbers. Taxon 52, 557–583. doi: 10.2307/3647454
Roodt, R., Spies, J. J. (2003b). Chromosome studies in the grass subfamily chloridoideae. II. an analysis of polyploidy. Taxon 52, 736–746. doi: 10.2307/4135546
Rozas, J., Ferrer-Mata, A., Sánchez-DelBarrio, J. C., Guirao-Rico, S., Librado, P., Ramos-Onsins, S. E., et al. (2017). DnaSP 6: DNA sequence polymorphism analysis of large data sets. Mol. Biol. Evol. 34, 3299–3302. doi: 10.1093/molbev/msx248
Salem, B. B. (1989). “Arid zone forestry: A guide for field technicians,” in FAO conservation guide, vol. 20 . Ed. Marui, H. (Rome: Food and Agriculture Organization of the United Nations).
Sasaki, T. (2005). The map-based sequence of the rice genome. Nature 436, 793–800. doi: 10.1038/nature03895
Senzota, R. B. M. (1982). The habitat and food habits of the grass rats (Arvicanthis niloticus) in the Serengeti national park, Tanzania. Afr. J. Ecol. 20, 241–252. doi: 10.1111/j.1365-2028.1982.tb00300.x
Sherif, A. S., Smith, E. B., Hornberger, K. L. (1983). In IOPB chromosome number reports LXXX. Taxon 32, 508. doi: 10.1002/J.1996-8175.1983.TB03622.X
Silvestro, D., Zizka, G., Schulte, K. (2014). Disentangling the effects of key innovations on the diversification of bromelioideae (Bromeliaceae). Evolution 68, 163–175. doi: 10.1111/evo.12236
Šmarda, P., Bureš, P., Horová, L., Leitch, I. J., Mucina, L., Pacini, E., et al. (2014). Ecological and evolutionary significance of genomic GC content diversity in monocots. Proc. Natl. Acad. Sci. 111, E4096–E4102. doi: 10.1073/pnas.1321152111
Soltis, D. E., Mavrodiev, E. V., Doyle, J. J., Rauscher, J., Soltis, P. S. (2008). ITS and ETS sequence data and phylogeny reconstruction in allopolyploids and hybrids. Syst. Bot. 33, 7–20. doi: 10.1600/036364408783887401
Somaratne, Y., Guan, D. L., Abbood, N. N., Zhao, L., Wang, W. Q., Xu, S. Q. (2019). Comparison of the complete Eragrostis pilosa chloroplast genome with its relatives in eragrostideae (Chloridoideae; poaceae). Plants 8, 485. doi: 10.3390/plants8110485
Souza, G., Costa, L., Guignard, M. S., Van-Lume, B., Pellicer, J., Gagnon, E., et al. (2019). Do tropical plants have smaller genomes? Correlation between genome size and climatic variables in the caesalpinia group (Caesalpinioideae, leguminosae). Perspect. Plant Ecol. Evol. Syst. 38, 13–23. doi: 10.1016/j.ppees.2019.03.002
Spies, J. J., Jonker, A. (1987). Chromosome studies on African plants. 4. Bothalia 17, 135–136. doi: 10.4102/abc.v17i1.1023
Spies, J. J., van der Merwe, E., Du Plessis, H., Saayman, E. J. L. (1991). Basic chromosome numbers and polyploid levels in some south African and Australian grasses (Poaceae). Bothalia 21, 163–170. doi: 10.4102/abc.v21i2.882
Tateoka, T., Löve, A. (1967). In IOPB chromosome number reports XIV. Taxon 16, 552–571. doi: 10.1002/j.1996-8175.1967.tb02139.x
Tavassoli, A. (1986). The cytology of Eragrostis with special reference to E. tef and its relatives. PhD thesis (UK: University of London, Royal Holloway and Bedford New College).
Team, R. C. (2013). R: A language and environment for statistical computing (Vienna: R Foundation for Statistical Computing).
Tefera, H., Belay, G., Sorrells, M. (2001). Narrowing the rift. tef research and development (Addis Ababa, Ethiopia: Ethiopian Agricultural Research Organization).
Tomato Genome Consortium (2012). The tomato genome sequence provides insights into fleshy fruit evolution. Nature 485, 635. doi: 10.1038/nature11119
Torrell, M., Vallès, J. (2001). Genome size in 21 Artemisia l. species (Asteraceae, anthemideae): Systematic, evolutionary, and ecological implications. Genome 44, 231–238. doi: 10.1139/g01-004
Trávníček, P., Čertner, M., Ponert, J., Chumová, Z., Jersáková, J., Suda, J. (2019). Diversity in genome size and GC content shows adaptive potential in orchids and is closely linked to partial endoreplication, plant life-history traits and climatic conditions. New Phytol. 224, 1642–1656. doi: 10.1111/nph.15996
van Boheemen, L. A., Atwater, D. Z., Hodgins, K. A. (2019). Rapid and repeated local adaptation to climate in an invasive plant. New Phytol. 222, 614–627. doi: 10.1111/nph.15564
VanBuren, R., Man Wai, C., Wang, X., Pardo, J., Yocca, A. E., Wang, H., et al. (2020). Exceptional subgenome stability and functional divergence in the allotetraploid Ethiopian cereal teff. Nat. Commun. 11, 1–11. doi: 10.1038/s41467-020-14724-z
Van den Borre, A., Watson, L. (1994). The infrageneric classification of Eragrostis (Poaceae). Taxon 43, 383–422. doi: 10.2307/1222716
Vinogradov, A. E. (2003). Selfish DNA is maladaptive: evidence from the plant red list. Trends Genet. 19, 609–614. doi: 10.1016/j.tig.2003.09.010
Voigt, P. M., Burson, B. L., Sherman, R. A. (1992). Mode of reproduction in cytotypes of lehmann lovegrass. Crop Sci. 32, 118–121. doi: 10.2135/cropsci1992.0011183X003200010026x
Vuong, Q. H. (1989). Likelihood ratio tests for model selection and non-nested hypotheses. Econometrica 57, 307–333. doi: 10.2307/1912557
Wakamiya, I., Newton, R. J., Johnston, J. S., Price, H. J. (1993). Genome size and environmental factors in the genus Pinus. Am. J. Bot. 80, 1235–1241. doi: 10.1002/j.1537-2197.1993.tb15360.x
Walker, D. J., Moñino, I., Correal, E. (2006). Genome size in Bituminaria bituminosa (L.) CH stirton (Fabaceae) populations: Separation of “true” differences from environmental effects on DNA determination. Environ. Exp. Bot. 55, 258–265. doi: 10.1016/j.envexpbot.2004.11.005
Wang, W., Kerstetter, R. A., Michael, T. P. (2011). Evolution of genome size in duckweeds (Lemnaceae). J. Bot. 2011, 570319. doi: 10.1155/2011/570319
Wang, N., McAllister, H. A., Bartlett, P. R., Buggs, R. J. (2016). Molecular phylogeny and genome size evolution of the genus Betula (Betulaceae). Ann. Bot. 117, 1023–1035. doi: 10.1093/aob/mcw048
Watt, J. M., Breyer-Brandwijk, M. G. (1962). The medicinal and poisonous plants of southern and Eastern Africa (Edinburgh: E. & S. Livingstone Ltd).
Weiss-Schneeweiss, H., Greilhuber, J., Schneeweiss, G. M. (2006). Genome size evolution in holoparasitic Orobanche (Orobanchaceae) and related genera. Am. J. Bot. 93, 148–156. doi: 10.3732/ajb.93.1.148
Wen, J., Nie, Z.-L., Soejima, A., Meng, Y. (2007). Phylogeny of vitaceae based on the nuclear GAI1 gene sequences. Botany 85, 731–745. doi: 10.1139/B07-071
Whitney, K. D., Baack, E. J., Hamrick, J. L., Godt, M. J. W., Barringer, B. C., Bennett, M. D., et al. (2010). A role for nonadaptive processes in plant genome size evolution? Evolution 64, 2097–2109. doi: 10.1111/j.1558-5646.2010.00967.x
Wiens, J. J., Ackerly, D. D., Allen, A. P., Anacker, B. L., Buckley, L. B., Cornell, H. V., et al. (2010). Niche conservatism as an emerging principle in ecology and conservation biology. Ecol. Lett. 13, 1310–1324. doi: 10.1111/j.1461-0248.2010.01515.x
Wiens, J. J., Graham, C. H. (2005). Niche conservatism: Integrating evolution, ecology, and conservation biology. Annu. Rev. Ecol. Evol. Syst. 36, 519–539. doi: 10.1146/annurev.ecolsys.36.102803.095431
Witherspoon, J. T. (1975). A numerical taxonomic study of the eragrostis intermedia complex (Poaceae) (Montana: University of Montana).
Wróbel, A., Klichowska, E., Baiakhmetov, E., Nowak, A., Nobis, M. (2021). Invasion of Eragrostis albensis in central Europe: Distribution patterns, taxonomy and phylogenetic insight into the Eragrostis pilosa complex. Biol. Invasions 23, 2305–2327. doi: 10.1007/s10530-021-02507-6
Keywords: genome size, phylogeny, Eragrostis, adaptation, environmental factors
Citation: Hutang G-R, Tong Y, Zhu X-G and Gao L-Z (2023) Genome size variation and polyploidy prevalence in the genus Eragrostis are associated with the global dispersal in arid area. Front. Plant Sci. 14:1066925. doi: 10.3389/fpls.2023.1066925
Received: 27 October 2022; Accepted: 28 February 2023;
Published: 13 March 2023.
Edited by:
Petr Smýkal, Palacký University in Olomouc, CzechiaReviewed by:
Ashley N. Egan, Utah Valley University, United StatesDavid Kopecký, Academy of Sciences of the Czech Republic, Czechia
Copyright © 2023 Hutang, Tong, Zhu and Gao. This is an open-access article distributed under the terms of the Creative Commons Attribution License (CC BY). The use, distribution or reproduction in other forums is permitted, provided the original author(s) and the copyright owner(s) are credited and that the original publication in this journal is cited, in accordance with accepted academic practice. No use, distribution or reproduction is permitted which does not comply with these terms.
*Correspondence: Li-Zhi Gao, Lgaogenomics@163.com