 Ya-Ping Chen1
 Alan J. Paton
 Purayidathkandy Sunojkumar
 Lian-Ming Gao
 Chun-Lei Xiang
- 1CAS Key Laboratory for Plant Diversity and Biogeography of East Asia, Kunming Institute of Botany, Chinese Academy of Sciences, Kunming, China
- 2Royal Botanic Gardens, Kew, Richmond, United Kingdom
- 3Department of Botany, University of Calicut, Thenhipalam, Kerala, India
- 4Lijiang Forest Biodiversity National Observation and Research Station, Kunming Institute of Botany, Chinese Academy of Sciences, Lijiang, China
As one of the largest genera of Lamiaceae and of great medicinal importance, Isodon is also phylogenetically and taxonomically recalcitrant largely ascribed to its recent rapid radiation in the Hengduan Mountains. Previous molecular phylogenetic studies using limited loci have only successfully resolved the backbone topology of the genus, but the interspecific relationships suffered from low resolution, especially within the largest clade (Clade IV) which comprises over 80% species. In this study, we attempted to further elucidate the phylogenetic relationships within Isodon especially Clade IV using plastome sequences with a broad taxon sampling of ca. 80% species of the genus. To reduce systematic errors, twelve different plastome data sets (coding and non-coding regions with ambiguously aligned regions and saturated loci removed or not) were employed to reconstruct phylogeny using maximum likelihood and Bayesian inference. Our results revealed largely congruent topologies of the 12 data sets and recovered major lineages of Isodon consistent with previous studies, but several incongruences are also found among these data sets and among single plastid loci. Most of the shallow nodes within Clade IV were resolved with high support but extremely short branch lengths in plastid trees, and showed tremendous conflicts with the nrDNA tree, morphology and geographic distribution. These incongruences may largely result from stochasticity (due to insufficient phylogenetic signal) and hybridization and plastid capture. Therefore, the uniparental-inherited plastome sequences are insufficient to disentangle relationships within a genus which has undergone recent rapid diversification. Our findings highlight a need for additional data from nuclear genome to resolve the relationships within Clade IV and more focused studies to assess the influences of multiple processes in the evolutionary history of Isodon. Nevertheless, the morphology of the shape and surface sculpture/indumentum of nutlets is of systematic importance that they can distinguish the four major clades of Isodon.
Introduction
Isodon (Schrad. ex Benth.) Spach (Ocimeae, Nepetoideae, Lamiaceae) consists of approximately 100 species, mostly occurring in subtropical to tropical Asia, with two endemic species disjunctly distributed in tropical Africa (Li, 1988; Li and Hedge, 1994; Paton et al., 2009). It is most diverse in southwest China, particularly in the dry valleys of the global biodiversity hotspot Hengduan Mountains (HM), which is considered as the distribution center of the genus (Zhong et al., 2010; Yu et al., 2014; Chen et al., 2019). As a member of the monotypic subtribe Isodoninae established by Zhong et al. (2010), Isodon differs from other genera of Ocimeae by the following set of characters: perennial herbs, subshrubs or shrubs, pedunculate and bracteolate cymes, actinomorphic or two-lipped (3/2) calyces, strongly two-lipped (4/1) corollas, and free filaments inserted at the base of the corolla tubes (Wu and Li, 1977; Li, 1988; Paton and Ryding, 1998; Harley et al., 2004). In a worldwide revision of Isodon, Li (1988) divided the genus into four sections – sect. Pyramidium (Benth.) H.W. Li (7 spp.), sect. Amethystoides (Benth.) H.W. Li (7 spp.), sect. Isodon (91 spp.), and sect. Melissoides (Benth.) H.W. Li (6 spp.) – based on the types of inflorescence, and morphology of fruiting calyx (erect vs. decurved, actinomorphic vs. two-lipped) and corolla tube (saccate vs. gibbous to shortly calcarate on upper side near base). Ten series were further delimited within the largest section (sect. Isodon) by Li (1988).
Some species of Isodon [e.g., I. eriocalyx (Dunn) Kudô, I. japonicus (Burm. f.) H. Hara, I. rubescens (Hemsl.) H. Hara] have long been used as traditional folk medicine in China and Japan and the genus is abundant in diterpenoids with diverse structural scaffolds and important pharmaceutical functions (Sun et al., 2006; Liu et al., 2017). But despite its apparent value to medicine and understanding of the evolutionary history of the HM flora, several large gaps in our understanding of the taxonomy and systematics of Isodon remain and restrict our ability to effectively communicate its infrageneric taxonomic units.
Isodon species are well-known for being difficult to identify, with either diagnostic characters too variable and/or obscure, or having been provided with incomplete descriptions due to a lack of sufficient specimens and/or field investigations (Chen et al., 2019). Low phylogenetic resolution of the infrageneric relationships within Isodon from previous molecular phylogenetic studies (Zhong et al., 2010; Yu et al., 2014; Chen et al., 2019) also hampers our ability to assemble a comprehensive and intelligible taxonomy for the genus. Using limited molecular markers, all these studies consistently revealed that Asian Isodon can be divided into three strongly supported clades and the relationships within the largest clade which includes more than 80% species of the genus were scarcely resolved with weak to non-existent support. The analyses by Yu et al. (2014) also provided support for a clade of two endemic African species sister to the combination of three Asian clades, whose exact relationship with each other was recovered as equivocal. Moreover, these studies showed that at least three of the aforementioned four sections of Isodon proposed by Li (1988) based on the inflorescence types and fruiting calyx and corolla tube morphology were not monophyletic, whereas the color of glands on plants and leaf phyllotaxy might be of systematic significance (Zhong et al., 2010; Yu et al., 2014). The biogeographic study of Isodon (Yu et al., 2014) indicated that the genus originated in the Qinghai-Tibetan Plateau (QTP) and adjacent regions in the late Oligocene, and a rapid radiation of the genus triggered by the uplift of QTP and subsequent aridification events might have happened in the late Miocene. They also concluded that the rapid diversification followed by hybridization and introgression might have resulted in the greatest diversity of Isodon in HM and the low phylogenetic resolution within the genus (Yu et al., 2014).
Due to the low evolutionary rates, high copy number, uniparental inheritance, lack of recombination or gene duplication compared to the nuclear genome (Birky, 1995; Wicke et al., 2011; Gitzendanner et al., 2018), plastid genomes (plastomes) have been widely used for phylogenetic reconstruction at various levels during the last decade (Yu et al., 2017; Fu et al., 2019; Li et al., 2019, 2021; Xiang et al., 2020; Zhao et al., 2021b; Wang et al., 2022). Meanwhile, an increasing number of studies have demonstrated that substantial improvements in phylogenetic resolution within rapidly radiated genera can be achieved using plastome-scale data sets (e.g., Foster et al., 2018; Ji et al., 2019; Zong et al., 2019; He et al., 2021; Zhao et al., 2021a; Cao et al., 2022). However, most of these infrageneric plastid phylogenomic studies were based on limited taxon sampling, which may reduce the accuracy of phylogenetic inference (Graybeal, 1998; Hillis, 1998; Zwickl and Hillis, 2002; Heath et al., 2008).
In this study, we carried out the phylogenetic analyses of 86 taxa of Isodon using complete plastome and nuclear ribosomal DNA [nrDNA, including 26S, 18S, and 5.8S ribosomal RNA genes, and internal and external transcribed spacers (ITS and ETS)] sequences, representing the most comprehensive taxonomic sampling of the genus to date. We aimed to answer the following questions: (a) whether plastome-scale data can further resolve the shallow-level relationships within Isodon based on a comprehensive taxa sampling? (b) if there are any conflicts among different plastome data sets, among single plastid genes, and between the plastid and nrDNA data sets? What might be the causes of these incongruences?
Materials and methods
Taxon sampling
A total of 99 accessions of 86 taxa (including 80 species and six varieties) from the major distribution areas of Isodon in East Asia and Africa were sampled as ingroups, representing all recognized sections and series of Li (1988) and all four clades recovered in Yu et al. (2014). Sixteen species from 11 genera of the other six subtribes of Ocimeae were selected as outgroups. Plastomes of 106 individuals were newly generated here from genome skimming data, plus nine plastomes downloaded from GenBank. The sequences of 18S, ITS1, 5.8S, ITS2, and 26S (hereafter referred to as nrITS) were mostly assembled from the genome skimming data, with several sequences obtained by polymerase chain reaction (PCR) amplification or downloaded from GenBank. The ETS sequences generated from the same collections of about half of the species have been published before (Chen et al., 2019), thus these sequences were downloaded from the GenBank. The remaining ETS sequences were newly obtained from PCR amplification. Voucher information and GenBank accession numbers for all sequences are provided in Supplementary Table 1. Vouchers of most accessions were deposited at the Herbarium of Kunming Institute of Botany (KUN), Chinese Academy of Sciences.
DNA extraction, amplification, and sequencing
Total genomic DNA was either extracted from silica-gel dried leaves using a modified CTAB method (Doyle and Doyle, 1987) or from herbarium specimens using the DNeasy Plant Mini Kit (Tiangen Biotech, Beijing, China) according to the manufacturer’s instructions. Genomic DNA was then sheared into ca. 300 bp fragments, which were used for library construction following standard protocols (NEBNext® Ultra IITMDNA Library Prep Kit for Illumina®). Sequencing with 2 × 150 bp paired-end reads was conducted to generate approximately 2 Gb data for each accession using an Illumina HiSeq 2000 platform (Illumina, San Diego, CA, United States) at BGI Genomics (Shenzhen, Guangdong, China).
PCR mixtures and procedures for the amplification of ITS (including partial 18S, ITS1, 5.8S, ITS2, and partial 26S) and ETS followed those described in Chen et al. (2016a), using primer pairs of 17SE and 26SE (Sun et al., 1994), and ETS-B (Beardsley and Olmstead, 2002) and 18S-IGS (Baldwin and Markos, 1998) for ITS and ETS, respectively. The PCR products were purified and sequenced by the Sangon Biotech (Shanghai, China) on an ABI 3730xl DNA Analyzer (Applied Biosystems, CA, United States).
Plastome and nrDNA assembly and annotation
Adaptors and low-quality reads were removed from the raw data using Trimmomatic v.0.32 (Bolger et al., 2014) with default settings. Subsequently, the de novo assembling of clean paired-end reads was carried out using the GetOrganelle Toolkit (Jin et al., 2020), and the resulting contigs were further visualized and edited using Bandage v.0.8.1 (Wick et al., 2015). The newly assembled plastomes were initially annotated with the Plastid Genome Annotator (PGA) (Qu et al., 2019). Using the published plastome of Isodon amethystoides (Benth.) H. Hara (GenBank accession number: MT473767; Zhao et al., 2021b) as a reference, the start and stop codons and intron/exon boundaries for protein-coding genes were checked manually in Geneious v.11.0.3 (Kearse et al., 2012). Annotated tRNA genes were verified using the online tRNAscan-SE service (Chan and Lowe, 2019).
The nrITS sequences were de novo assembled from the clean data using the GetOrganelle Toolkit (Jin et al., 2020) and the annotation was carried out in Geneious by comparison with the reference sequence of Perilla frutescens (L.) Britton (GenBank accession number: KT220698; Cheon et al., 2018). For the sequences of ITS and ETS resulted from Sanger sequencing, trace files with both directions were assembled and edited using Geneious.
Sequence alignment and data set construction
The script “get_annotated_regions_from_gb.py” developed by Zhang et al. (2020) was employed to extract coding and non-coding regions from whole plastomes with one of the inverted repeats (IR) removed. Alignment of individual loci was performed with MAFFT v.7.4.0 (Katoh and Standley, 2013) using the L-INS-i algorithm and manually adjusted in MEGA 6.0 (Tamura et al., 2013). To minimize the use of loci with limited information, aligned regions less than 25 bp and the conserved rRNAs and tRNAs were excluded from analyses. A total of 207 alignments, including 80 coding genes and 127 non-coding loci, were obtained. The ITS and ETS sequences were aligned separately using the MAFFT plugin in Geneious and then manually adjusted in MEGA.
For the plastome sequences, a total of 12 data sets were generated prior to the phylogenetic reconstruction. Three basic data sets were produced initially: the CR (coding regions; the concatenated 80 coding genes), NCR (non-coding regions; the concatenated 127 non-coding loci), and CR + NCR (the concatenated CR and NCR) data sets. The script “concatenate_fasta.py” developed by Zhang et al. (2020) was used to concatenate the alignments of individual loci. To reduce the impact of misalignment, three data sets CR-GB, CR-GB, and CR + NCR-GB were constructed after using Gblocks v.0.91b (Castresana, 2000; Talavera and Castresana, 2007) to exclude ambiguously aligned regions with default parameters (“Allowed Gap Positions” = “With Half”). Loci with high levels of substitutional saturation were also identified and excluded to construct six data sets. The degree of saturation of all 207 loci was calculated using two indices determined by TreSpEx v.1.1 (Struck, 2014): the slope of the linear regression of plotting patristic distance against uncorrected p distances and the R2 fit of the data to this slope. The higher the slope and R2, the less saturated is the locus. The slope and R2 values of all loci are summarized in Supplementary Table 2, and the density plots of these values (Supplementary Figure 1) were generated using R v.4.0.5 (R Development Core Team, 2021). The threshold of the distribution of slopes for exclusion of loci was determined at the value of 0.85 (Supplementary Figure 1). Thus, three data sets (CR-Slope, NCR-Slope, CR + NCR-Slope) were produced by excluding the 72 loci (11 coding and 61 non-coding loci; Supplementary Table 2) with slopes lower than 0.85 (determined at which the distribution of the slope values increase significantly). The remaining three data sets (CR-R2, NCR-R2, CR + NCR-R2) were generated after removing the 19 loci (three coding and 16 non-coding loci; Supplementary Table 2) located on the left distribution of R2 (lower than the value of 0.90, at which the distribution of R2 began to increase; Supplementary Figure 1).
For the nuclear sequences, the nrITS and ETS regions were directly concatenated to construct the nrDNA data set.
Phylogenetic analysis
Phylogenetic reconstruction was carried out using maximum likelihood (ML) and Bayesian inference (BI) analyses for each of the 12 plastome data sets and the nrDNA data set. The best partitioning schemes and substitution models for the 12 plastome data sets were estimated by PartitionFinder2 v.2.1.1 (Lanfear et al., 2017) with the selection of all model, RAxML v.8.2.12 (Stamatakis, 2014), the rcluster algorithm (Lanfear et al., 2014), and the corrected Akaike information criterion (AICc). The nrDNA data set was partitioned by the nrITS and ETS region, and the best substitution models for each DNA locus were selected under the AIC using jModelTest 2.1.6 (Darriba et al., 2012).
Partitioned ML analysis was implemented using RAxML-HPC2 v.8.2.12 (Stamatakis, 2014) on XSEDE on the web server Cyberinfrastructure for Phylogenetic Research Science (CIPRES) Gateway (Miller et al., 2010).1 Analysis of 1,000 rapid bootstrap replicates (-x) was followed by a search for the best-scoring ML tree in a single program run (-f a), both phases using the GTRGAMMA model for nucleotide data and other parameters being the default settings.
Partitioned BI analysis was performed with MrBayes v.3.2.7a (Ronquist et al., 2012) on XSEDE on the CIPRES Gateway. The Markov chain Monte Carlo (MCMC) analyses were run for 20,000,000 generations. Stationarity was considered to be reached when the average standard deviation of split frequencies (ASDSF) fell below 0.01. Trees were sampled at every 1,000 generations with the first 25% discarded as burn-in. The remaining trees were used to build a 50% majority-rule consensus tree.
Gene trees for each of the 207 loci extracted from plastome sequences were also reconstructed using RAxML-HPC2 for 1,000 rapid bootstrap replicates and a search for the best-scoring tree.
Analyses of topological concordance
To explore the concordance/discordance among the 12 data sets of plastome, concatenated gene trees inferred by RAxML from each of the 12 data sets was iteratively used as a reference tree for mapping the remaining trees. The analyses were implemented using PhyParts (Smith et al., 2015) with all trees rooted. To minimize the effect of gene tree estimation error, bipartitions with bootstrap values lower than 70% were ignored for congruence calculations. Results were visualized using the ETE3 Python toolkit (Huerta-Cepas et al., 2016) as implemented in PhyParts_PieCharts.2 Concordance among single gene trees was also analyzed using PhyParts by mapping the RAxML trees inferred from the 207 loci against the CR + NCR-GB tree, which is the best resolved and most concordant with the remaining 11 concatenated trees. All 207 single gene trees were rooted and only bipartitions with at least 70% BS were considered informative. Finally, incongruence between the CR + NCR-GB tree and the nrDNA tree was visualized using the “tanglegram” function in Dendroscope v.3.8.2 (Huson and Scornavacca, 2012). To minimize spurious disagreement between the two trees due to estimation error, all bipartitions with lower than 50% BS were collapsed.
Morphological and geographical data collection
To test the congruence between morphological and molecular data within Isodon, morphological similarities and differences were analyzed based on our previous field investigations and specimen examination. Specimens of Isodon and related genera from 29 herbaria (A, AU, BM, CDBI, CSFI, E, G, GXMI, HHBG, HIB, IBK, IBSC, K, KUN, KYO, L, LBG, LE, MW, NAS, P, PE, S, SYS, SZ, TAI, TI, W, and WUK; abbreviations follow Thiers, 2022) were examined. The systematic significance of nutlet morphology was also investigated using light microscopy (LM) and scanning electron microscopy (SEM). Mature nutlets were collected from natural populations and herbarium collections. A total of 61 taxa of Isodon were selected (Supplementary Table 4). Except for some species where only 1–5 nutlets were available, most species were represented by 10–20 mature nutlets. Measurements and LM analysis were carried out using the Keyence VHX-6000 digital microscope (Keyence Corporation, Osaka, Japan). For SEM, nutlets were directly mounted onto stubs and sputter-coated with gold. Micromorphological observations were conducted using the Hitachi S4800 (Hitachi Ltd., Tokyo, Japan) or Zeiss EVO LS10 (Carl Zeiss NTS, Oberkochen, Germany) scanning electron microscopes at 10 kV. Terminologies used for nutlet description followed those of Budantsev and Lobova (1997) and Moon et al. (2009).
To test the congruence between geographical and molecular data within Isodon, the extant distribution data of each species was compiled from taxonomic and floristic literature (Wu and Li, 1977; Li, 1988; Murata and Yamazaki, 1993; Suddee et al., 2004; Paton et al., 2009) and herbarium records. Five biogeographic regions were delimited based on Yu et al. (2014): (A) QTP and adjacent regions; (B) tropical Asia; (C) eastern Asia; (D) Japan; (E) tropical Africa.
Results
Plastome features of Isodon
All Isodon plastomes newly assembled here displayed the typical quadripartite structure, including a large single copy (LSC) region and a small single copy (SSC) region separated by two inverted repeat (IRa and IRb) regions (Supplementary Figure 2). The complete plastomes ranged in length from 151,923 bp [I. yuennanensis (Hand.-Mazz.) H. Hara] to 152,824 bp [I. ternifolius (D. Don) Kudô] (Supplementary Figure 2 and Supplementary Table 3). The LSC regions ranged from 82,906 bp (I. yuennanensis) to 83,640 bp (I. ternifolius), the SSC regions varied between 17,532 bp [I. megathyrsus (Diels) H. Hara] and 17,729 bp [I. lophanthoides var. graciliflorus (Benth.) H. Hara], and the IR regions ranged from 25,671 bp [I. phyllopodus (Diels) Kudô] to 25,759 bp [I. rugosus (Wall. ex Benth.) Codd]. The overall GC content of the Isodon plastomes was similar and ranged from 37.5% in I. ramosissimus (Hook. f.) Codd to 37.7% in I. pharicus (Prain) Murata and I. adenanthus (Diels) Kudô (Supplementary Table 3). Plastomes of Isodon consist of a total of 114 unique genes, including 80 protein coding genes, 30 tRNA genes, and four rRNA genes, and the gene order was highly conserved (Supplementary Figure 2 and Supplementary Table 3).
Phylogenetic relationships and conflicts among data sets
The sequence characteristics of all 12 plastome data sets and the nrDNA data set were summarized in Table 1. The alignment length of the nrDNA matrix was 6,371 bp, but with the highest percentage of parsimonious-informative sites (9.65%). Among the 12 plastome data sets, the alignment length of the CR + NCR data set (129,827 bp) was the longest, and that of the NCR-Slope data set was the shortest (28,319 bp), whereas the NCR-GB data set contained the highest percentage of variable sites (15.94%) and parsimonious-informative sites (7.82%).
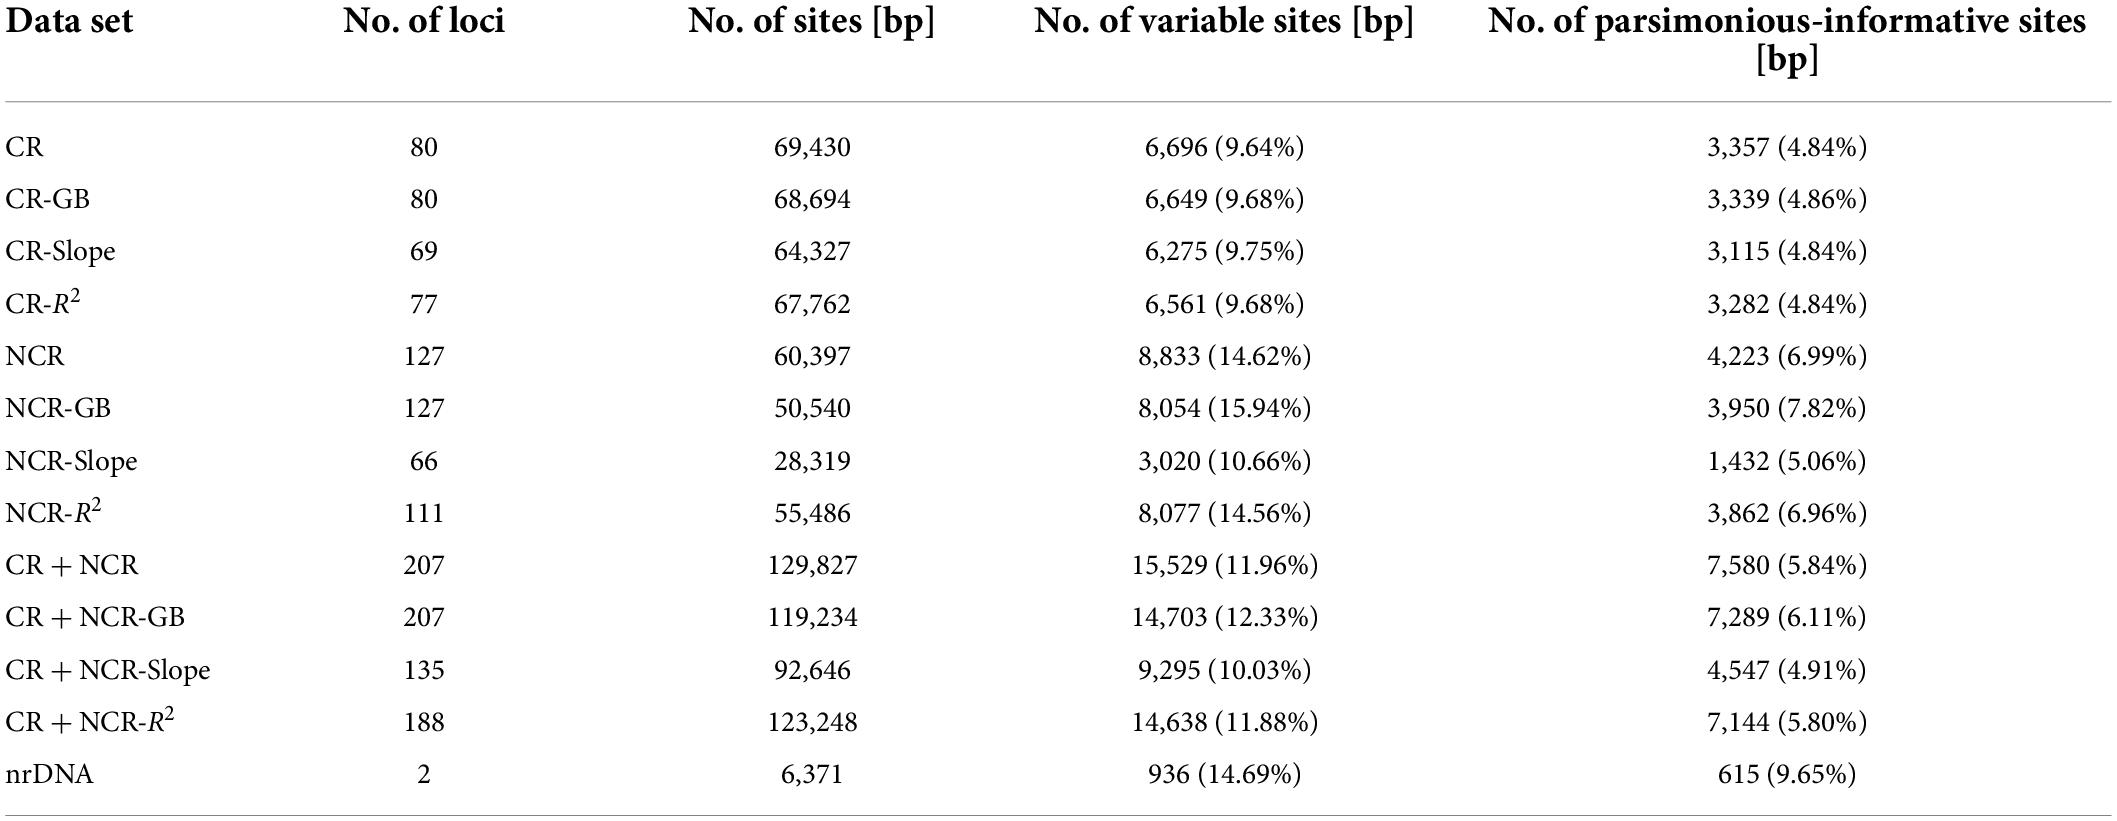
Table 1. Detailed characteristics of all plastome data sets and the combined nrDNA data set used in present study.
All 12 plastome data sets yielded almost identical tree topologies at deep nodes and exhibited largely congruent relationships at shallow nodes with some differences or conflicts (Supplementary Figure 3). For the three data sets consisting of coding and/or non-coding regions and without further treatment, the phylogenetic tree resulted from the complete plastome (CR + NCR data set) had the highest resolution, followed by the NCR and the CR data sets. Several hard incongruences can be found between the NCR tree and the CR tree, whereas these conflicting nodes in the CR + NCR tree were either collapsed into polytomies or similar to the better supported ones. After removing sites that were poorly aligned, the phylogenetic relationships and support values in the CR + NCR-GB tree and the CR-GB tree were almost unchanged (even slightly better) compared with the tree topologies prior to the treatment. However, the resolution of the NCR-GB tree was slightly poorer than that of the NCR tree, as significantly larger number of misaligned sites pruned from the NCR data set than from the CR data set (Table 1). After excluding possible saturated loci with R2 values lower than 0.90 (three coding and 16 non-coding loci), the resolution of the CR-R2 tree was largely consistent with that of CR tree, but were slightly poorer in the NCR-R2 tree and CR + NCR-R2 tree compared with the NCR tree and CR + NCR tree, respectively. Likewise, the CR-slope tree was also consistent with the CR tree after removing eleven coding loci with slope values lower than 0.85. In contrast, with nearly half (61 out of 127) of the non-coding loci excluded, the NCR-slope tree had the lowest resolution among the 12 concatenated trees. Interestingly, the support value of the sister clade of Isodon formed by ten outgroup species was improved by ambiguously aligned regions and saturated loci being removed.
The ML tree resulted from the CR + NCR-GB data set was used as the main reference tree (Figure 1), as it was the best resolved and most concordant with the remaining 11 concatenated trees. The BI tree was also consistent with the ML tree of the same data set and among the 12 data sets, therefore, only PP support values of the BI tree were superimposed together with BS support values on the nodes of the ML tree (Figure 1). Isodon was shown to be monophyletic (BS = 100%/PP = 1.00) and four major clades (Clades I–IV) were recovered within the genus. As the first diverging clade, Clade I (BS = 100%/PP = 1.00) consisted of 11 taxa which can be further divided into two strongly supported subclades. The first subclade comprised I. lophanthoides (Buch.-Ham. ex D. Don) H. Hara var. lophanthoides, I. lophanthoides var. graciliflorus, I. atroruber R.A. Clement, I. villosus Y.P. Chen and H. Peng, and I. scrophularioides (Wall. ex Benth.) Murata, and the other subclade included I. oreophilus (Diels) A.J. Paton and Ryding, I. flavidus (Hand.-Mazz.) H. Hara. I. phyllopodus, and I. yuennanensis. The next split lineage was composed of the two African endemic species I. ramosissimus and I. schimperi (Vatke) J.K. Morton (Clade II; BS = 100%/PP = 1.00). Clade III consists of the two individuals of I. ternifolius (BS = 100%/PP = 1.00), which was further sister to the largest Clade IV (BS = 100%/PP = 1.00). Despite a few shallow nodes were collapsed into polytomies or weakly supported, most of the nodes within Clade IV were resolved with robust support. However, the internal branch lengths within Clade IV were extremely short. The single gene trees were largely unresolved, with some of the loci exhibiting conflicts with the concatenated data set (Supplementary Figure 4).
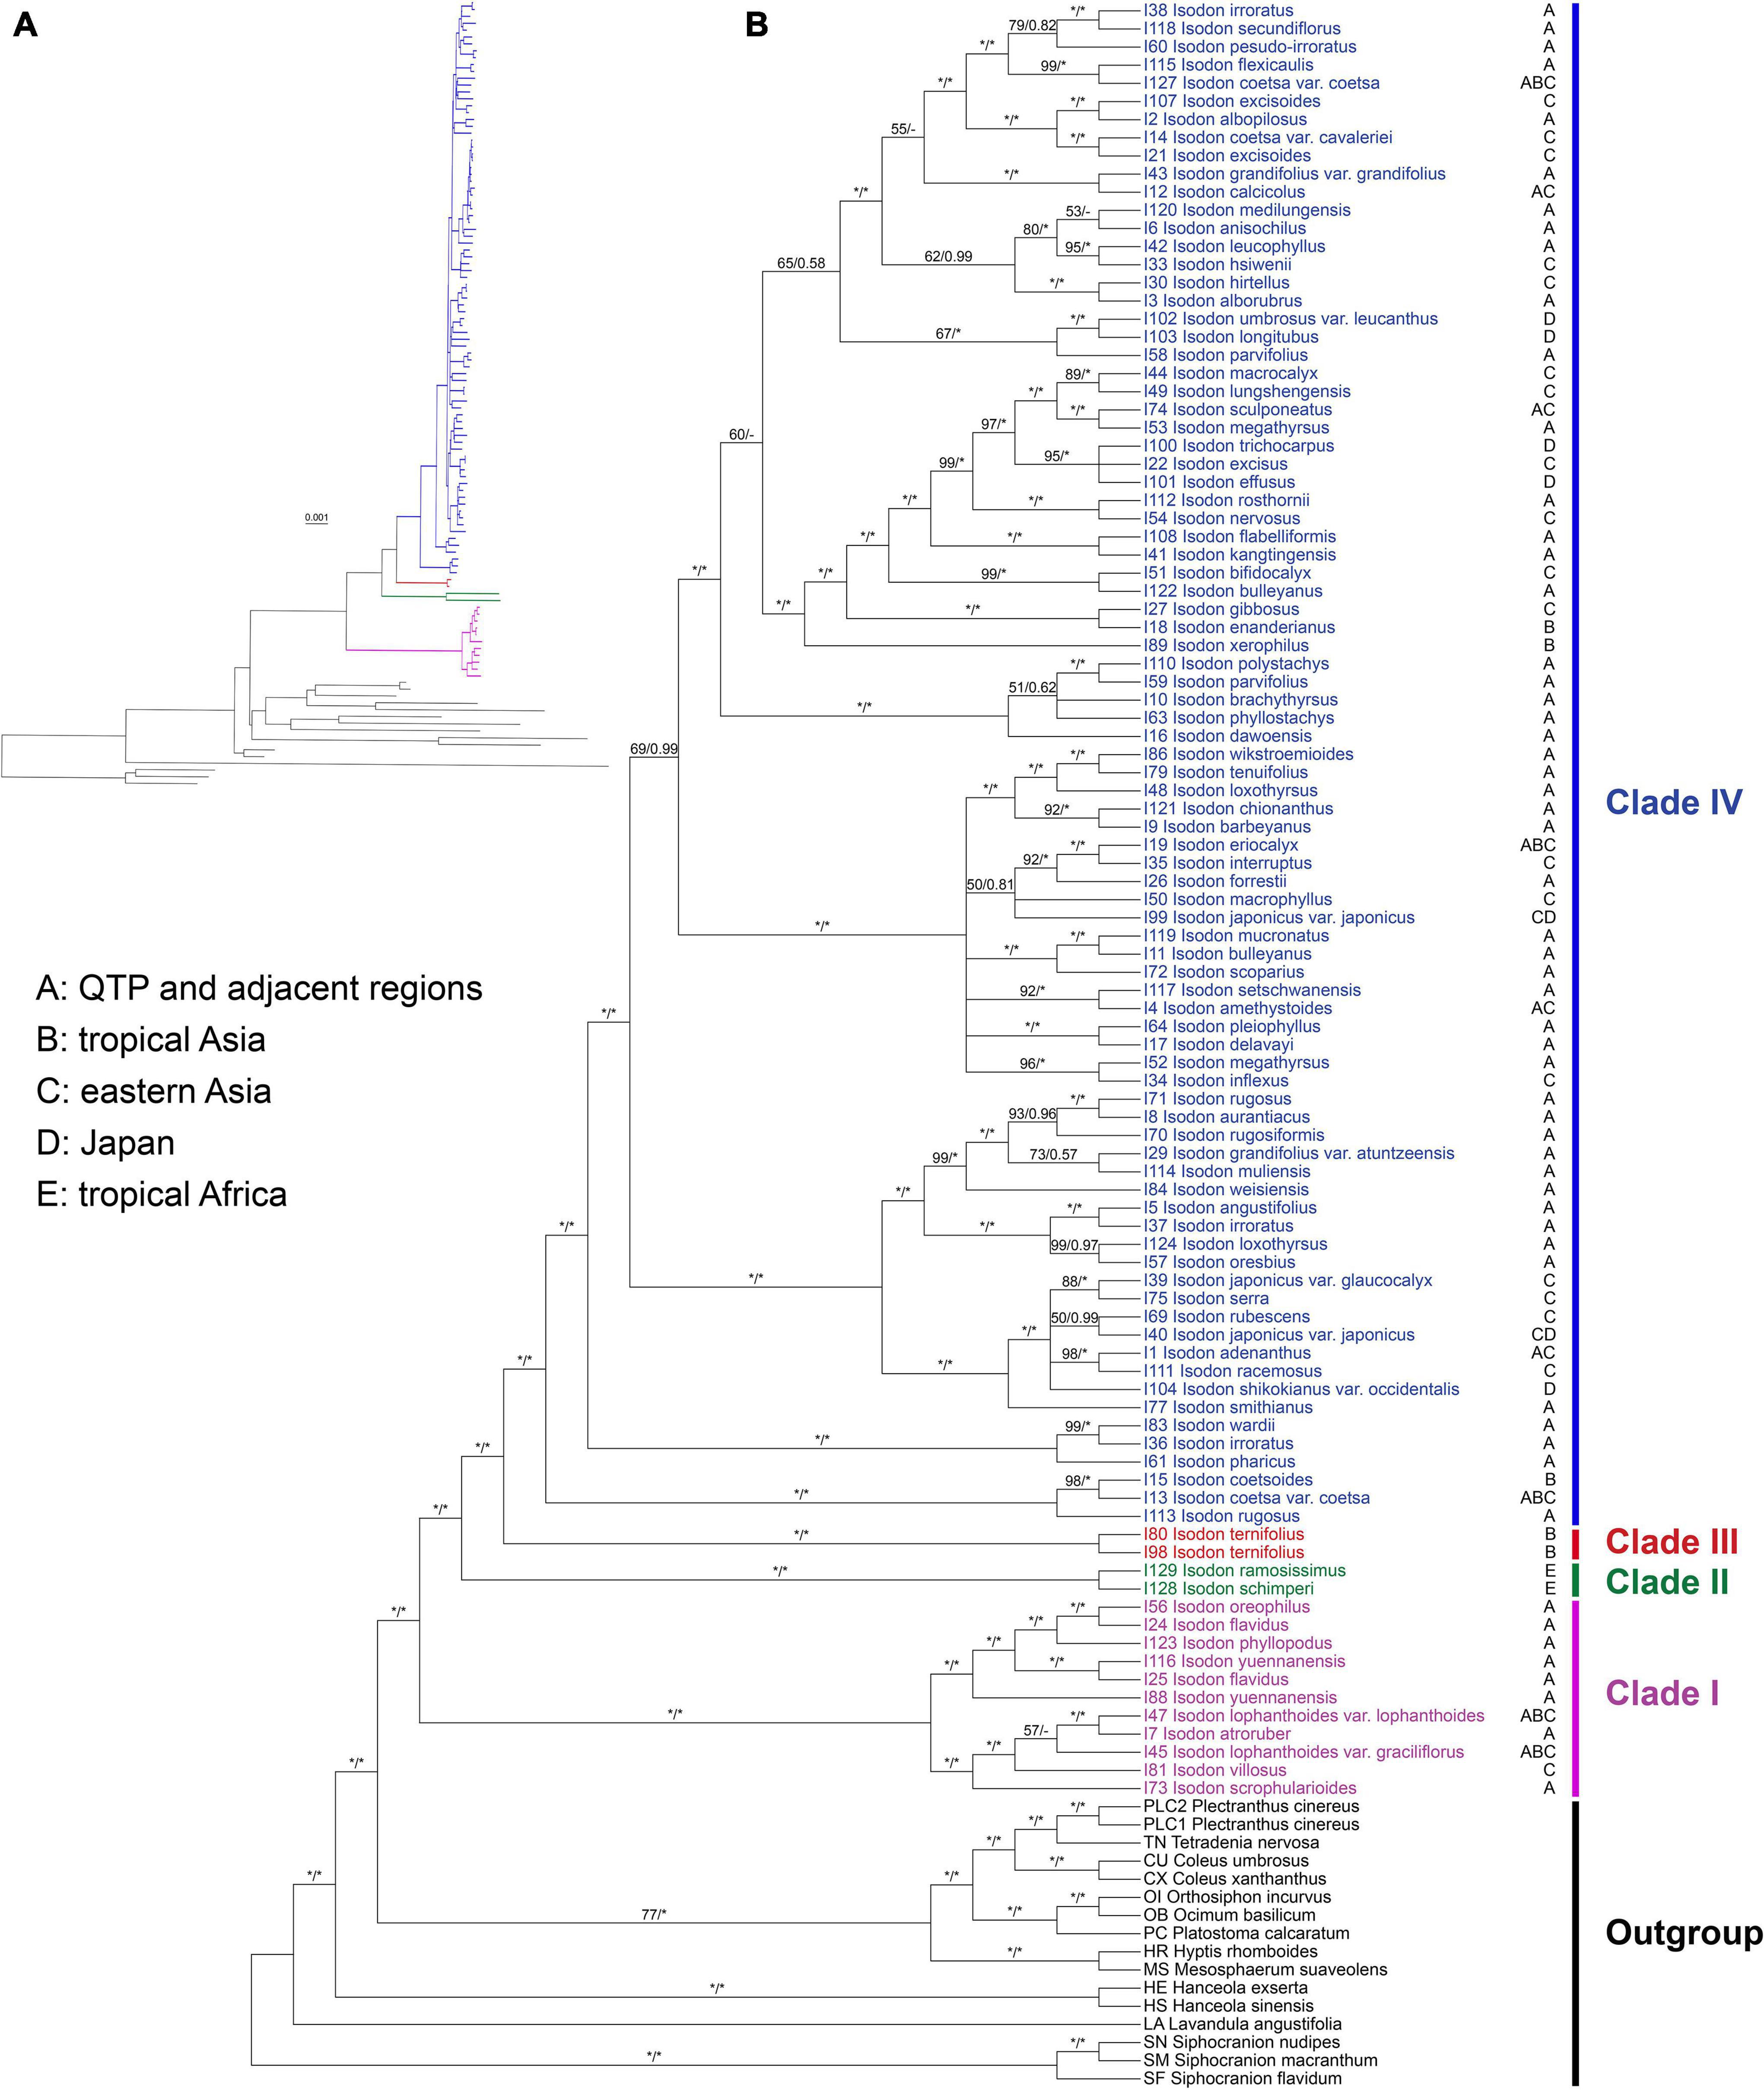
Figure 1. Cladogram (A) and phylogram (B) of the maximum-likelihood tree of Isodon derived from the plastid phylogenomic analysis of a concatenated data set including 80 coding and 127 non-coding loci with ambiguously aligned regions removed (CR + NCR-GB data set). Support values ≥ 50% BS or 0.50 PP are displayed above the branches (“*” indicates a support value = 100% BS or 1.00 PP, “–” indicates a support value < 0.50 PP). The distribution area(s) of each Isodon species is shown beside the tip and letters coding for areas follow Yu et al. (2014).
Consistent with the plastid tree, the nrDNA tree (Supplementary Figure 5) also recovered Isodon as a monophyletic group (BS = 87%/PP = 1.00) consisting of four major lineages: Clade I (BS = 96%/PP = 1.00), Clade II (BS = 100%/PP = 1.00), Clade III (BS = 100%/PP = 1.00), and Clade IV (BS = 72%/PP = 1.00). Even though the relationships within Clade IV of the nrDNA tree were almost unresolved with a large polytomy, the plastid-nuclear tanglegram demonstrated widespread discordances (Figure 2). In contrast with the plastid tree, Clade II was shown to be sister to Clade I in the nrDNA tree (BS = 89%/PP = 1.00). The placement of I. scrophularioides within Clade I also varied between the two genomic data sets that it was sister to the subclade formed by I. yuennanensis, I. flavidus, I. phyllopodus, and I. oreophilus in the nuclear tree (BS = 61%/PP = 0.87; Supplementary Figure 5). Most of the incongruences were located within Clade IV, which comprised over 80% sampled taxa of Isodon.
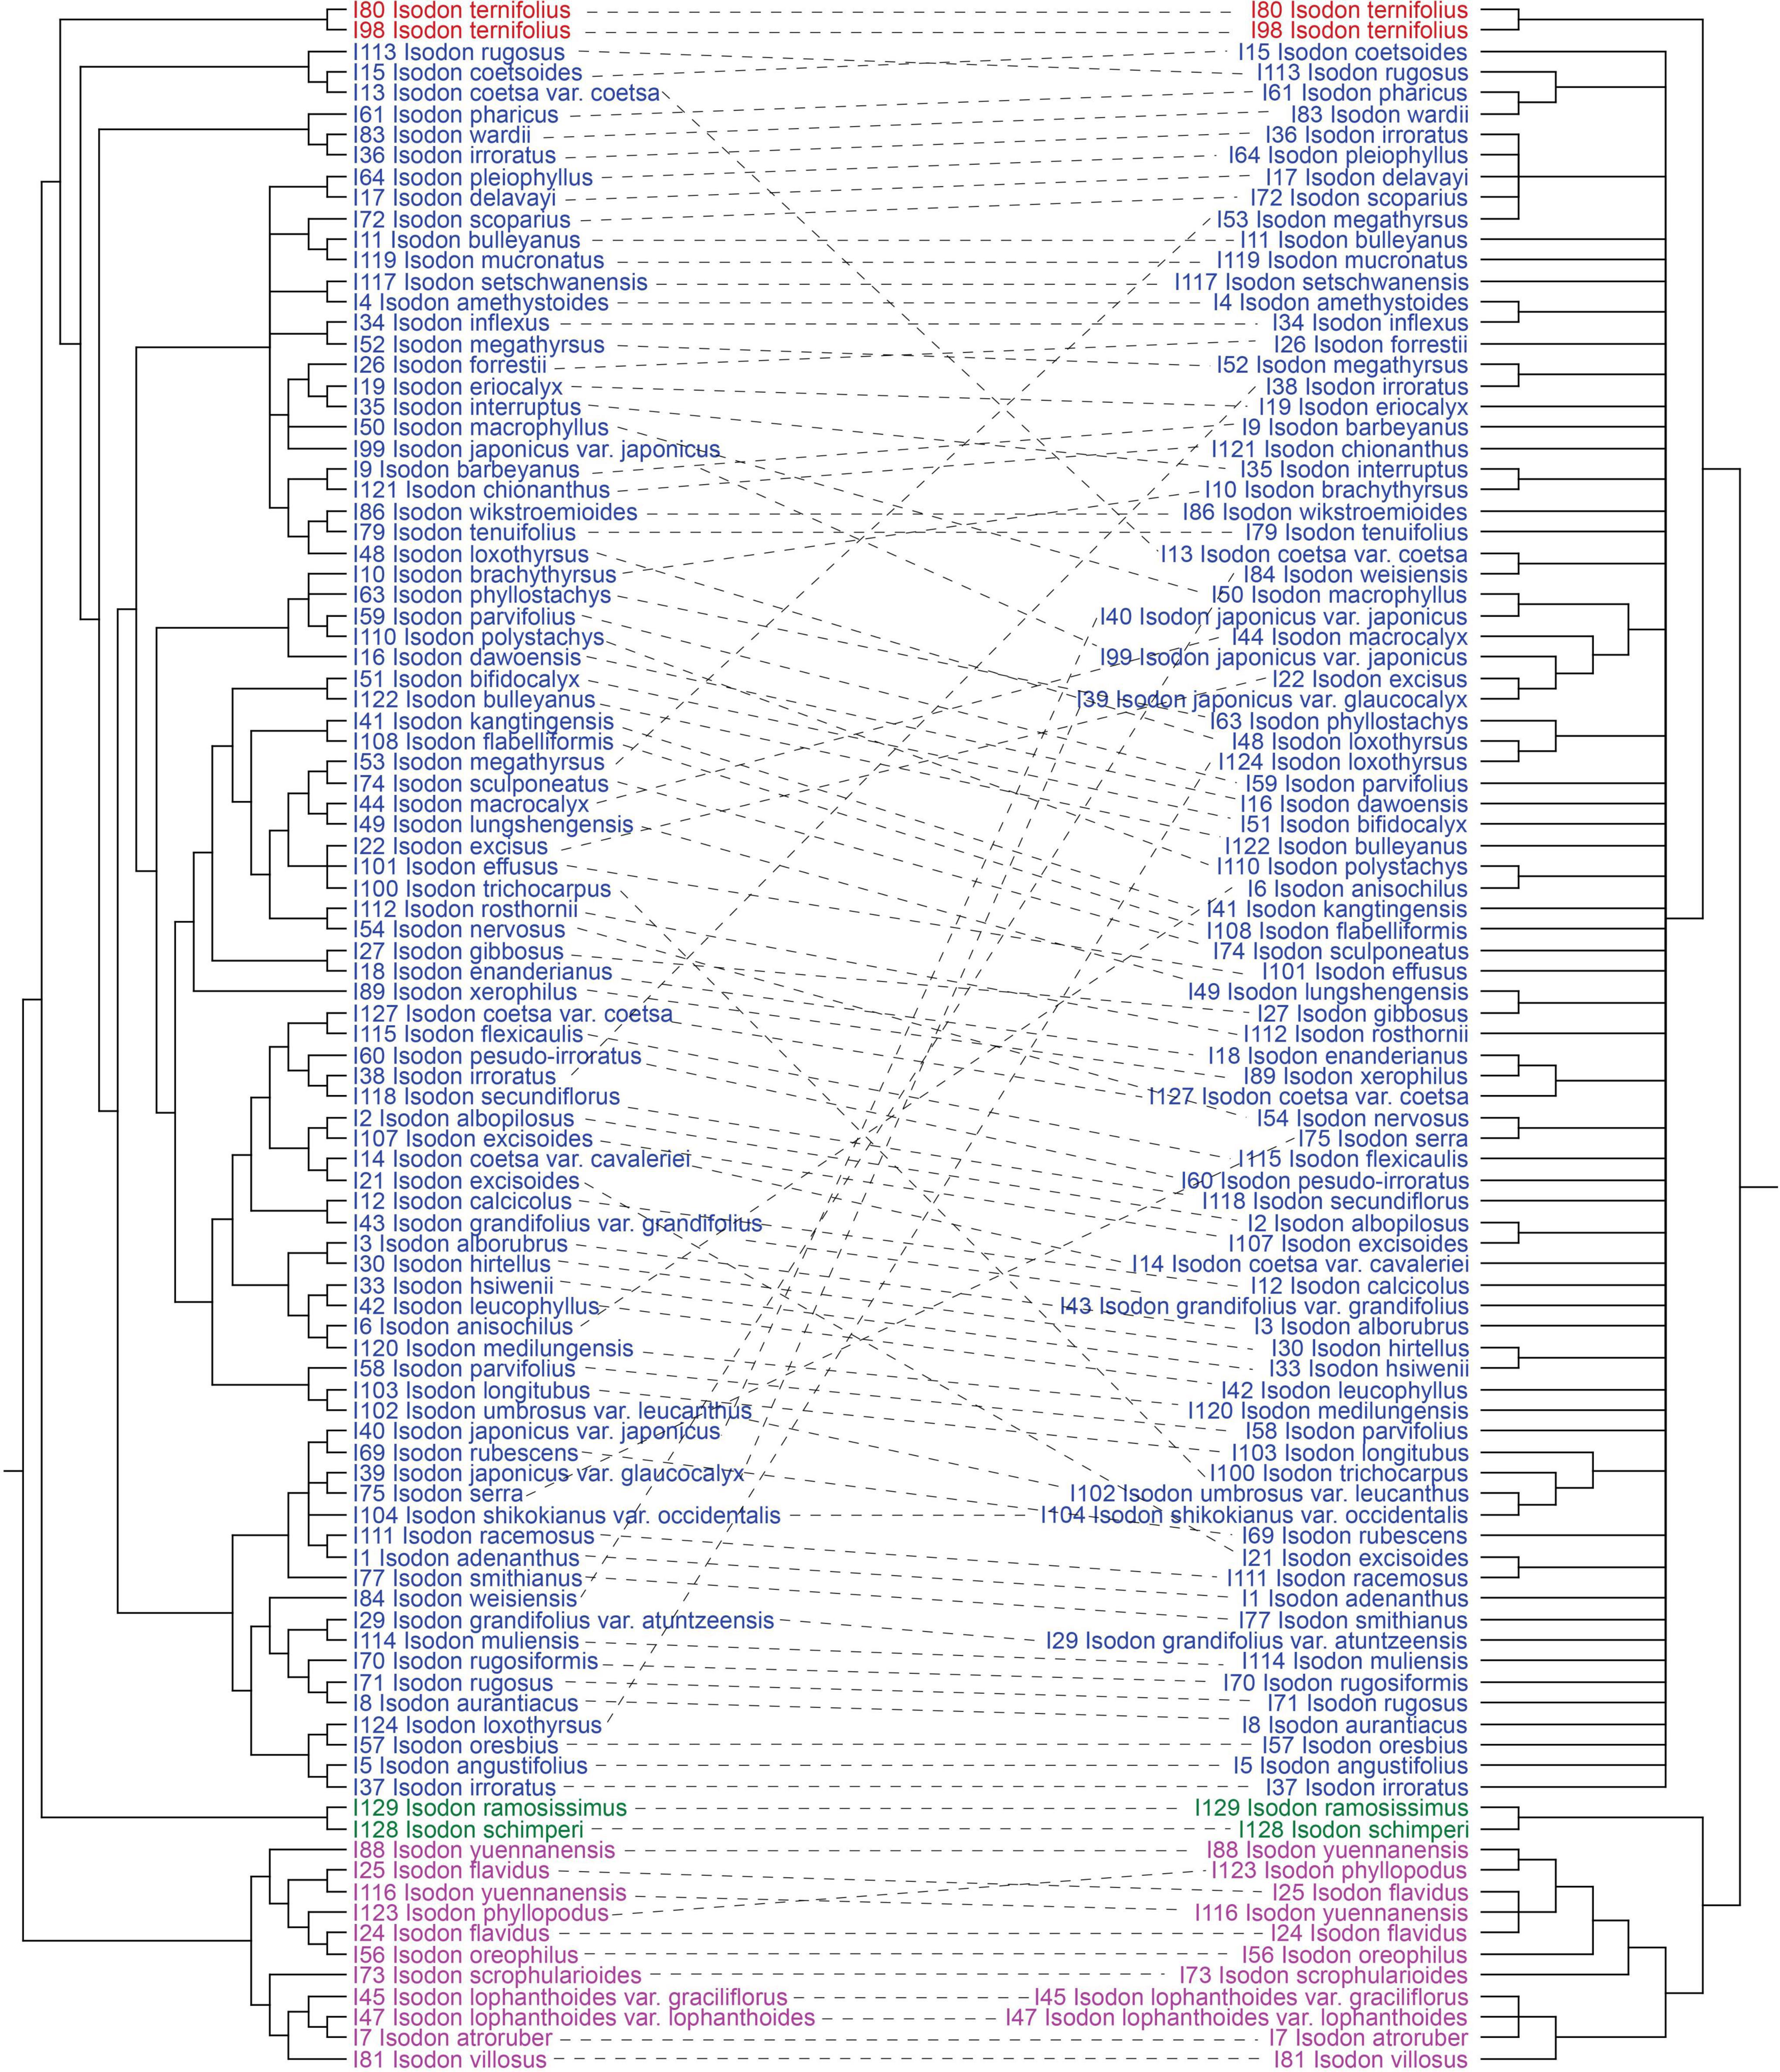
Figure 2. Tanglegram comparing plastid (maximum-likelihood tree inferred from the CR + NCR-GB data set) and nuclear (maximum-likelihood tree inferred from the nrDNA data set) trees, optimized in Dendroscope to minimize line crossings. All clades with < 50% BS have been collapsed.
Nutlet morphology of Isodon species
Nutlets of Isodon species are 0.9–2.1 mm long, 0.6–1.3 mm wide, and range from light yellow or yellowish brown to dark brown (Figure 3 and Supplementary Table 4). All species are characterized by ovate or rounded nutlets (length/width ≤ 1.8) having rounded apex (opposite to the areole area), except for I. ternifolius, which has trigonous-oblong nutlets (length/width ≥ 2) with acute apex. Six different surface types of nutlets can be recognized within Isodon, including psilate, reticulate, reticulate-papillate, striate, cellular, and glandular (and pubescent) types (Figure 4 and Supplementary Table 4). Both the psilate and reticulate types can be found in species of Clade I, and the reticulate-papillate type is confined to the two African species of Clade II. Isodon ternifolius (Clade III) has distinct nutlets with a striate surface, whereas most species of Clade IV possess nutlets with cellular surfaces. Nutlets with glandular or glandular and pubescent trichomes are only possessed by the remaining species of Clade IV.
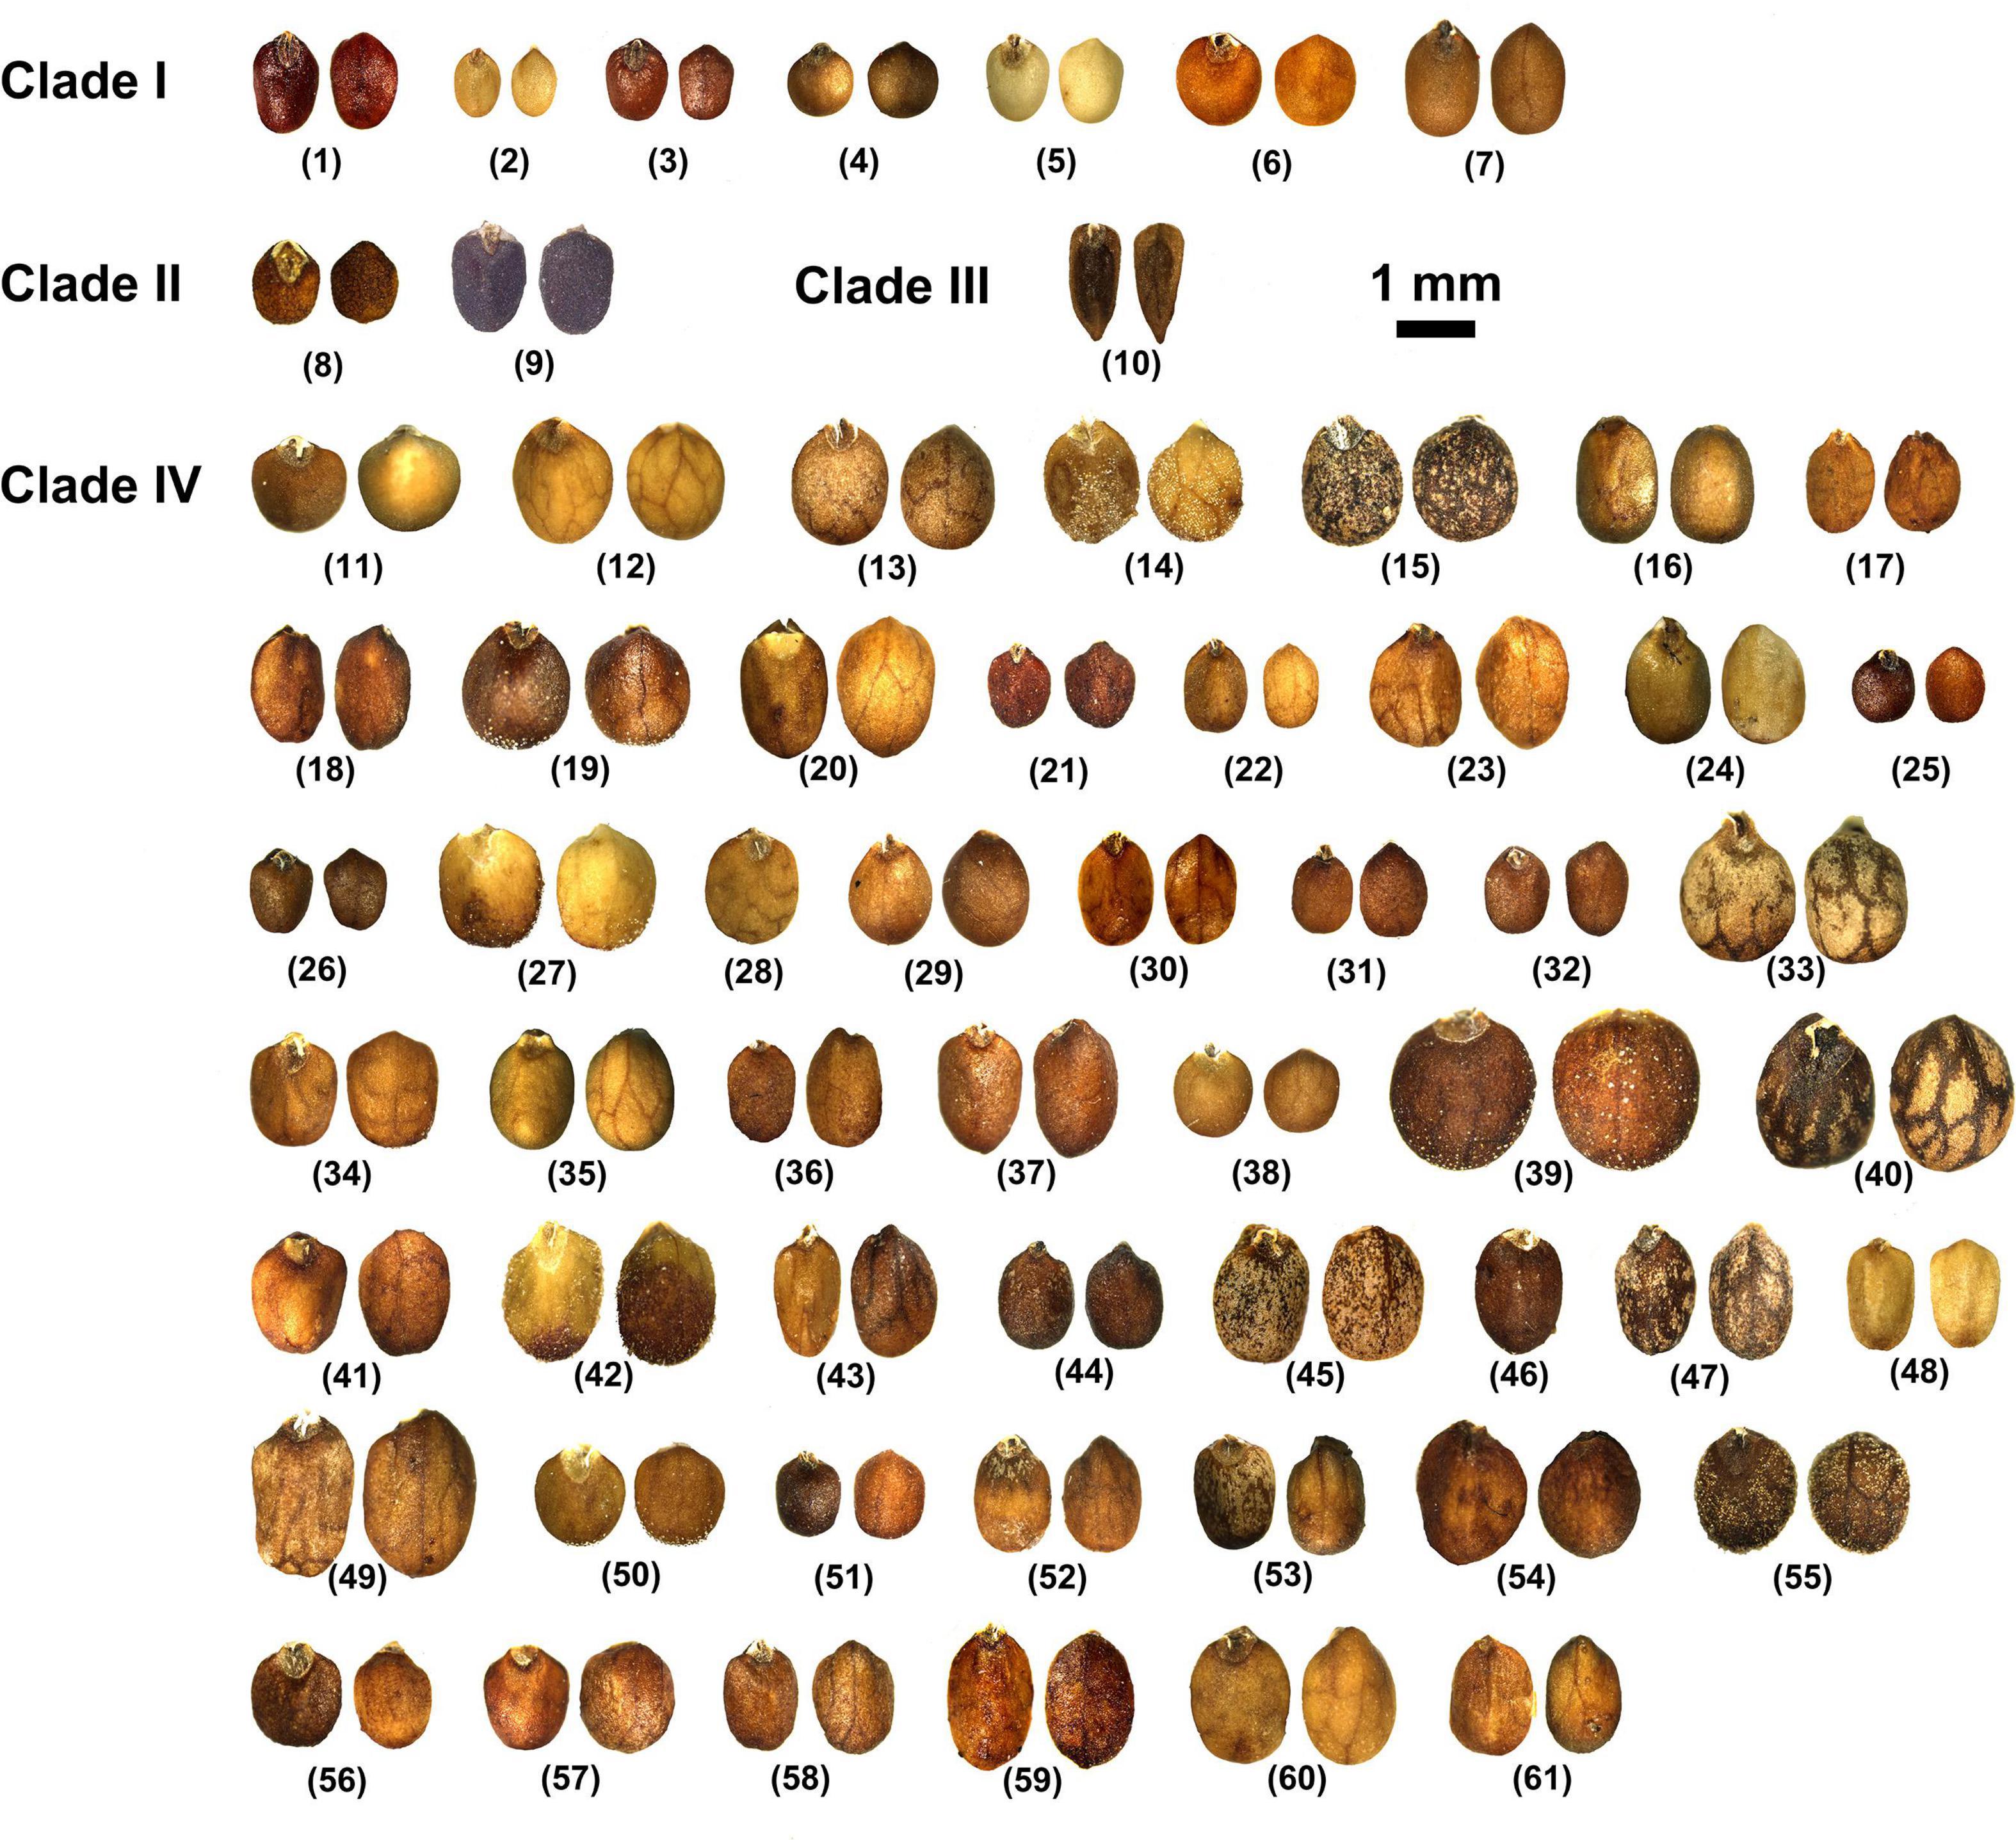
Figure 3. Nutlet morphology of taxa of Isodon. (1) I. atroruber; (2) I. lophanthoides var. lophanthoides; (3) I. lophanthoides var. graciliflorus; (4) I. oreopilus; (5) I. phyllopodus; (6) I. scrophularioides; (7) I. villosus; (8) I. ramosissimus; (9) I. schimperi; (10) I. ternifolius; (11) I. adenanthus; (12) I. albopilosus; (13) I. alborubrus; (14) I. amethystoides; (15) I. angustifolius; (16) I. anisochilus; (17) I. aurantiacus; (18) I. barbeyanus; (19) I. bifidocalyx; (20) I. bulleyanus; (21) I. coetsa var. coetsa; (22) I. coetsa var. cavaleriei; (23) I. dawoensis; (24) I. delavayi; (25) I. enanderianus; (26) I. eriocalyx; (27) I. excisus; (28) I. forrestii; (29) I. gibbosus; (30) I. grandifolius var. atuntzeensis; (31) I. hirtellus; (32) I. interruptus; (33) I. irroratus; (34) I. japonicus var. glaucocalyx; (35) I. kangtingensis; (36) I. leucophyllus; (37) I. loxothyrsus; (38) I. lungshengensis; (39) I. macrocalyx; (40) I. macrophyllus; (41) I. megathyrsus; (42) I. nervosus; (43) I. oresbius; (44) I. parvifolius; (45) I. pharicus; (46) I. phyllostachys; (47) I. pleiophyllus; (48) I. polystachys; (49) I. pseudoirroratus; (50) I. rosthornii; (51) I. rubescens; (52) I. rugosus; (53) I. scoparius; (54) I. sculponeatus; (55) I. serra; (56) I. setchwanensis; (57) I. smithianus; (58) I. ternuifolius; (59) I. wardii; (60) I. weisiensis; (61) I. wikstroemioides.
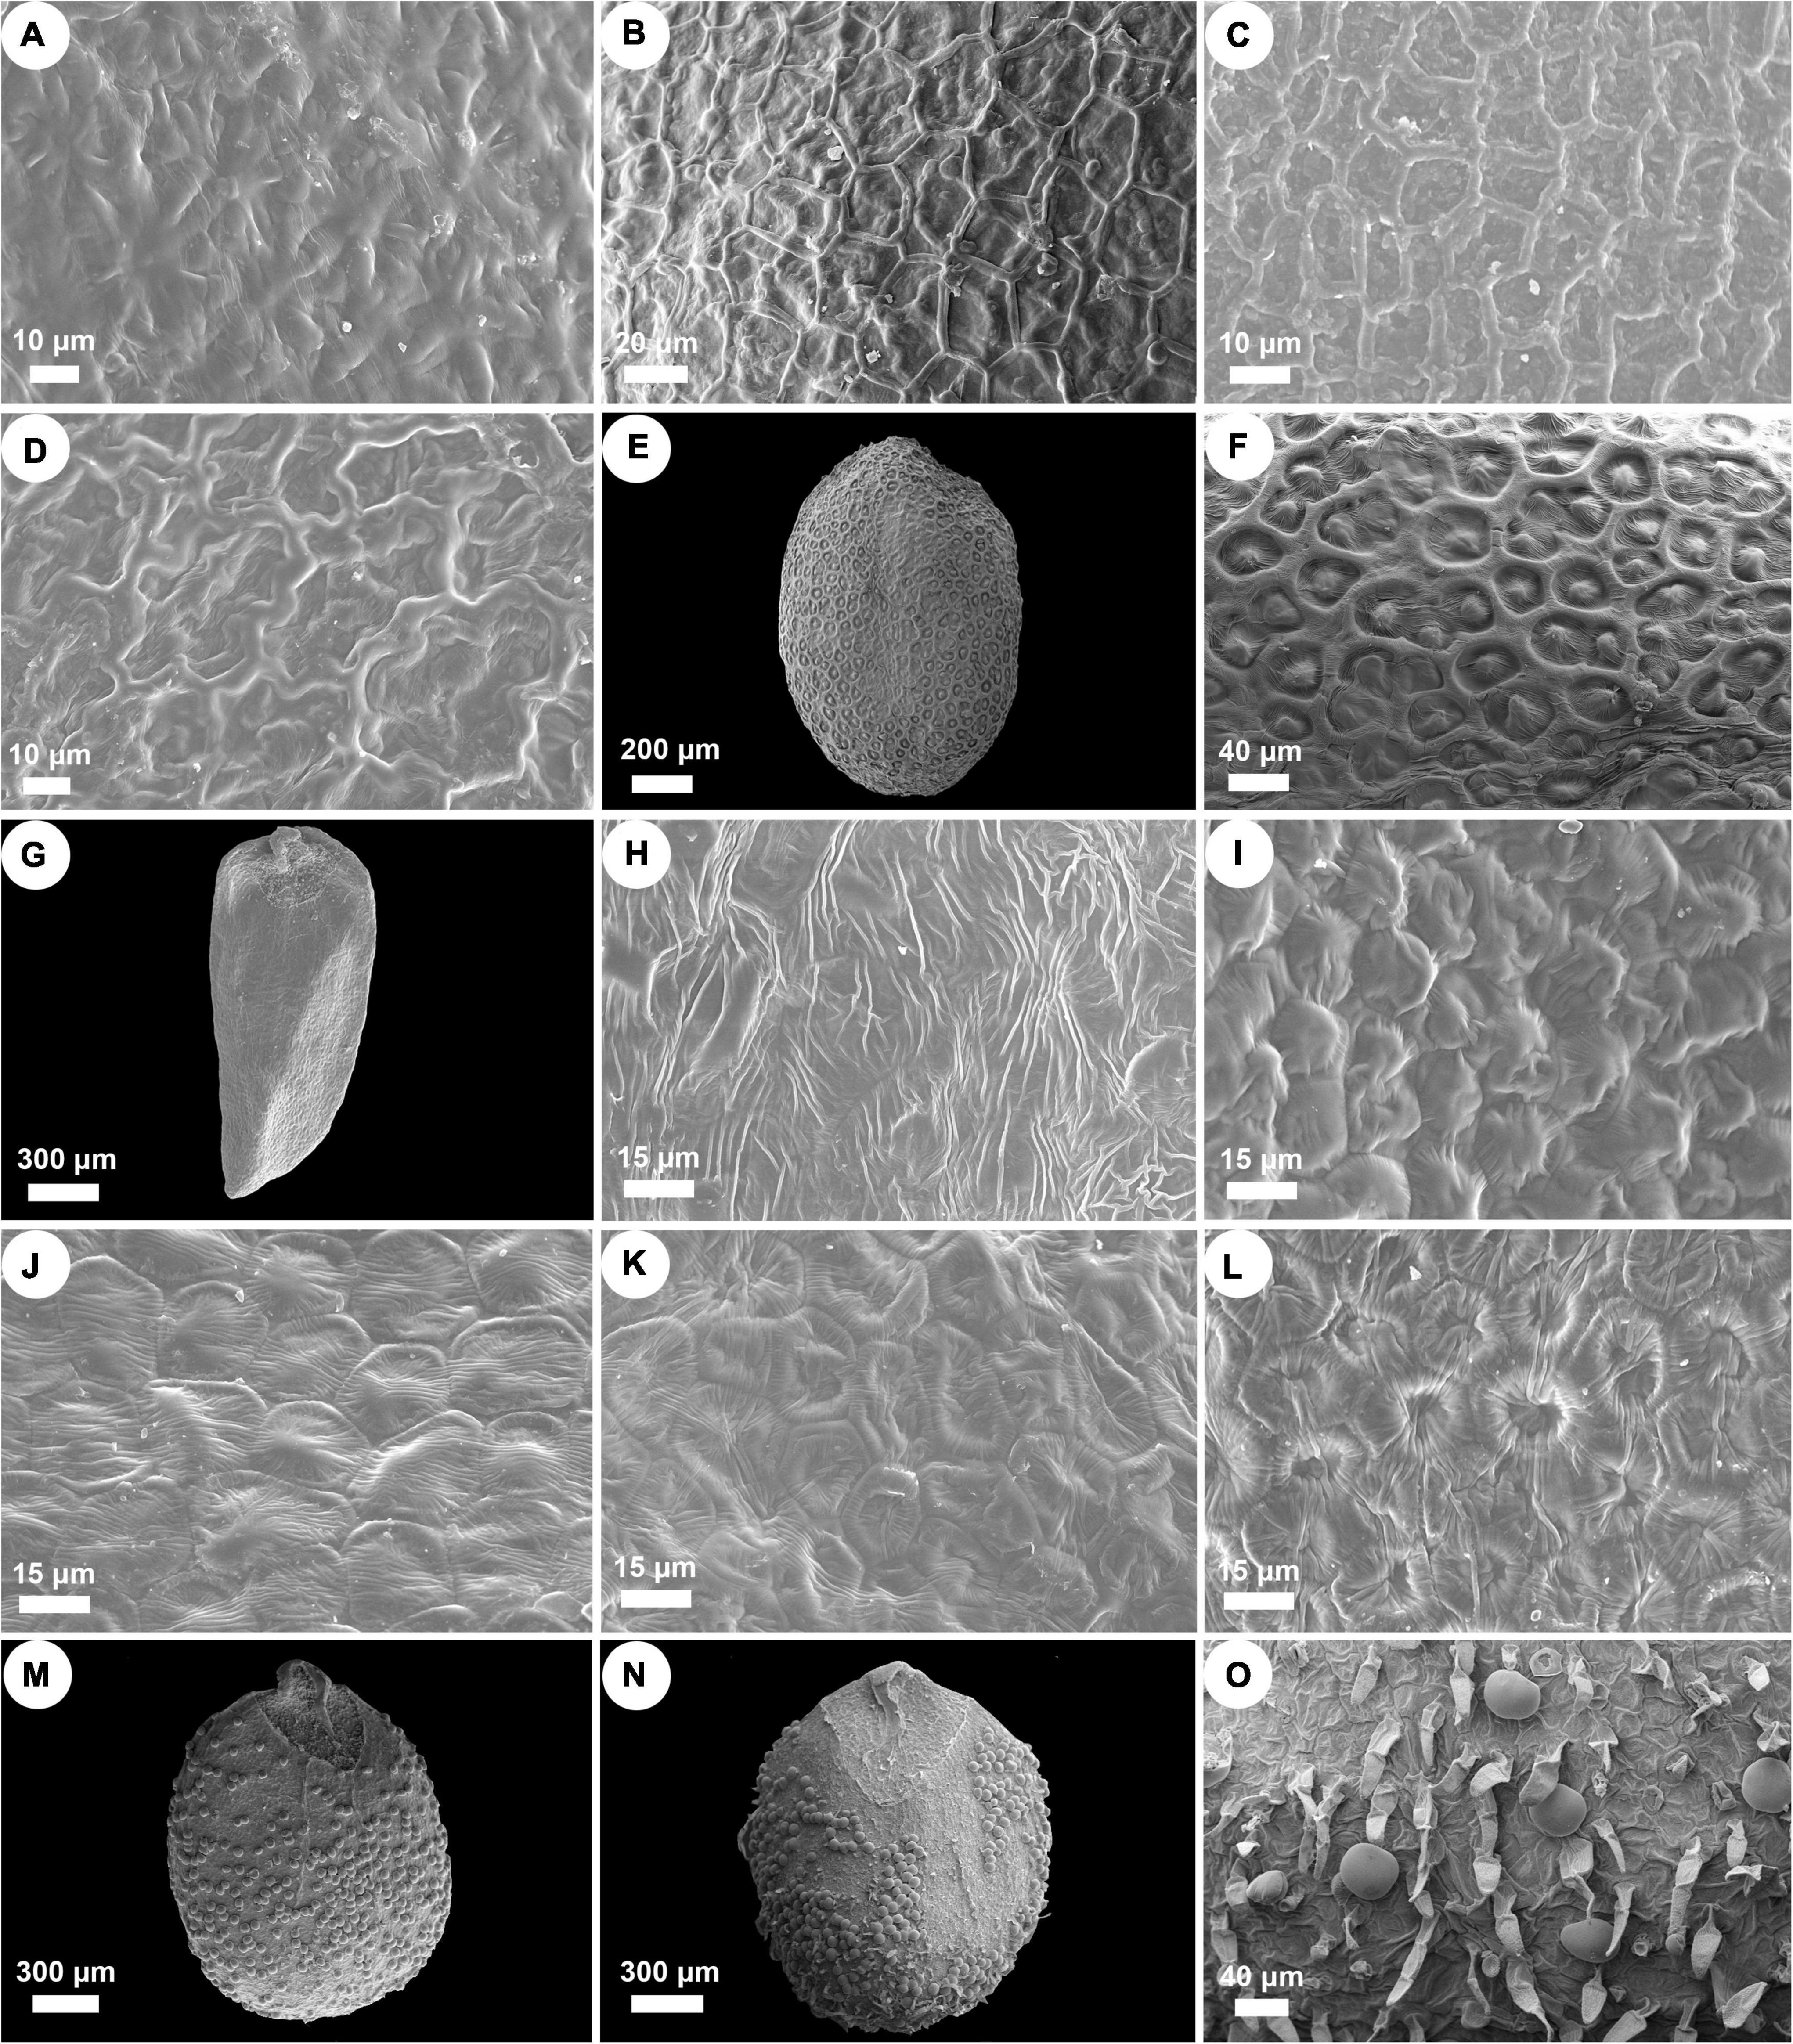
Figure 4. SEM micrographs of nutlet surface pattern in Isodon. (A) Psilate surface. I. lophanthoides. (B–D) Reticulate surface. (B) I. oreophilus; (C) I. phyllopodus; (D) I. scrophularioides. (E,F) Reticulate-papillate surface. I. schimperi. (G,H) Striate surface. I. ternifolius. (I–L) Cellular surface. (I) I. barbeyanus; (J) I. dawoensis; (K) I. scoparius; (L) I. smithianus. (M–O) Glandular or glandular and pubescent surface. (M) I. amethystoides; (N,O) I. serra.
Discussion
Phylogenetic relationship within Isodon
This examination of infrageneric relationships for Isodon was aimed at resolving the phylogenetic ambiguities found by prior phylogenetic studies. Our study has increased taxonomic sampling to include all four sections and ten series, and provided additional geographic sampling to accommodate the distribution of Isodon, especially from HM. Our results recover four monophyletic clades (Clades I–IV) of Isodon species similar to Yu et al. (2014). However, the combination of plastome-scale data and nrDNA sequences of Isodon with our extensive field investigation and morphological studies enables us to further discuss the relationships within each clade.
Relationships within Clade I
All species recovered in Clade I are perennial herbs with reddish-brown glands all over the plants, the latter character was considered a useful synapomorphy of this clade by Zhong et al. (2010) and Yu et al. (2014), as opposed to the colorless glands in the remaining species of Isodon (Supplementary Figure 6). A third kind of glands was discovered in our recently published new species, I. aurantiacus Y.P. Chen and C.L. Xiang, from Tibet, China (Chen et al., 2017), which is embedded within Clade IV (Figure 1 and Supplementary Figure 5). The plants of this species are covered with orange glands (Supplementary Figure 6).
Two subclades can be further recognized within Clade I, whereas the placement of I. scrophularioides exhibits the largest discrepancy that it is recovered within different subclades in the plastid and nrDNA trees. The nutlet morphology seems to support the position of scrophularioides in the nrDNA tree. Our examination of the exine ornamentation on nutlets shows a close relationship between I. oreophilus and I. phyllopodus with I. scrophularioides, as their surfaces are reticulate, unlike the psilate surface sculpture in species (I. atroruber and I. lophanthoides) belonging to the other subclade of Clade I (Figure 4 and Supplementary Table 4). However, a more comprehensive sampling of species with reddish-brown glands is needed to verify the hypothesis.
Species of Clade I are most diverse in the Himalayas and tropical Asia. Based on our current understanding of the taxonomy of Isodon, a total of 20 species have been reported with reddish-brown glands (Li, 1988; Zhong et al., 2010; Chen et al., 2016b; Kumar et al., 2016; Ranjan et al., 2022). The continuous discovery of new species possessing this character during recent years possibly indicates an underestimation of the species diversity of Clade I.
Synapomorphy of Clade II
The systematic placement of the two species of Isodon endemic to Africa, I. ramosissimus and I. schimperi, was first elucidated by Yu et al. (2014), using nrITS, three plastid markers, and a low-copy nuclear gene. Our results here are congruent with that of Yu et al. (2014) that the two species were recovered in a monophyletic clade either sister to the large clade formed by Clade III and Clade IV in the plastid tree (Figure 1) or Clade I in the nuclear tree (Supplementary Figure 5). Based on molecular phylogenetic analyses, chromosome evolution, and biogeographic study, Yu et al. (2014) inferred that the two African species were of hybrid origin between members of Clade I and Clades III–IV, both of which likely formed through allopolyploidy; an overland migration from Asia to Africa through Arabia in early to middle Miocene and the opening of the Red Sea in the middle Miocene probably resulted in the present disjunct distribution of Isodon.
Though the evolutionary history of Clade II has been elucidated by previous study, the synapomorphy of this clade was unclear. Both species are herbs with loose panicles, straight corolla tubes, and long exserted stamens, morphologically similar to I. lophanthoides and related species from Clade I but with colorless glands on the plants. Our morphological study of nutlets further support the distinctiveness of the two endemic species from Africa that they possess reticulate-papillate nutlet surfaces differing from all other species of Isodon, which can be regarded as a synapomorphy of this clade (Figure 4).
Synapomorphy of Clade III
By including two accessions of I. ternifolius in the analysis, we provide additional evidence that supports I. ternifolius as a distinct lineage within Isodon (Zhong et al., 2010; Yu et al., 2014). Isodon ternifolius, which is widely distributed from tropical China to South and Southeast Asia (Li, 1988; Suddee et al., 2004), is reported by Zhong et al. (2010) to be distinguished by a 3–4-whorled leaf phyllotaxy. However, opposite phyllotaxy can be observed on some individuals of a whorled-leaf population of I. ternifolius, and sometimes even on an individual with whorled-leaves (Li, 1988; Suddee et al., 2004; Y.P. Chen, pers. obs.). Furthermore, whorled leaves can occasionally be found in other species of Isodon (Y.P. Chen, pers. obs.). Invariable transitions between phyllotaxy such as these indicate that the current diagnosis of I. ternifolius cannot be properly applied, and must be adjusted to a more stable synapomorphic character. Our examination of nutlets (Figures 3, 4) suggest that irrespective of phyllotaxy, I. ternifolius has trigonous-oblong nutlets with an acute apex, unlike the nutlets of other Isodon species, which are ovate and have an obtuse or rounded apex. Moreover, the striate nutlet ornamentation of I. ternifolius is also unique in the genus.
Relationships within Clade IV
The majority (ca. 85%) of Isodon species in the phylogenetic trees are recovered in Clade IV. Despite that the relationships within this clade are much better resolved in the plastid tree (Figure 1), compared with that of nrDNA tree which primarily includes a large polytomy and scant substructures associated with short branch lengths (Supplementary Figure 5), strong cytoplasmic-nuclear discordance is also revealed (Figure 2). Moreover, some nodes within Clade IV are still poorly supported or show conflicts among the 12 concatenated trees, indicating that whole plastome sequence is not a panacea in resolving phylogenetic relationships within rapidly radiated genera.
As the most morphologically diverse group of Isodon, species of Clade IV are herbs or shrubs with a variety of leaves, inflorescences, and trichomes. It has been difficult to find out the synapomorphy for such a clade. Interestingly, herbal species are mostly distributed in eastern Asia and Japan, whereas the shrubby species, which account for a large proportion of Clade IV, are mainly accustomed to the dry valleys in HM. Two types of nutlet surface are restricted to Clade IV as revealed by our morphological study, with most species sharing the cellular nutlet ornamentation (Figure 4). The remaining species are characterized with glandular or glandular and pubescent nutlets; all these species [except for I. tenuifolius (W.W. Sm.) Kudô] are herbs from the forest area in eastern Asia and Japan.
Causes of phylogenetic incongruences
The 12 concatenated plastome data sets resulted in largely congruent and better resolved topologies (Figure 1 and Supplementary Figure 3) than that of previous studies. However, it can be noted that the branch lengths within Clade IV are extremely short and some nodes receive weak support values or exhibit conflicts among these data sets, especially among different sequence types (coding vs. non-coding) (Supplementary Figure 3). Moreover, concordance analyses of single gene trees demonstrated that most of the plastid genes are uninformative for majority of nodes, but strongly supported conflict at some nodes is also recovered (Supplementary Figure 4). Systematic (e.g., modeling error, misalignment, saturation, and limited taxon sampling) and stochastic errors (e.g., limited phylogenetic signal/information) as well as biological factors (e.g., selection and possibility of genes with distinct evolutionary histories, incomplete lineage sorting) might potentially contribute to these observed discordances (Walker et al., 2019). Based on a comprehensive sampling and our efforts to prune regions with poor alignment and exclude loci with high levels of substitutional saturation, systematic errors fail to explain most of the conflicts as the resulting data sets recovered largely concordant infrageneric relationships (Supplementary Figure 3). Previous studies (Walker et al., 2019; Zhang et al., 2020) suggested that stochasticity could be a primary source of conflict among plastid loci. Phylogenetic relationships inferred from genes with limited information (usually with short length or slow-evolving) could be spurious and misleading. For a genus which has undergone recent rapid radiation, most single plastid regions harbor too few variable sites to be informative and thus unable to accurately infer relationships within Isodon. Although potential sources of conflict such as selection and heteroplasmy (i.e., distinct plastomes coexist within a single organism resulted from plastid recombination, transfer, and/or complex mutational dynamics) have been documented from many other taxa (Lee-Yaw et al., 2019; Ramsey and Mandel, 2019), they still warrant further investigation in Isodon.
From our analyses, it is clear that well-supported tree obtained from plastome data is in strong conflict with the tree inferred from nuclear data (Figure 2). Moreover, the infrageneric relationships recovered within the plastid tree are also incongruent with the current taxonomy (mainly based on morphology and ecology) and species distribution. Patterns of variation in nuclear markers often agree with morphologically defined species boundaries (e.g., Rautenberg et al., 2010; Schuster et al., 2018; Ogishima et al., 2019). However, the sister relationship of I. interruptus (C.Y. Wu and H.W. Li) H. Hara and I. brachythyrsus (C.Y. Wu and H.W. Li) H. Hara which receives high support (BS = 96%/PP = 1.00) in the nrDNA tree is in contrast with their significant differences in the morphology of inflorescence (spike-like panicles with bracts longer than cymes in I. interruptus vs. loose panicles with bracts shorter than cymes in I. brachythyrsus), calyx (tubular campanulate vs. broadly campanulate), and corolla (yellow with tube slightly saccate abaxially near base vs. white to pale lavender with tube calcarate abaxially near base), whereas I. interruptus shares all these features with I. muliensis (W.W. Sm.) Kudô (Chen and Xiang, 2019). The minor differences between I. interruptus and I. muliensis are that I. interruptus has shorter habits and petioles and smaller leaves. Despite the constraints of nrDNA sequences (e.g., multiple rDNA arrays, concerted evolution, pseudogenes, and secondary structure) (Álvarez and Wendel, 2003; Feliner and Rossello, 2007), the limited substructures recovered within Clade IV in the nuclear tree are mostly formed by species with similar morphology and from the same distribution area. In contrast, similar patterns of morphology and geographic distribution are hardly found in the plastid tree (Figure 1). For example, the two sister groups recovered in the nrDNA tree (Supplementary Figure 5), I. gibbosus (C.Y. Wu and H.W. Li) H. Hara and I. lungshengensis (C.Y. Wu and H.W. Li) H. Hara, I. xerophilus (C.Y. Wu and H.W. Li) H. Hara and I. enanderianus (Hand.-Mazz.) H.W. Li, can also be supported by their shared morphology, habitat, and distribution. Plants of I. gibbosus and I. lungshengensis are perennial herbs usually grow at moist streamside in the bordering area of Guangxi, Hunan, and Guizhou Provinces, China, while I. enanderianus and I. xerophilus are shrubs restricted to the dry valleys in southern Yunnan Province (Wu and Li, 1977; Li and Hedge, 1994). However, in the plastid tree, I. gibbosus falls sister to I. enanderianus, both of which are distantly related to I. lungshengensis and I. xerophilus (Figure 1).
Discordances between nuclear tree/morphological taxonomy and plastid tree are much often attributed to interspecific hybridization, which could be the gene flow in the nuclear genome or plastid capture. The discordant placement of the two African species (Clade II) and I. scrophularioides likely indicates a hybrid origin, as has been shown in Yu et al. (2014). Except for these species, several natural hybrids have been described from Japan (Murata and Yamazaki, 1993); our recent field investigations have also detected some putative hybrids in sympatric populations of Isodon that will require further study (Chen, 2017; Y.P. Chen, pers. obs.). Although genetic exchange within the genus seems to be frequent, both chromosome incompatibilities and/or backcrossing with one parent could erased most signals of gene flow in the nuclear genome, but these signals may have been retained in the plastid genome by chance or by selection. Moreover, in seed plants with maternally inherited organelles, interspecific exchange of plastid loci occurs more frequently than that of nuclear genes (Rieseberg and Soltis, 1991). Therefore, the majority of topological conflicts between the plastid and nuclear trees possibly is a consequence of plastid capture, i.e., the plastid genome of one species is replaced by an alien one through intrageneric hybridization and introgression as well as recurrent backcrossing, while the nuclear genome remains largely unchanged (Rieseberg and Soltis, 1991; Tsitrone et al., 2003; Chan and Levin, 2005; Stegemann et al., 2012). Molecular phylogenetic studies of Japanese Isodon also revealed that most populations belonging to the same species are rarely monophyletic in the plastid tree, but group together in the nuclear tree, indicating that plastid capture may have frequently occurred between Isodon species from Japan (Maki et al., 2010; Ogishima et al., 2019). Previous studies frequently recovered geographic patterns of large-scale structuring in plastid haplotypes (e.g., Rautenberg et al., 2010; Pham et al., 2017; Schuster et al., 2018). However, this geographic congruence with infrageneric relationships in the plastid tree is neither supported by our result nor by the analyses of Japanese Isodon (Maki et al., 2010; Ogishima et al., 2019). Most species forming monophyletic clades/sister groups in the plastid tree do not show sympatric distribution or geographic proximity (Figure 1), suggesting the plastid capture might be a consequence of ancient (rather than ongoing) interspecific hybridization within shared areas in the past.
Taken as a whole, our results suggest that stochasticity stemming from recent rapid radiation and limited phylogenetic signal, widespread hybridization and plastid capture, independently or in concert, may contribute to a complex evolutionary history of Isodon. Moreover, our results demonstrate that plastome data does not accurately reflect species relationships and is insufficient to resolve shallow level relationships within a rapidly radiated genus like Isodon. To achieve for a better resolved phylogeny of the genus, significant larger data sets derived from nuclear genome with next-generation sequencing technology might be helpful, such as targeted enrichment (Gardner et al., 2020; Reichelt et al., 2021; Giaretta et al., 2022), deep genome skimming (Liu et al., 2021), and RNA-seq (Nevado et al., 2016; Jin et al., 2021; Kong et al., 2022; Xia et al., 2022), which are compatible with more comprehensive tools for disambiguating genetic lineages and causes of gene tree conflicts.
Conclusion
Isodon, as revealed by plastid and nuclear phylogenetic data, is comprised of four clades, the fourth (Clade IV) of which consists of the largest portion of Isodon (85% of species). The tree topology at deep nodes largely corresponds with previous molecular phylogenetic studies of Isodon, whereas we further reveal that Clade II which consisting of the two African endemic species differs from the remaining Isodon species by the reticulate-papillate nutlet surfaces. Clade III is composed of individuals of I. ternifolius with both whorled and opposite phyllotaxy, while our morphological examination demonstrates that nutlets with acute and conspicuously trigonous apex is exclusive to all individuals of I. ternifolius. Phylogenetic relationships within Clade IV are much better resolved in the plastid tree than that in previous studies, but highly incongruent with the nrDNA tree and morphology and distribution. Species of Clade IV have cellular nutlet surface type and the distinct nutlets with trichomes, the latter type is restricted to species mostly from eastern Asia and Japan. Our results also suggest that multiple processes might have been involved in the evolutionary history of Isodon and plastome sequences fail to further resolve the shallow-level relationships within the genus. Large-scale molecular markers from the nuclear genome might contribute to a better understanding of the infrageneric relationships of the rapidly radiated Isodon.
Data availability statement
The original contributions presented in this study are publicly available. The raw sequence data were deposited in the NCBI BioProject database under the accession number: PRJNA863331, and the sequence alignments and resulting tree files were deposited in figshare at https://doi.org/10.6084/m9.figshare.20170727.
Author contributions
Y-PC, L-MG, and C-LX conceived this study. Y-PC and FZ analyzed the data. Y-PC drafted the manuscript with contributions from other authors. All authors collected the materials, read, and approved the final manuscript.
Funding
This work was supported by the Yunnan Fundamental Research Projects (Grant Nos. 202101AU070067 and 202101AT070159) to Y-PC, the Large-Scale Scientific Facilities of the Chinese Academy of Sciences (Grant No. 2017-LSFGBOWS-02) and the Key Basic Research program of Yunnan Province, China (Grant No. 202101BC070003) to L-MG, the Ten Thousand Talents Program of Yunnan (Grant No. YNWR-QNBJ-2018-279), the Yunnan Fundamental Research Projects (Grant No. 2019FI009), and the open research project of the Germplasm Bank of Wild Species, Kunming Institute of Botany, Chinese Academy of Sciences to C-LX, and the Science and Engineering Research Board of the Government of India (Grant No. CRG/2018/003499) to PS.
Acknowledgments
We would like to thank the staff of following herbaria for their kind assistance in research facilities: BM, CDBI, E, IBK, IBSC, K, KUN, KYO, LE, MW, NAS, PE, SZ, TI. We are grateful to Ya-Huang Luo for his help in data analyses, and to Zhi-Jia Gu for his technical assistance in SEM. Thanks are also extended to En-De Liu, Hong-Jin Dong, Lei Jiang, and staff of the Germplasm Bank of Wild Species in Southwest China for their help in collection of specimens and leaf material, and to the reviewers for their valuable suggestions that greatly improved our manuscript.
Conflict of interest
The authors declare that the research was conducted in the absence of any commercial or financial relationships that could be construed as a potential conflict of interest.
Publisher’s note
All claims expressed in this article are solely those of the authors and do not necessarily represent those of their affiliated organizations, or those of the publisher, the editors and the reviewers. Any product that may be evaluated in this article, or claim that may be made by its manufacturer, is not guaranteed or endorsed by the publisher.
Supplementary material
The Supplementary Material for this article can be found online at: https://www.frontiersin.org/articles/10.3389/fpls.2022.985488/full#supplementary-material
Supplementary Figure 1 | Locus-specific saturation indices for 207 loci shown as density plots (distribution). (A) R2 of the linear regression between patristic and uncorrected pairwise distances. (B) Slopes of the linear regression between patristic and uncorrected pairwise distances. Dashed line indicates starting shoulder value. Red regions on the left-hand side contain loci that might be saturated.
Supplementary Figure 2 | Gene map of the complete plastomes of Isodon species. Genes inside and outside of the circle are transcribed in the clockwise and counterclockwise directions, respectively. Genes belonging to different functional categories are color-coded. LSC, large single copy; SSC, small single copy; IR, inverted repeat.
Supplementary Figure 3 | Cladogram of the maximum-likelihood tree estimated from the CR + NCR-GB data set used as a reference to evaluate conflict and concordance among the trees estimate from the remaining 11 data sets. Pie charts depict conflict amongst the input trees, with the blue, green, red, and gray slices representing the proportion of input bipartitions concordant, conflicting (supporting a single main alternative topology), conflicting (supporting various alternative topologies), and uninformative (< 70% BS) at each node in the CR + NCR-GB tree, respectively. The numbers above and below each branch are the number of bipartitions concordant and conflicting with that particular node, respectively.
Supplementary Figure 4 | Summary of gene tree conflict against the reference CR + NCR-GB tree. Pie charts depict conflict amongst the input locus trees, with the blue, green, red, and gray slices representing the proportion of the 207 trees concordant, conflicting (supporting a single main alternative topology), conflicting (supporting various alternative topologies), and uninformative (< 70% BS) at each node in the PCN tree, respectively. The numbers above and below each branch are the number of bipartitions concordant and conflicting with that particular node, respectively.
Supplementary Figure 5 | Phylogram of the maximum-likelihood tree of Isodon inferred from the nrDNA data set. Support values ≥ 50% BS or 0.50 PP are displayed above the branches (“*” indicates a support value = 100% BS or 1.00 PP, “–” indicates a support value < 0.50 PP).
Supplementary Figure 6 | Glands with different colors on leaves and calyces of Isodon species. (A,B) reddish-brown, I. lophanthoides var. lophanthoides; (C,D) colorless, I. serra; (E,F) orange, I. aurantiacus.
Footnotes
References
Álvarez, I., and Wendel, J. F. (2003). Ribosomal ITS sequences and plant phylogenetic inference. Mol. Phylogenet. Evol. 29, 417–434. doi: 10.1016/S1055-7903(03)00208-2
Baldwin, B. G., and Markos, S. (1998). Phylogenetic utility of the external transcribed spacer (ETS) of 18S-26S rDNA: Congruence of ETS and ITS trees of Calycadenia (Compositae). Mol. Phylogenet. Evol. 10, 449–463. doi: 10.1006/mpev.1998.0545
Beardsley, P. M., and Olmstead, R. G. (2002). Redefining Phrymaceae: The placement of Mimulus, tribe Mimuleae, and Phryma. Am. J. Bot. 89, 1093–1102. doi: 10.3732/ajb.89.7.1093
Birky, C. W. (1995). Uniparental inheritance of mitochondrial and plastid genes: Mechanisms and evolution. Proc. Natl. Acad. Sci. U.S.A. 92, 11331–11338. doi: 10.1073/pnas.92.25.11331
Bolger, A. M., Lohse, M., and Usadel, B. (2014). Trimmomatic: A flexible trimmer for Illumina sequence data. Bioinformatics 30, 2114–2120. doi: 10.1093/bioinformatics/btu170
Budantsev, A. L., and Lobova, T. A. (1997). Fruit morphology, anatomy and taxonomy of tribe Nepeteae (Labiatae). Edinb. J. Bot. 54, 183–216. doi: 10.1007/s10265-006-0023-6
Cao, Q., Gao, Q. B., Ma, X. L., Zhang, F. Q., Xing, R., Chi, X. F., et al. (2022). Plastome structure, phylogenomics and evolution of plastid genes in Swertia (Gentianaceae) in the Qinghai-Tibetan Plateau. BMC Plant Biol. 22:195. doi: 10.1186/s12870-022-03577-x
Castresana, J. (2000). Selection of conserved blocks from multiple alignments for their use in phylogenetic analysis. Mol. Biol. Evol. 17, 540–552. doi: 10.1093/oxfordjournals.molbev.a026334
Chan, K. M. A., and Levin, S. A. (2005). Leaky prezygotic isolation and porous genomes: Rapid introgression of maternally inherited DNA. Evolution 59, 720–729. doi: 10.1111/j.0014-3820.2005.tb01748.x
Chan, P. P., and Lowe, T. M. (2019). tRNAscan-SE: Searching for tRNA genes in genomic sequences. Methods Mol. Biol. 1962, 1–14. doi: 10.1007/978-1-4939-9173-0_1
Chen, Y. P., Hu, G. X., Zhao, F., Peng, H., and Xiang, C. L. (2017). Taxonomic notes on Isodon (Lamiaceae) in China, II: I. aurantiacus, a new species from Tibet, China. Ann. Bot. Fenn. 54, 239–243. doi: 10.5735/085.054.0606
Chen, Y. P. (2017). Taxonomic and molecular phylogenetic studies on Isodon (Schrad. ex Benth.) Spach (Lamiaceae) in China. [dissertation]. Beijing: University of Chinese Academy of Sciences.
Chen, Y. P., and Xiang, C. L. (2019). Taxonomic notes on Isodon (Nepetoideae, Lamiaceae) in China, III: Resurrection of I. brachythyrsus, I. chionanthus, and I. kangtingensis. Nord. J. Bot. 37, 1–13. doi: 10.1111/njb.02240
Chen, Y. P., Xiang, C. L., Sunojkumar, P., and Peng, H. (2016b). Isodon villosus (Nepetoideae, Lamiaceae), a new species from Guangxi, China. Phytotaxa 268, 271–278. doi: 10.11646/phytotaxa.268.4.5
Chen, Y. P., Drew, B. T., Li, B., Soltis, D. E., Soltis, P. S., and Xiang, C. L. (2016a). Resolving the phylogenetic position of Ombrocharis (Lamiaceae), with reference to the molecular phylogeny of tribe Elsholtzieae. Taxon 65, 123–136. doi: 10.12705/651.8
Chen, Y. P., Wilson, T. C., Zhou, Y. D., Wang, Z. H., Liu, E. D., Peng, H., et al. (2019). Isodon hsiwenii (Lamiaceae: Nepetoideae), a new species from Yunnan, China. Syst. Bot. 44, 913–922. doi: 10.1600/036364419X15710776741486
Cheon, K. S., Jeong, I. S., Kim, K. H., Lee, M. H., Lee, T. H., Lee, J. H., et al. (2018). Comparative SNP analysis of chloroplast genomes and 45S nrDNAs reveals genetic diversity of Perilla species. Plant Breed. Biotech. 6, 125–139. doi: 10.9787/PBB.2018.6.2.125
Darriba, D., Taboada, G. L., Doallo, R., and Posada, D. (2012). jModelTest 2: More models, new heuristics and parallel computing. Nat. Methods 9:772. doi: 10.1038/nmeth.2109
Doyle, J. J., and Doyle, J. L. (1987). A rapid DNA isolation procedure for small quantities of fresh leaf tissue. Phytochem. Bull. 19, 11–15.
Feliner, G. N., and Rossello, J. A. (2007). Better the devil you know? Guidelines for insightful utilization of nrDNA ITS in species level evolutionary studies in plants. Mol. Phylogenet. Evol. 44, 911–919. doi: 10.1016/j.ympev.2007.01.013
Foster, C. S. P., Henwood, M. J., and Ho, S. Y. W. (2018). Plastome sequences and exploration of tree-space help to resolve the phylogeny of riceflowers (Thymelaeaceae: Pimelea). Mol. Phylogenet. Evol. 127, 156–167. doi: 10.1016/j.ympev.2018.05.018
Fu, C. N., Mo, Z. Q., Yang, J. B., Ge, X. J., Li, D. Z., Xiang, Q. Y., et al. (2019). Plastid phylogenomics and biogeographic analysis support a Laurasian origin and rapid early radiation of Cornales in the Mid-Cretaceous. Mol. Phylogenet. Evol. 140:106601. doi: 10.1016/j.ympev.2019.106601
Gardner, E. M., Johnson, M. G., Pereira, J. T., Puad, A. S. A., Arifiani, D., Wickett, N. J., et al. (2020). Paralogs and off-target sequences improve phylogenetic resolution in a densely-sampled study of the breadfruit genus (Artocarpus, Moraceae). Syst. Biol. 70, 558–575. doi: 10.1093/sysbio/syaa073
Giaretta, A., Murphy, B., Maurin, O., Mazine, F. F., Sano, P., and Lucas, E. (2022). Phylogenetic relationships within the hyper-diverse genus Eugenia (Myrtaceae: Myrteae) based on target enrichment sequencing. Front. Plant Sci. 12:759460. doi: 10.3389/fpls.2021.75946
Gitzendanner, M. A., Soltis, P. S., Yi, T. S., Li, D. Z., and Soltis, D. E. (2018). “Plastome phylogenetics: 30 years of inferences into plant evolution,” in Advances in botanical research, eds S. M. Chaw and R. K. Jansen (London: Academic Press), 293–313. doi: 10.1016/bs.abr.2017.11.016
Graybeal, A. (1998). Is it better to add taxa or characters to a difficult phylogenetic problem? Syst. Biol. 47, 9–17. doi: 10.1080/106351598260996
Harley, R. M., Atkins, S., Budantsev, A. L., Cantino, P. D., Conn, B. J., Grayer, R., et al. (2004). “Labiatae,” in The families and genera of vascular plants, eds K. Kubitzki and J. W. Kadereit (Berlin: Springer), 167–275.
He, J., Lyu, R., Luo, Y., Lin, L., Yao, M., Xiao, J., et al. (2021). An updated phylogenetic and biogeographic analysis based on genome skimming data reveals convergent evolution of shrubby habit in clematis in the pliocene and pleistocene. Mol. Phylogenet. Evol. 164:107259. doi: 10.1016/j.ympev.2021.107259
Heath, T. A., Hedtke, S. M., and Hillis, D. M. (2008). Taxon sampling and the accuracy of phylogenetic analyses. J. Syst. Evol. 46, 239–257.
Hillis, D. M. (1998). Taxonomic sampling, phylogenetic accuracy, and investigator bias. Syst. Biol. 47, 3–8. doi: 10.1080/106351598260987
Huerta-Cepas, J., Serra, F., and Bork, P. (2016). ETE 3: Reconstruction, analysis, and visualization of phylogenomic data. Mol. Biol. Evol. 33, 1635–1638. doi: 10.1093/molbev/msw046
Huson, D. H., and Scornavacca, C. (2012). Dendroscope 3: An interactive tool for rooted phylogenetic trees and networks. Syst. Biol. 61, 1061–1067. doi: 10.1093/sysbio/sys062
Ji, Y. H., Yang, L. F., Chase, M. W., Liu, C. K., Yang, Z. Y., Yang, J., et al. (2019). Plastome phylogenomics, biogeography, and clade diversification of Paris (Melanthiaceae). BMC Plant Biol. 19:543. doi: 10.1186/s12870-019-2147-6
Jin, J. J., Yu, W. B., Yang, J. B., Song, Y., dePamphilis, C. W., Yi, T. S., et al. (2020). GetOrganelle: A fast and versatile toolkit for accurate de novo assembly of organelle genomes. Genome Biol. 21:241. doi: 10.1186/s13059-020-02154-5
Jin, W. T., Gernandt, D. S., Wehenkel, C., Xia, X. M., Wei, X. X., and Wang, X. Q. (2021). Phylogenomic and ecological analyses reveal the spatiotemporal evolution of global pines. Proc. Natl. Acad. Sci. U.S.A. 118:e2022302118. doi: 10.1073/pnas.2022302118
Katoh, K., and Standley, D. M. (2013). MAFFT multiple sequence alignment software version 7: Improvements in performance and usability. Mol. Biol. Evol. 30, 772–780. doi: 10.1093/molbev/mst010
Kearse, M., Moir, R., Wilson, A., Stones-Havas, S., Cheung, M., Sturrock, S., et al. (2012). Geneious basic: An integrated and extendable desktop software platform for the organization and analysis of sequence data. Bioinformatics 28, 1647–1649. doi: 10.1093/bioinformatics/bts199
Kong, H. H., Condamine, F. L., Yang, L. H., Harris, A. J., Feng, C., Wen, F., et al. (2022). Phylogenomic and macroevolutionary evidence for an explosive radiation of a plant genus in the miocene. Syst. Biol. 71, 589–609. doi: 10.1093/sysbio/syab068
Kumar, V. V. N., Narayanan, M. K. R., Sunil, C. N., Sanilkumar, M. G., and Baiju, E. C. (2016). Isodon purpurescence (Lamiaceae), a new species from Western Ghats, Kerala, India. Taiwania 61, 13–15.
Lanfear, R., Calcott, B., Kainer, D., Mayer, C., and Stamatakis, A. (2014). Selecting optimal partitioning schemes for phylogenomic data sets. BMC Evol. Biol. 14:82. doi: 10.1186/1471-2148-14-82
Lanfear, R., Frandsen, P. B., Wright, A. M., Senfeld, T., and Calcott, B. (2017). PartitionFinder 2: New methods for selecting partitioned models of evolution for molecular and morphological phylogenetic analyses. Mol. Biol. Evol. 34, 772–773. doi: 10.1093/molbev/msw260
Lee-Yaw, J. A., Grassa, C. J., Joly, S., Andrew, R. L., and Rieseberg, L. H. (2019). An evaluation of alternative explanations for widespread cytonuclear discordance in annual sunflowers (Helianthus). New Phytol. 221, 515–526. doi: 10.1111/nph.15386
Li, H. T., Luo, Y., Gan, L., Ma, P. F., Gao, L. M., Yang, J. B., et al. (2021). Plastid phylogenomic insights into relationships of all flowering plant families. BMC Biol. 19:232. doi: 10.1186/s12915-021-01166-2
Li, H. T., Yi, T. S., Gao, L. M., Ma, P. F., Zhang, T., Yang, J. B., et al. (2019). Origin of angiosperms and the puzzle of the Jurassic gap. Nature Plants. 5, 461–470. doi: 10.1038/s41477-019-0421-0
Li, H. W., and Hedge, I. (1994). “Lamiaceae,” in Flora of China, Vol. 17, eds C. Y. Wu and P. H. Raven (St. Louis, MO: Missouri Botanical Garden Press), 196–224.
Liu, B. B., Ma, Z. Y., Ren, C., Hodel, R. G. J., Sun, M., Liu, X. Q., et al. (2021). Capturing single-copy nuclear genes, organellar genomes, and nuclear ribosomal DNA from deep genome skimming data for plant phylogenetics: A case study in Vitaceae. J. Syst. Evol. 59, 1124–1138. doi: 10.1111/jse.12806
Liu, M., Wang, W. G., Sun, H. D., and Pu, J. X. (2017). Diterpenoids from Isodon species: An update. Nat. Prod. Rep. 34, 1090–1140. doi: 10.1039/c7np00027h
Maki, M., Yamashiro, T., Dohzono, I., and Suzuki, K. (2010). Molecular phylogeny of Isodon (Lamiaceae) in Japan using chloroplast DNA sequences: Recent rapid radiations or ancient introgressive hybridization? Plant Spec. Biol. 25, 240–248. doi: 10.1111/j.1442-1984.2010.00290.x
Miller, M. A., Pfeiffer, W., and Schwartz, T. (2010). “Creating the CIPRES science gateway for inference of large phylogenetic trees,” in Proceedings of the Gateway Computing Environments Workshop (GCE), (New Orleans, LA), 1–8. doi: 10.1109/GCE.2010.5676129
Moon, H. K., Hong, S. P., Smets, E., and Huysmans, S. (2009). Micromorphology and character evolution of nutlets in tribe Mentheae (Nepetoideae. Lamiaceae). Syst. Bot. 34, 760–776. doi: 10.1600/036364409790139592
Murata, G., and Yamazaki, T. (1993). “Isodon (Benth.) Schrad. ex Spach,” in Flora of Japan Iiia, eds K. Iwatsuki, T. Yamazaki, D. E. Boufford, and H. Ohba (Tokyo: Kodansha), 309–314.
Nevado, B., Atchison, G. W., Hughes, C. E., and Filatov, D. A. (2016). Widespread adaptive evolution during repeated evolutionary radiations in New World lupins. Nat. Commun. 7:12384. doi: 10.1038/ncomms12384
Ogishima, M., Horie, S., Kimura, T., Yomashiro, T., Dohzono, I., Kawaguchi, L., et al. (2019). Frequent chloroplast capture among Isodon (Lamiaceae) species in Japan revealed by phylogenies based on variation in chloroplast and nuclear DNA. Plant Spec. Biol. 34, 127–137. doi: 10.1111/1442-1984.12239
Paton, A. J., and Ryding, O. (1998). Hanceola, Siphocranion and Isodon and their position in the Ocimeae (Labiatae). Kew Bull. 53, 723–731. doi: 10.2307/4110492
Paton, A. J., Bramley, G., Ryding, O., Polhill, R. M., Harvey, Y. B, Iwarsson, M., et al. (2009). “Lamiaceae,” in Flora of East Tropical Africa, eds H. J. Beentje, S. A. Ghazanfar, and R. M. Polhill (Kew: Royal Botanic Gardens), 1–431. guest.
Pham, K. K., Hipp, A. L., Manos, P. S., and Cronn, R. C. (2017). A time and a place for everything: Phylogenetic history and geography as joint predictors of oak plastome phylogeny. Genome 60, 720–732. doi: 10.1139/gen-2016-0191
Qu, X. J., Moore, M. J., Li, D. Z., and Yi, T. S. (2019). PGA: A software package for rapid, accurate, and flexible batch annotation of plastomes. Plant Methods 15:50. doi: 10.1186/s13007-019-0435-7
R Development Core Team (2021). R: A language and environment for statistical computing. Vienna, Austria: R Foundation for Statistical Computing.
Ramsey, A. J., and Mandel, J. R. (2019). When one genome is not enough: Organellar heteroplasmy in plants. Ann. Plant Rev. 2, 1–40. doi: 10.1002/9781119312994.apr0616
Ranjan, V., Krishna, G., and Kumar, A. (2022). A new species of Isodon (Lamiaceae) from Indian Eastern Himalaya. Taiwania 67, 260–266.
Rautenberg, A., Hathaway, L., Oxelman, B., and Prentice, H. C. (2010). Geographic and phylogenetic patterns in Silene section Melandrium (Caryophyllaceae) as inferred from chloroplast and nuclear DNA sequences. Mol. Phylogenet. Evol. 57, 978–991. doi: 10.1016/j.ympev.2010.08.003
Reichelt, N., Wen, J., Pätzold, C., and Appelhans, M. S. (2021). Target enrichment improves phylogenetic resolution in the genus Zanthoxylum (Rutaceae) and indicates both incomplete lineage sorting and hybridization events. Ann. Bot. 128, 497–510. doi: 10.1093/aob/mcab092
Rieseberg, L. H., and Soltis, D. E. (1991). Phylogenetic consequences of cytoplasmic gene flow in plants. Evol. Trends Plants 5, 65–84.
Ronquist, F., Teslenko, M., van der Mark, P., Ayres, D. L., Darling, A., Höhna, S., et al. (2012). MrBayes 3.2: Efficient Bayesian phylogenetic inference and model choice across a large model space. Syst. Biol. 61, 539–542. doi: 10.1093/sysbio/sys029
Schuster, T. M., Setaro, S. D., Tibbits, J. F. G., Batty, E. L., Fowler, R. M., McLay, T. G. B., et al. (2018). Chloroplast variation is incongruent with classification of the Australian bloodwood eucalypts (genus Corymbia, family Myrtaceae). PLoS One 13:e0195034. doi: 10.1371/journal.pone.0195034
Smith, S. A., Moore, M. J., Brown, J. W., and Yang, Y. (2015). Analysis of phylogenomic data sets reveals conflict, concordance, and gene duplications with examples from animals and plants. BMC Evol. Biol. 15:150. doi: 10.1186/s12862-015-0423-0
Stamatakis, A. (2014). RAxML version 8: A tool for phylogenetic analysis and post-analysis of large phylogenies. Bioinformatics 30, 1312–1313. doi: 10.1093/bioinformatics/btu033
Stegemann, S., Keuthe, M., Greiner, S., and Bock, R. (2012). Horizontal transfer of chloroplast genomes between plant species. Proc. Natl. Acad. Sci. U.S.A. 109, 2434–2438. doi: 10.1073/pnas.1114076109
Struck, T. H. (2014). TreSpEx-detection of misleading signal in phylogenetic reconstructions based on tree information. Evol. Bioinform. 10, 51–67. doi: 10.4137/EBO.S14239
Suddee, S., Paton, A. J., and Parnell, J. A. N. (2004). A taxonomic revision of tribe Ocimeae Dumort. (Lamiaceae) in continental South East Asia I. introduction, hyptidinae & hanceolinae. Kew Bull. 59, 337–378. doi: 10.2307/4110949
Sun, H. D., Huang, S. X., and Han, D. B. (2006). Diterpenoids from Isodon species and their biological activities. Nat. Prod. Rep. 23, 673–698. doi: 10.1039/b604174d
Sun, Y., Skinner, D. Z., Liang, G. H., and Hulbert, S. H. (1994). Phylogenetic analysis of sorghum and related taxa using internal transcribed spacers of nuclear ribosomal DNA. Theor. Appl. Genet. 89, 26–32. doi: 10.1007/BF00226978
Talavera, G., and Castresana, J. (2007). Improvement of phylogenies after removing divergent and ambiguously aligned blocks from protein sequence alignments. Syst. Biol. 56, 564–577. doi: 10.1080/10635150701472164
Tamura, K., Stecher, G., Peterson, D., Filipski, A., and Kumar, S. (2013). MEGA6: Molecular evolutionary genetics analysis version 6.0. Mol. Biol. Evol. 30, 2725–2729. doi: 10.1093/molbev/mst197
Thiers, B. (2022). Index herbariorum: A global directory of public herbaria and associated staff. New York botanical garden’s virtual herbarium. Available online at: http://sweetgum.nybg.org/science/ih/ (accessed March 15, 2022).
Tsitrone, A., Kirkpatrick, M., and Levin, D. A. (2003). A model for chloroplast capture. Evolution 57, 1776–1782. doi: 10.1111/j.0014-3820.2003.tb00585.x
Walker, J. F., Walker-Hale, N., Vargas, O. M., Larson, D. A., and Stull, G. W. (2019). Characterizing gene tree conflict in plastome-inferred phylogenies. PeerJ 7:e7747. doi: 10.7717/peerj.7747
Wang, J., Fu, C. N., Mo, Z. Q., Möller, M., Yang, J. B., Zhang, Z. R., et al. (2022). Testing complete plastome for species discrimination, cryptic species discovery and phylogenetic resolution in Cephalotaxus (Cephalotaxaceae). Front. Plant. Sci. 13:768810. doi: 10.3389/fpls.2022.768810
Wick, R. R., Schultz, M. B., Zobel, J., and Holt, K. E. (2015). Bandage: Interactive visualization of de novo genome assemblies. Bioinformatics 31, 3350–3352. doi: 10.1093/bioinformatics/btv383
Wicke, S., Schneeweiss, G. M., dePamphilis, C. W., Müller, K. F., and Quandt, D. (2011). The evolution of the plastid chromosome in land plants: Gene content, gene order, gene function. Plant Mol. Biol. 76, 273–297. doi: 10.1007/s11103-011-9762-4
Wu, C. Y., and Li, H. W. (1977). “Rabdosia (Bl.) Hassk,” in Flora reipublicae popularis sinicae, Vol. 66, eds C. Y. Wu and H. W. Li (Beijing: Science Press), 416–534.
Xia, X. M., Yang, M. Q., Li, C. L., Huang, S. X., Jin, W. T., Shen, T. T., et al. (2022). Spatiotemporal evolution of the global species diversity of Rhododendron. Mol. Biol. Evol. 39:msab314. doi: 10.1093/molbev/msab314
Xiang, C. L., Dong, H. J., Landrein, S., Zhao, F., Yu, W. B., Soltis, D. E., et al. (2020). Revisiting the phylogeny of Dipsacales: New insigghts from phylogenomic analyses of complete plastomic sequences. J. Syst. Evol. 58, 103–117. doi: 10.1111/jse.12526
Yu, X. Q., Gao, L. M., Soltis, D. E., Soltis, P. S., Yang, J. B., Fang, L., et al. (2017). Insights into the historical assembly of East Asian subtropical evergreen broadleaved forests revealed by the temporal history of the tea family. New Phytol. 215, 1235–1248. doi: 10.1111/nph.14683
Yu, X. Q., Maki, M., Drew, B. T., Paton, A. J., Li, H. W., Zhao, J. L., et al. (2014). Phylogeny and historical biogeography of Isodon (Lamiaceae): Rapid radiation in south-west China and Miocene overland dispersal into Africa. Mol. Phylogenet. Evol. 77, 183–194. doi: 10.1016/j.ympev.2014.04.017
Zhang, R., Wang, Y. H., Jin, J. J., Stull, G. W., Bruneau, A., Cardoso, D., et al. (2020). Exploration of plastid phylogenomic conflict yields new insights into the deep relationships of Leguminosae. Syst. Biol. 69, 613–622. doi: 10.1093/sysbio/syaa013
Zhao, F., Chen, Y. P., Salmaki, Y., Drew, B. T., Wilson, T. C., Scheen, A. C., et al. (2021b). An updated tribal classification of Lamiaceae based on plastome phylogenomics. BMC Biol. 19:2. doi: 10.1186/s12915-020-00931-z
Zhao, D. N., Ren, C. Q., and Zhang, J. Q. (2021a). Can plastome data resolve recent radiations? Rhodiola (Crassulaceae) as a case study. Bot. J. Linn. Soc. 197, 513–526. doi: 10.1093/botlinnean/boab035
Zhong, J. S., Li, J., Li, L., Conran, J. H., and Li, H. W. (2010). Phylogeny of Isodon (Schard. ex Benth.) Spach (Lamiaceae) and related genera inferred from nuclear ribosomal ITS, trnL-trnF region, and rps16 intron sequences and morphology. Syst. Bot. 35, 207–219. doi: 10.1600/036364410790862614
Zong, D., Gan, P. H., Zhou, A. P., Zhang, Y., Zou, X. L., Duan, A. N., et al. (2019). Plastome sequences help to resolve deep-level relationships of Populus in the family Salicaceae. Front. Plant Sci. 10:5. doi: 10.3389/fpls.2019.00005
Keywords: genome skimming, Hengduan Mountains, Isodoninae, nutlet, plastid capture
Citation: Chen Y-P, Zhao F, Paton AJ, Sunojkumar P, Gao L-M and Xiang C-L (2022) Plastome sequences fail to resolve shallow level relationships within the rapidly radiated genus Isodon (Lamiaceae). Front. Plant Sci. 13:985488. doi: 10.3389/fpls.2022.985488
Received: 04 July 2022; Accepted: 11 August 2022;
Published: 08 September 2022.
Edited by:
Daniel Pinero, National Autonomous University of Mexico, MexicoCopyright © 2022 Chen, Zhao, Paton, Sunojkumar, Gao and Xiang. This is an open-access article distributed under the terms of the Creative Commons Attribution License (CC BY). The use, distribution or reproduction in other forums is permitted, provided the original author(s) and the copyright owner(s) are credited and that the original publication in this journal is cited, in accordance with accepted academic practice. No use, distribution or reproduction is permitted which does not comply with these terms.
*Correspondence: Lian-Ming Gao, gaolm@mail.kib.ac.cn; Chun-Lei Xiang, xiangchunlei@mail.kib.ac.cn