Proposing a novel classification of growth periods based on biomechanical properties and seasonal changes of Spartina anglica
 Kara Keimer1*
  Viktoria Kosmalla1
  Inga Prüter1
  Oliver Lojek1
  Markus Prinz2
  David Schürenkamp1 Holger Freund2
  Nils Goseberg1,3
- 1Leichtweiß-Institute for Hydraulic Engineering and Water Resources, Division of Hydromechanics, Coastal and Ocean Engineering, Technische Universität Braunschweig, Braunschweig, Germany
- 2Institute for Chemistry and Biology of the Marine Environment, Carl von Ossietzky Universität Oldenburg, Oldenburg, Germany
- 3Coastal Research Center, Joint Central Institution of the Leibniz Universität Hannover and the Technische Universität Braunschweig, Hannover, Germany
Salt marshes are a valuable ecosystem with coastal protection potential, for example by absorbing hydrodynamic energy, increasing sedimentation and stabilizing the soil. This study investigated biomechanical properties of Spartina anglica to improve future models of wave-vegetation interaction. To fully understand the correlations between hydro- and biomechanics, the biomechanical vegetation properties from December 2021 to July 2022 are investigated with specimens collected from the field monthly. 551 specimens were used to determine the vegetation properties during storm surge season with high hydrodynamic forces. Additional geometrical properties were determined for 1265 specimens. Three-point bending tests measured the stiffness S (N/mm) and maximum forces Fmax (N). Different phenological states were observed over time and separated for analysis. These states provide a novel classification of growth periods for evaluating the coastal protection potential of Spartina anglica. Especially during storm season, most specimen were identified as broken shoots with a mean stiffness of 1.92N/mm (using 304 samples) compared to the bottom part of flowering shoots in December and January with a mean stiffness of 2.98N/mm (using 61 samples). The classification of plant properties recognizing phenological differences, based on plant state and seasonality, can be used to explain and reduce variability of biomechanical properties obtained during field campaigns. Additionally, this study shows that March to April is recommended for future investigations focusing on shoot properties during storm surge season, which is the important season for coastal engineers considering vegetation state.
1 Introduction
Including natural ecosystems into coastal protection strategies has received rising interest of local stakeholders, coastal protection authorities and researchers alike. Ecosystem-based coastal defenses (Schoonees et al., 2019) provide multiple ecosystem services (European Commission and Directorate-General for Environment, 2014; Haines-Young and Potschin, 2018), enhancing their environmental value while bolstering natural resilience (Bouma et al., 2014; Doswald et al., 2014). Salt marshes, taking reference to various globally distributed sites (Mcowen et al., 2017), have been studied in laboratories and in the field to evaluate multiple ecosystem services, like the absorption of hydrodynamic energy (Ghisalberti and Nepf, 2006; Augustin et al., 2009; Ysebaert et al., 2011; Jadhav et al., 2013; Koftis et al., 2013; Anderson and Smith, 2014; Möller et al., 2014; Carus et al., 2016; Vuik et al., 2016; Rupprecht et al., 2017; Lou et al., 2018; Garzon et al., 2019; van Veelen et al., 2020; Willemsen et al., 2020; Keimer et al., 2021; Zhang et al., 2022), sediment accretion (Christiansen et al., 2000; Cahoon et al., 2006; Andersen et al., 2011; Baaij et al., 2021; Cahoon et al., 2021; Proença et al., 2021), soil stabilization (Ford et al., 2016; Kosmalla et al., 2022; Schoutens et al., 2022) and geomorphological changes (Bouma et al., 2016; Chen et al., 2020; Cao et al., 2021; Ladd et al., 2021).The above-mentioned effects depend on vegetation species, traits of the above- and below-ground biomass and hydrodynamic conditions (Schoutens et al., 2020). Integrating and upscaling the presence of salt marshes into coastal protection plans, thus, adds multiple protection functions and enables the foreshore to self-adapt to changing marine loads (Morris et al., 2022; Temmerman et al., 2023).
Biomechanical parameters can be used to understand the wave attenuation capacity of salt marshes found in field studies (e.g. Garzon et al., 2019) or hydrodynamic modeling, which indicates the coastal protection potential. Commonly, these parameters are the vegetation height, diameter and vegetation density (Garzon et al., 2019; Hadadpour et al., 2019; Coleman et al., 2022). Hadadpour et al. (2019), for example, used these three parameters to determine the leaf area index, which is used for a porous media based approach to describe the flow in a vegetation field. This approach showed good agreement compared to physical experiments with rigid vegetation surrogates. Vegetation height, density and diameter can also be used to estimate the flow drag, improving the prediction of flow velocities over marsh platforms (Ashall et al., 2016). Marjoribanks et al. (2019) additionally included the flexural rigidity to study the wake length of salt marsh vegetation patches. The simulations of van Loon-Steensma et al. (2016), which determined the protection potential of a restored salt marsh in front of a dike for different storm conditions, highlights the importance of considering the spatial distribution of vegetation species within a salt marsh. Vuik et al. (2016) used varying diameters over the height of the plant based on field measurements to simulate wave loads on dikes. Based on the results of the simulation, Vuik et al. recommend vegetated foreshores as an important supplement to dikes as a coastal protection measure.
Despite the variety of works highlighting the benefits and ecosystem services of wetlands with respect to coastal protection, little attention has been paid to the seasonality of these effects. This work, hence, provides a unique data set of vegetation properties focused on seasonality. Recurring field investigations were conducted to systematically catalog characteristic vegetation properties over the course of seasonal change, yet without systematically following a full seasonal cycle. Table 1 provides a summary of properties that were published over the past few decades on biomechanical and geometrical properties of Spartina plants, since cord-grass S. anglica synonym Sporobolus anglicus after Peterson et al. (2014) is the focal species in this study. Note, that studies vary with using the terms “height” or “length”. This study continuously uses the height to define the size of the Spartina sp. specimen, since they are mostly standing upright in the salt marsh.
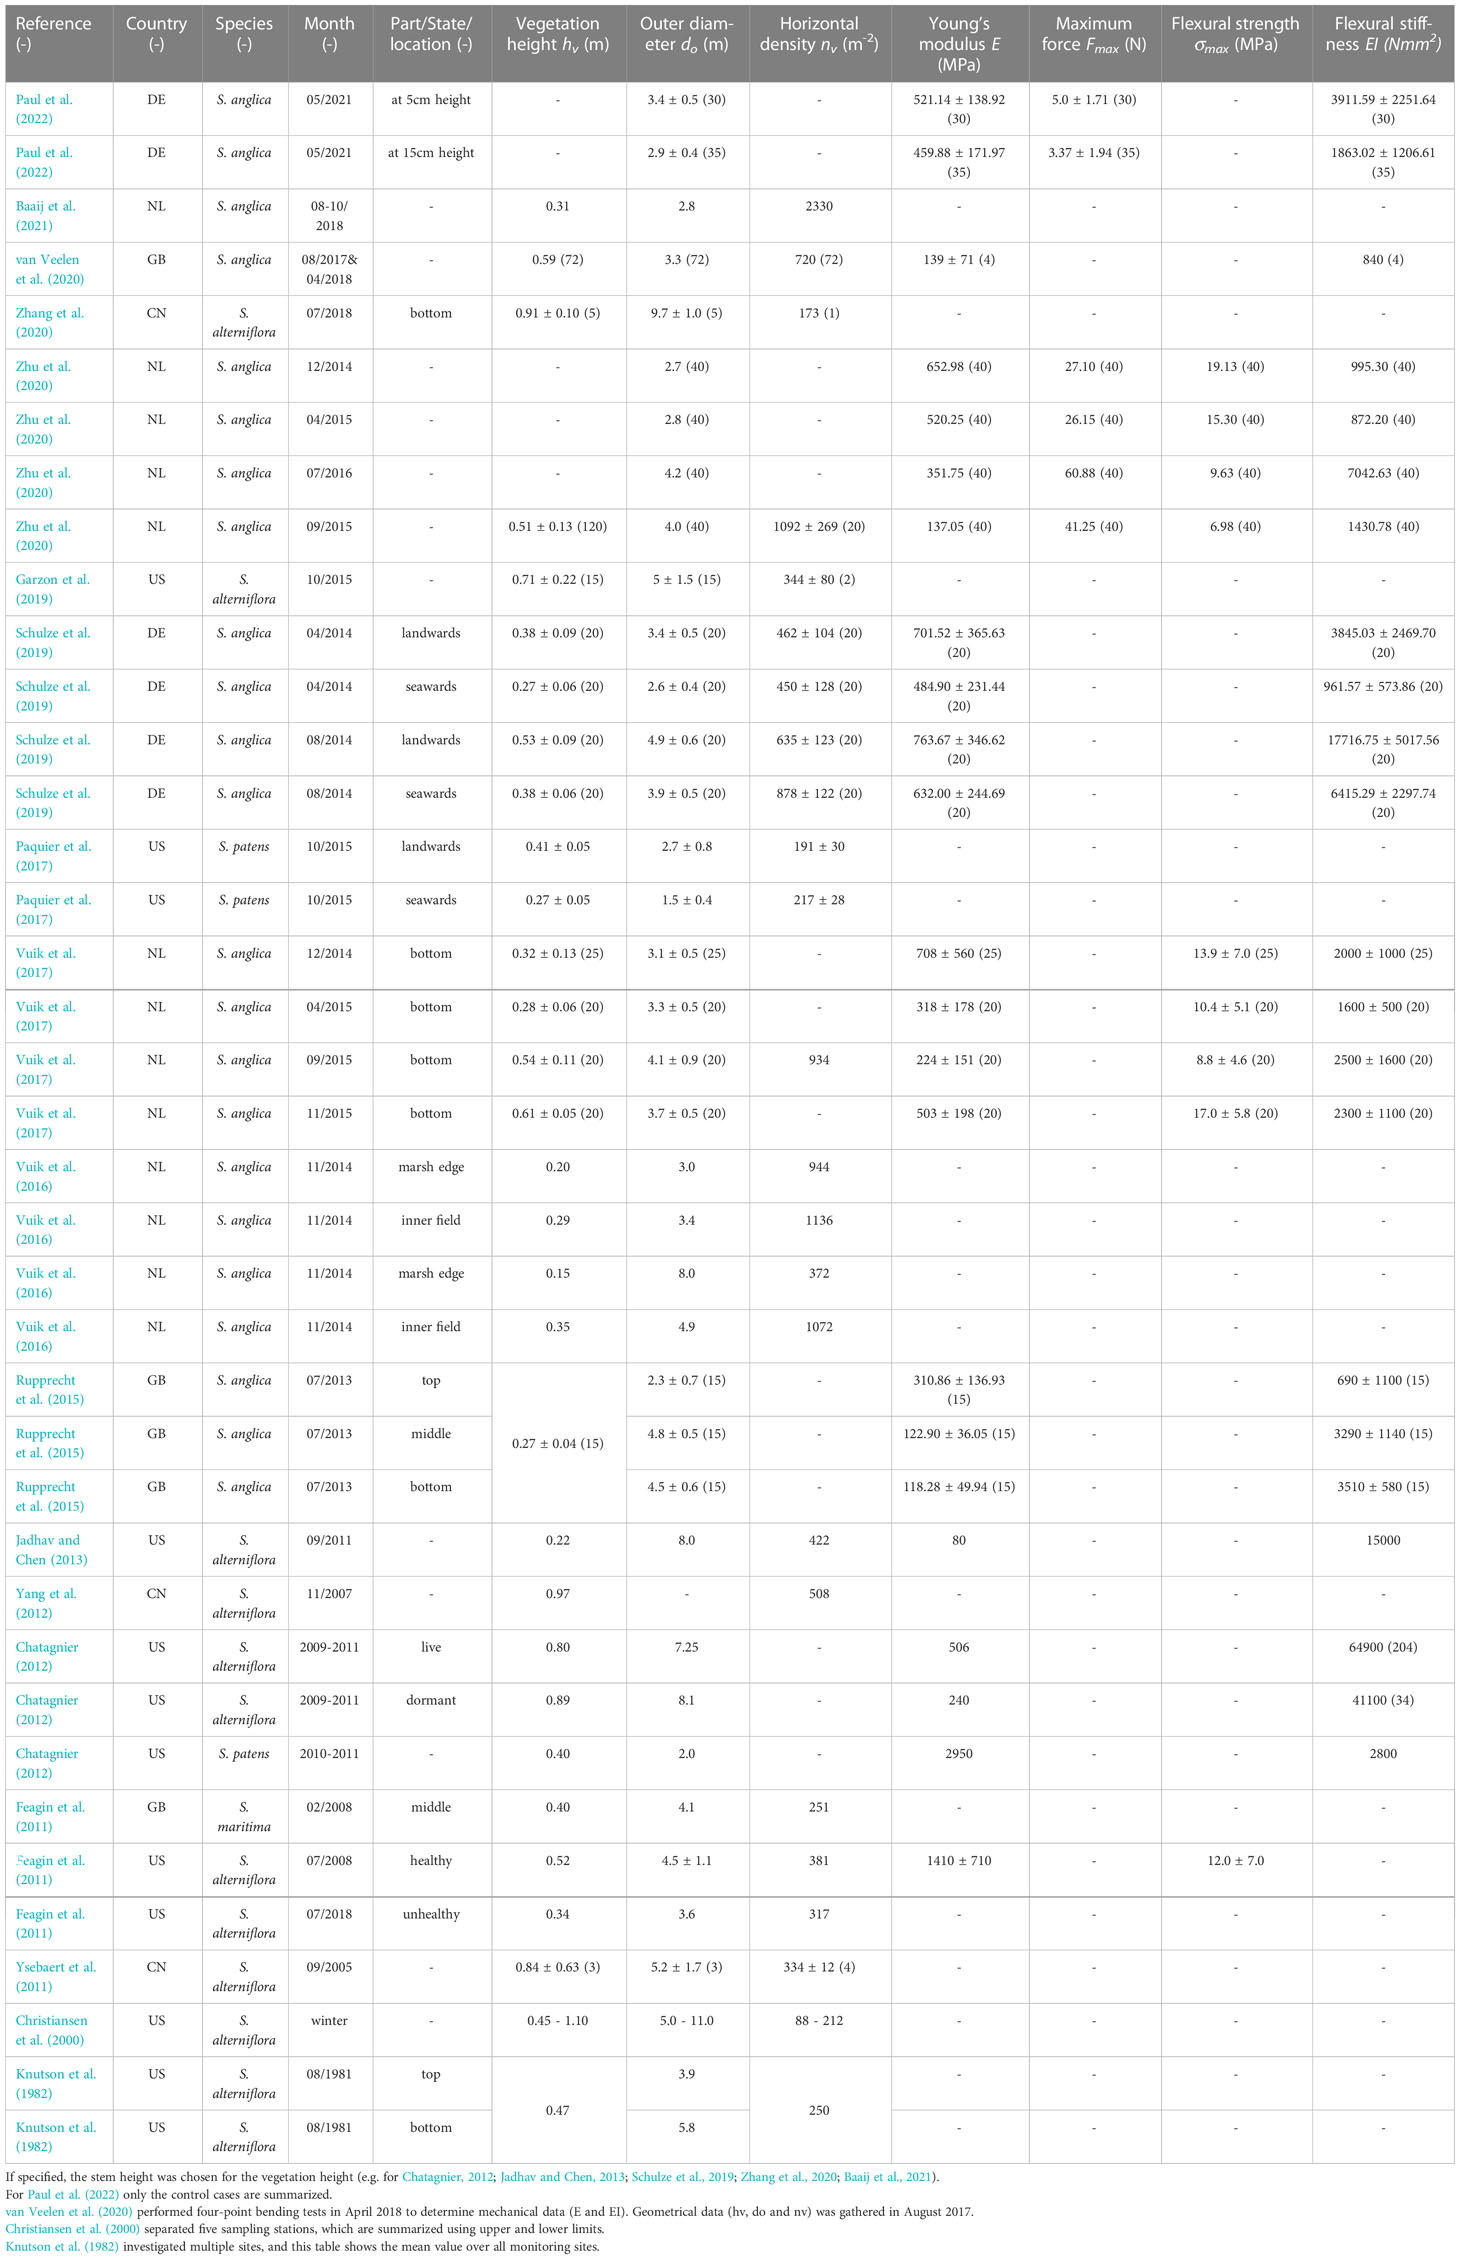
Table 1 Previous investigations of biomechanical properties of Spartina sp. (S.) with mean value ± standard deviation and (sample size) - sorted by publication year.
Looking at previous literature, there is no consistency in the set of parameters, when in season or where along the height the samples were taken (see Table 1), leaving an incomplete picture of what the vegetation properties are. Identifying changes in salt marsh vegetation properties due to seasonality has been the research question of only a few studies so far. Zhang et al. (2022) found a decrease in density, height, diameter and biomass between May and September and an increase between September and November for Scirpus mariqueter and Phragmites australis in the Yangtze River estuary, China. In contrast, Möller and Spencer (2002); Vuik et al. (2017); Schulze et al. (2019) showed an increase in the values for geometrical and mechanical properties of S. anglica as well as an increased wave attenuation over the summer for Northern Europe. Feagin et al. (2011) investigated healthy and unhealthy shoots, focusing on Spartina alterniflora, where healthy areas were defined by low wave erosion and high sedimentation rates and unhealthy areas were characterized by degrading and an accretion deficit. A decrease in biomass (66.25%), height (33.29%), density (16.71%) and the outer diameter (16.39%) was found for unhealthy shoots compared to healthy shoots. Chatagnier (2012) compared dormant to live shoots of Spartina alterniflora and found a decrease of 52% in Young’s modulus for dormant compared to live shoots. Coops and van der Velde (1996) equivalently found higher Young’s modulus for Phragmites australis in growing compared to dormant plants. Environmental impacts, e.g. wave-exposure, have been studied as influencing factor for plant growth. Plants developed a stress-avoidance strategy with shorter, thicker and more flexible properties with low biomass compared to wave-sheltered conditions (Silinski et al., 2018) since rigid grasses experience failure in storm surge conditions (Rupprecht et al., 2017). Equivalently to plant growth depending on environmental conditions, the coastal protection effect of salt marshes depends on the vegetation state of above and below-ground biomass, e.g., Paul and Kerpen (2021) found dry root biomass and soil bulk density to be the key parameter for erosion in the surf and swash zone.
Looking at previous investigations of biomechanical plant properties, for example focusing on Spartina sp. in Table 1, a high variance is found in regard to month of investigation, location, sample definition, sample sizes and parameter set. Especially for investigations looking at vegetation properties in multiple months and investigating seasonality, defining the phenotype of the investigated specimen can help to reduce the variability of the measured properties. Zhu et al. (2020) mentions the browning of the vegetation from autumn to winter, which helps to identify the senescent state of the sampled shoots. Vuik et al. (2017) observed a decay of the vegetation in autumn, with a mix of standing and folded shoots of S. anglica in January. However, for the analysis of the bending behavior, the states were not separated.
This study aims to supplement previous research on biomechanical and geometrical vegetation properties more comprehensively using S. anglica on Spiekeroog as a first example, by looking at seasons previously mostly overlooked. Based on the (i) evaluation of biomechanical properties of S. anglica, (ii) a novel classification of growth periods for coastal protection applications is proposed and (iii) the key time frame to determine the biomechanical properties indicating the ecological salt marsh condition to project its coastal protection potential is identified.
2 Materials and methods
2.1 Study site
This study was conducted on the barrier island Spiekeroog (see Figure 1B) off the Lower Saxonian coastline in Germany. It is part of the National Park Wadden Sea and a World Heritage property (Reise et al., 2010; Wolff et al., 2010; Döring et al., 2021). The diverse landscape of the Wadden Sea includes - amongst other - salt marshes, dune systems, marshlands and intertidal areas stretching across the Netherlands, Germany and Denmark (Reise et al., 2010). Spiekeroog is a dune island protecting the mainland against tides and waves (Wehrmann et al., 2014). Besides sociocultural, ecological and economical challenges, climate change is considered the fastest growing global threat to world heritage (CPSL, 2010; Wadden Sea Board - Task Group Climate, 2017; Heron et al., 2020; Bungenstock et al., 2021). With the Climate Vulnerability Index defining storm surges and flooding as climate stressors in the coastal areas (Day et al., 2020), salt marshes in the Wadden Sea are of crucial importance. On Spiekeroog, salt marshes are found on the back barrier tidal flat of the island, sheltered from seaward wind and wave attack. Consequently, vegetation traits are expected to differ from mainland investigations. Published data sets (Pieck et al., 2022, 2021) can be used to analyze the wave height and period in the back tidal area in front of the investigated salt marsh. Looking at a full year, November 2020 to October 2021, a mean significant wave height of 0.08m and a mean significant wave period of 1.95s were measured at the wave gauge (53°45’29.4”N and 7°43’14.4”E, see Figure 1B).
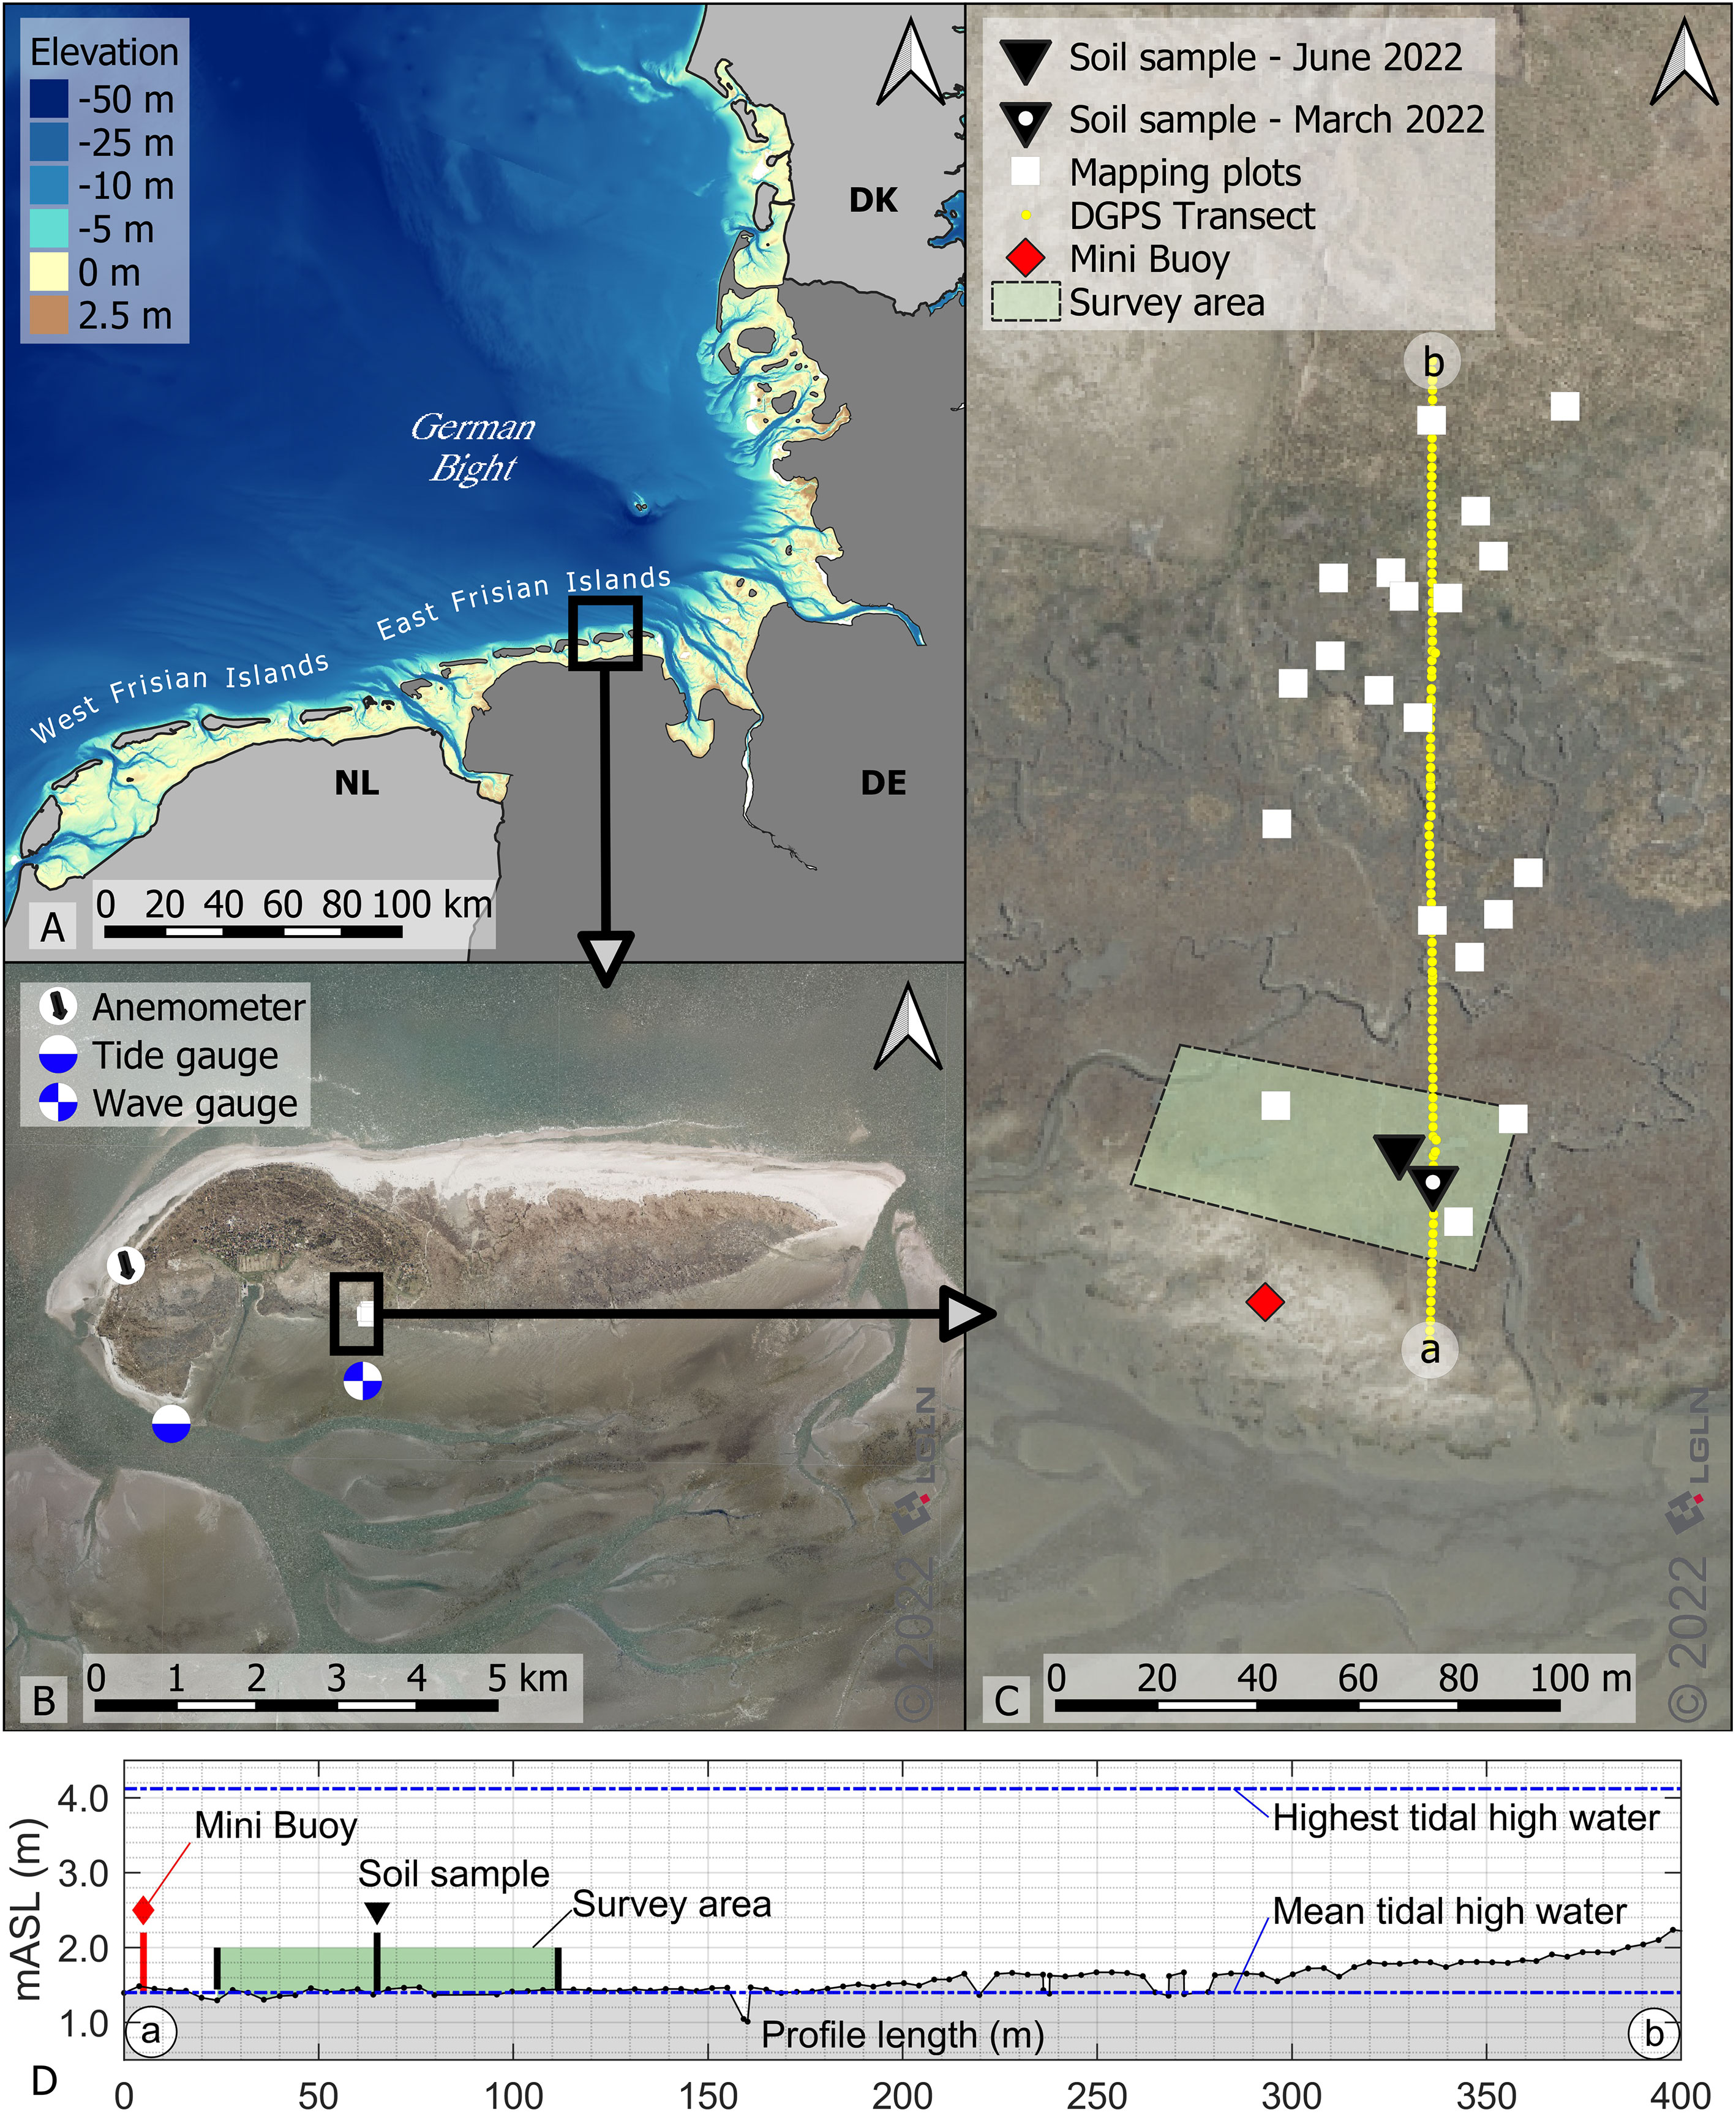
Figure 1 Study site on Spiekeroog in Germany with digital aerial photos by LGLN (2022). (A) Overview of German Bight with elevation by Sievers et al. (2020). (B) Overview of Spiekeroog, including tide gauge by Wasserstraßen- und Schifffahrtsverwaltung des Bundes (2022), anemometer by Deutscher Wetterdienst (2022) and wave gauge by Pieck et al. (2021). (C) Overview of the study site on the south side of Spiekeroog including sample area locations. (D) Transect along the investigated salt marsh measured with a DGPS in December 2021 including sample area and gauge results.
The geometrical and biomechanical properties of salt marsh vegetation in a senescent state as well as during growth period were investigated monthly from December 2021 to July 2022, with winter months being the key season for strong impact events (Reuter et al., 2009). The study site is located in the German Bight (see Figure 1A). The focus region is located on the back barrier side of the island of Spiekeroog in the North Sea (see Figure 1B). Detailed locations of the samples can be found in Figure 1C: vegetation samples taken in the survey area (on average 1.54m above sea level), soil samples taken in March and June 2022, positioning of the Mini Buoy (after Balke et al. (2021), 1.60m above sea level), and mapping squares. Water levels for the island were measured at the tide gauge shown in Figure 1B by Wasserstraßen- und Schifffahrtsverwaltung des Bundes (2022). Mean high tide is 1.4m above sea level and mean low tide is 1.3m below sea level. Therefore, the mean tidal range is 2.7m. The highest tidal water since 2010 was measured in 2013 at 4.12m above sea level. These water levels are included in the elevation measurements of a transect in December 2021 and shown in Figure 1D. For this, a DGPS (Leica Differential GPS - type SR530, accuracy 2cm in each axis) was used, taking standard zero height as reference. The elevation is shown in meter above sea level (mSAL). The distance between the measurements of the transect was approximately 4m.
Typical salt marshes in the North Sea are divided into lower and upper salt marsh, which are characterized by a specific vegetation composition (Pott, 1995; Leuschner and Ellenberg, 2017; Redelstein et al., 2018). For example, the lower marsh is populated by Salicornia sp., Spartina anglica, Atriplex portulacoides, Limonium vulgare and more, while the upper marsh has a higher ratio of herbs, for example Elymus sp. and Festuca rubra. The distribution of species reflects underlying environmental gradients, such as inundation frequency or soil salinity, and is not the result of succession (Bakker, 2014). The lower salt marsh on Spiekeroog follows this classification, but can also be divided into a zone dominated by Limonium vulgare and a zone dominated by Atriplex portulacoides due to the different vegetation bands. However, these salt marsh zones cannot always be strictly divided from each other, and therefore transition zones occur. For the present study, the different salt marsh zones and the transitional zones were mapped, dividing the marsh into an upper and lower marsh, a mid-marsh and two transition zones between the aforementioned areas. Following von Drachenfels (2021), the best time to observe the plant characteristics in salt marshes is between June and September. However, this study hypothesized that the vegetation composition as well as the plants’ geometrical and biomechanical properties in the autumn and winter months differs from that in summer; to that end, the fieldwork was carried out in November and December 2021. For this study, 4 times 1m2 of homogeneous plots were surveyed in each of the five identified zones. Each plot was divided into 16 fields with a size of 25cm by 25cm. The dominant species was identified manually in each field. 320 fields were investigated in total, of which five showed no clear dominance of one species. In addition to the identified species, the terrain height in the center of each field was measured with the DGPS. This procedure makes it possible to identify the dominant species of different salt marsh zones and provides at the same time their spatial distribution. The species named in Figure 2 were found and showed that the most common species in the upper salt marsh on Spiekeroog was Elymus sp. and in the lower salt marsh S. anglica.
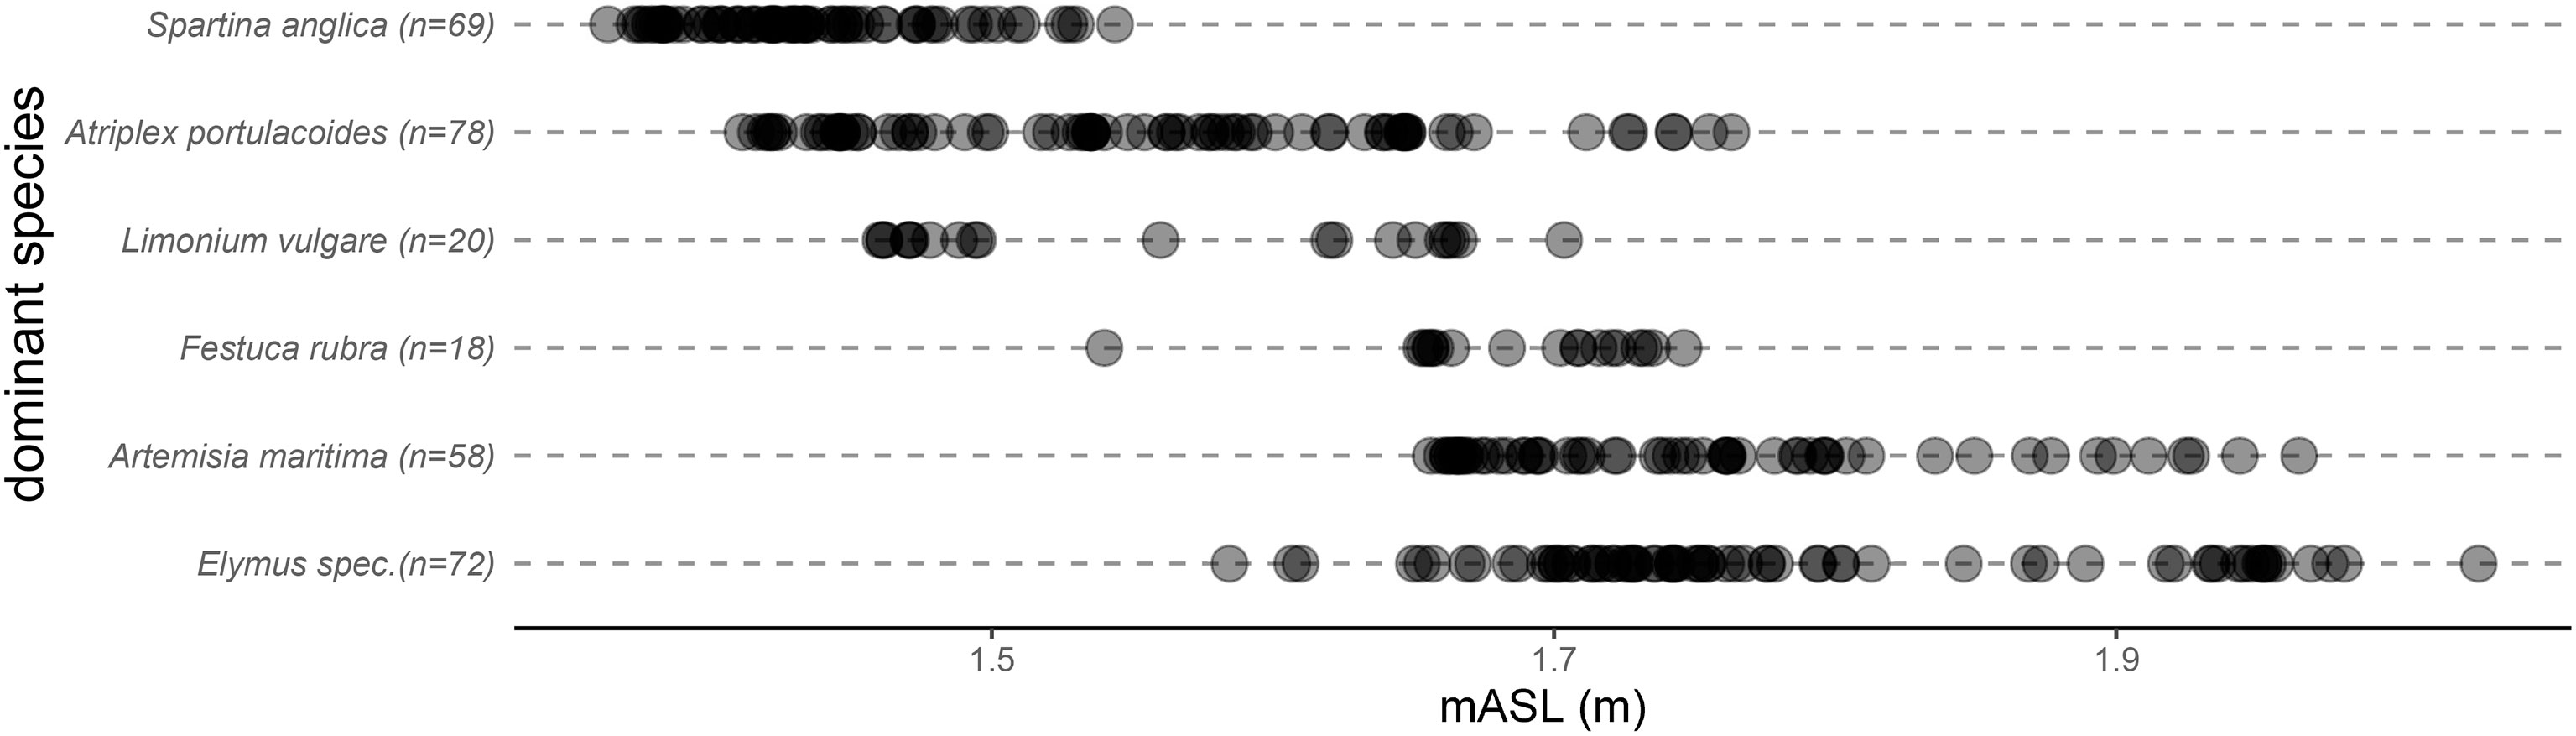
Figure 2 Results from mapping the salt marsh site on Spiekeroog in a senescent state in November and December in 2021 with every dot for a 25cm by 25cm plot the species was dominant in.
In this study, samples of S. anglica (see Figure 3 for visual difference in summer and winter) were collected and their geometrical and biomechanical properties were determined. This species was chosen because it is prevalent year around in the low marsh (see Figure 2, Nehring and Hesse (2008); Petersen et al. (2014); Redelstein et al. (2018)). Furthermore, it has scientifically proven relevance for coastal protection due to its wave attenuation capacity and sediment trapping characteristics (Knutson et al., 1982; van Hulzen et al., 2007; Ysebaert et al., 2011; Garzon et al., 2019; Granse et al., 2021). It has to be noted, that S. anglica is an invasive species in the European Wadden Sea (see for example Nehring and Hesse, 2008). Looking at the geographic distribution of Spartina cytotypes in the European Wadden Sea, the study by Granse et al. (2022) showed, that along the western parts of the Wadden Sea, mainly the dodecaploid cytotype was present.
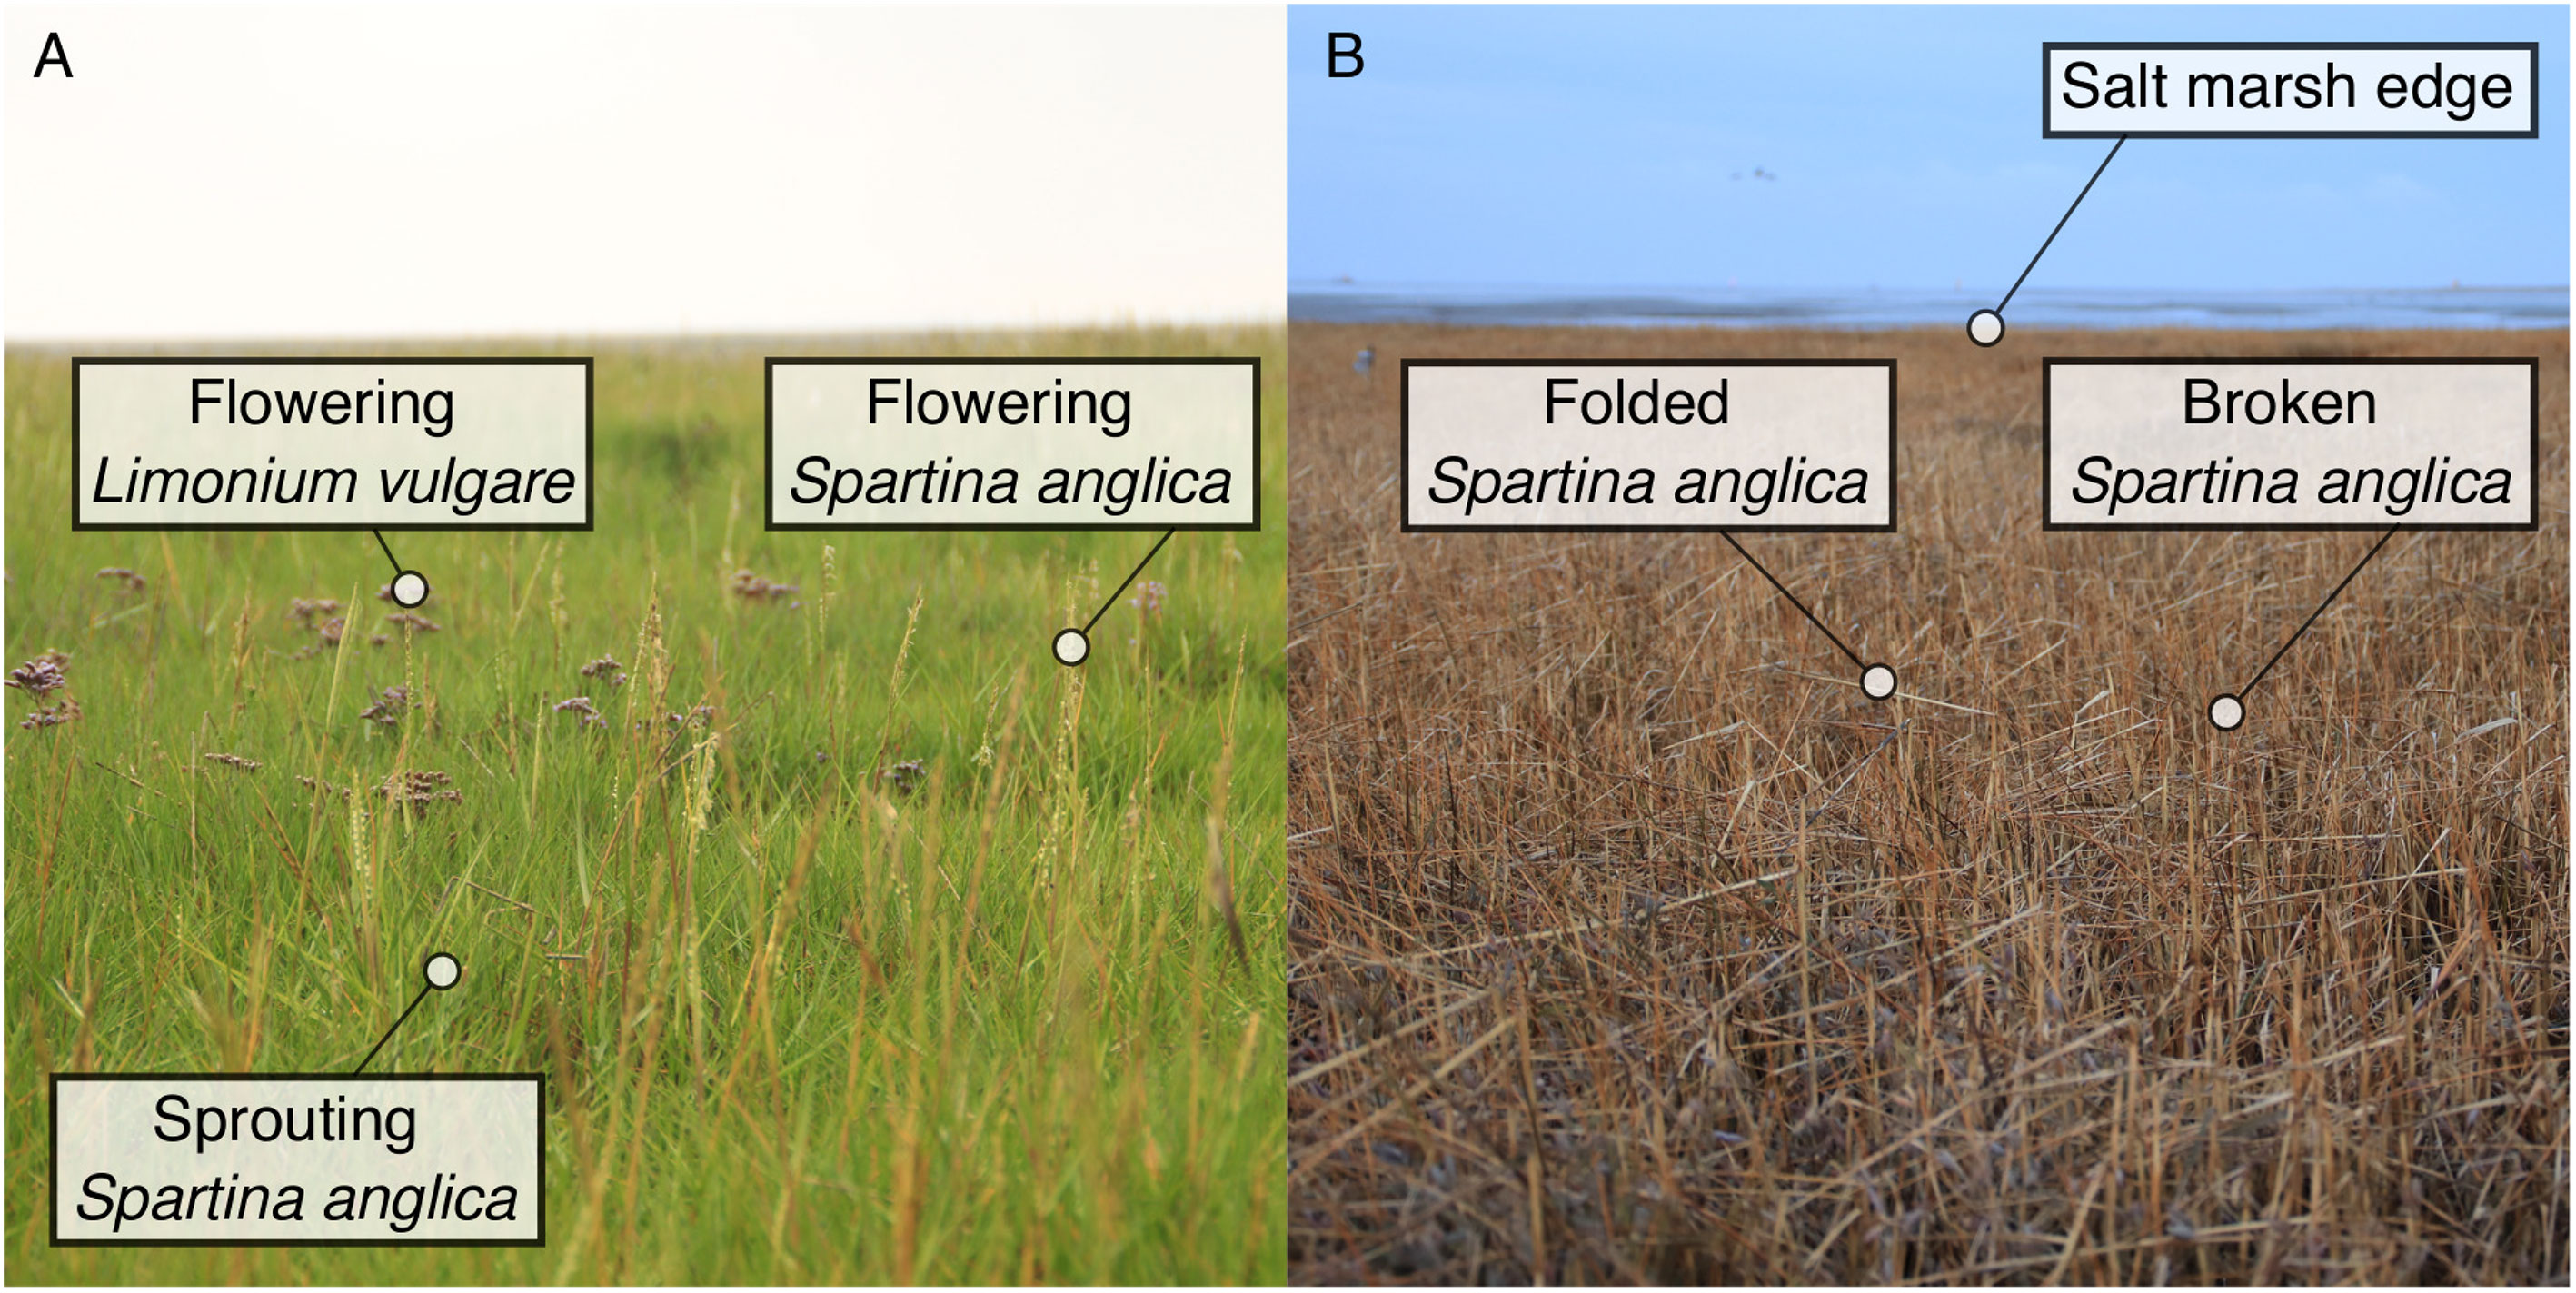
Figure 3 S. anglica on Spiekeroog. (A) Flowering shoots in August 2022. (B) Folded and broken shoots due to storm surge impact in a senescent state (April 2022).
Previous investigations on geometrical and biomechanical properties of S. anglica showed mean shoot heights between 0.15m and 0.97m. An overview of values from previous field research on biomechanical properties of Spartina sp. has been compiled (see Table 1). Biomechanical investigations of plants grown in greenhouses (Bouma et al., 2013; Lara et al., 2016, 2005) as well as studies focused on single shoot properties, e.g. (Leonard and Croft, 2006; van Hulzen et al., 2007; Widdows et al., 2008; Paul and Kerpen, 2021) were excluded for a more consistent comparison.
The cause of change in vegetation cannot only be tied to location and time of sampling, but also to environmental conditions. It is, for example, relevant to understand and map the content of soil moisture, the soil’s grain size distribution as well as information as to how often the sample sites are wetted by tides or surges. Hence, a set of abiotic conditions was measured to put the mechanical properties of S. anglica into perspective and to enable comparisons with results of similar studies. The methods as well as the results for the environmental conditions can be found in the Supplementary Material.
2.2 Vegetation properties
Vegetation properties were sampled monthly from December 2021 to July 2022. Laboratory and field analyses were carried out on the main culm and leaf sheaths, but omitted leaf blades. Therefore, the investigated shoot segment was not equivalent to the culm. The investigated shoots consist of either just leaf sheaths wrapped around each other or include the culm up until the apical meristem (see Figures 4, 5). It has to be noted, that from eyesight it was not possible to determine the position of the apical meristem and whether the investigated specimen include a culm. Visually, this can only be determined, when a shoot includes an inflorescence. Looking at the mechanical behavior of vegetation during the succession of growth states, the unknown variance in morphology has to be considered during analysis. Therefore, this study investigated samples that can contain culm portions or merely leaf sheaths; more broadly, this study addresses the samples as shoots without leaf blades. The shoot height without leaf blades was determined with a folding ruler (accuracy 1mm). Equivalently, the tiller height was measured up to the highest point of the shoot, which most often was the flag leaf for flowering shoots (González Trilla et al., 2013). For broken shoots, this included snapped shoot parts still attached to the base in some cases (see Figure 5). For folded shoots, the term “length” instead of “height” might be used in the future, since the biomass is no longer vertically distributed since the term “height” usually indicates a vertical distance measurement. The measurement of the outer diameter included leaf sheaths as well. It was determined using a caliper with an accuracy of 0.05mm. It has to be noted, that the determination of the outer diameter fails to supply information about the morphology of the sample.
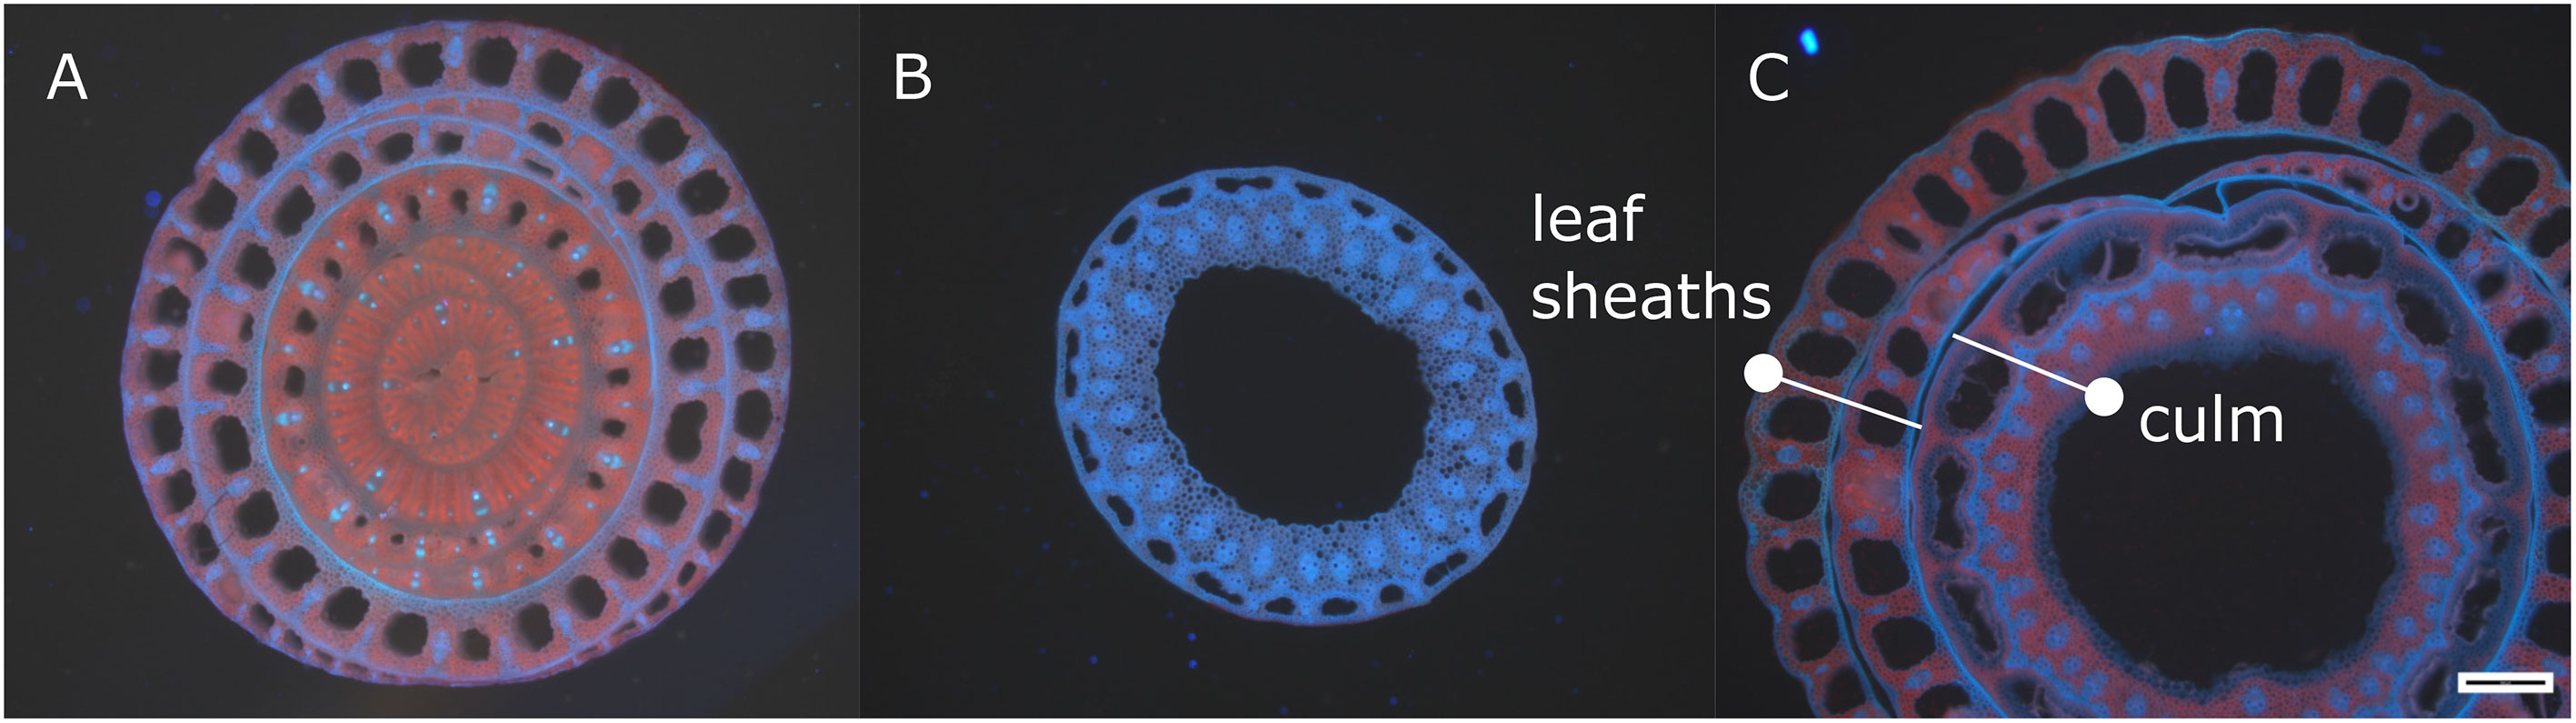
Figure 4 Cross-sections of S. anglica on Spiekeroog exposed to UV light (black scale bar in C applies to all subfigures and equals 500µm). (A) Sprouting shoot with new leaf sheaths growing (May 2022); cross-section above apical meristem. (B) Culm of a sprouting shoot, excluding leave sheaths (May 2022); cross-section below apical meristem. (C) Cross-section of a sprouting shoot with the culm in the center and leave sheaths around it in June 2022.
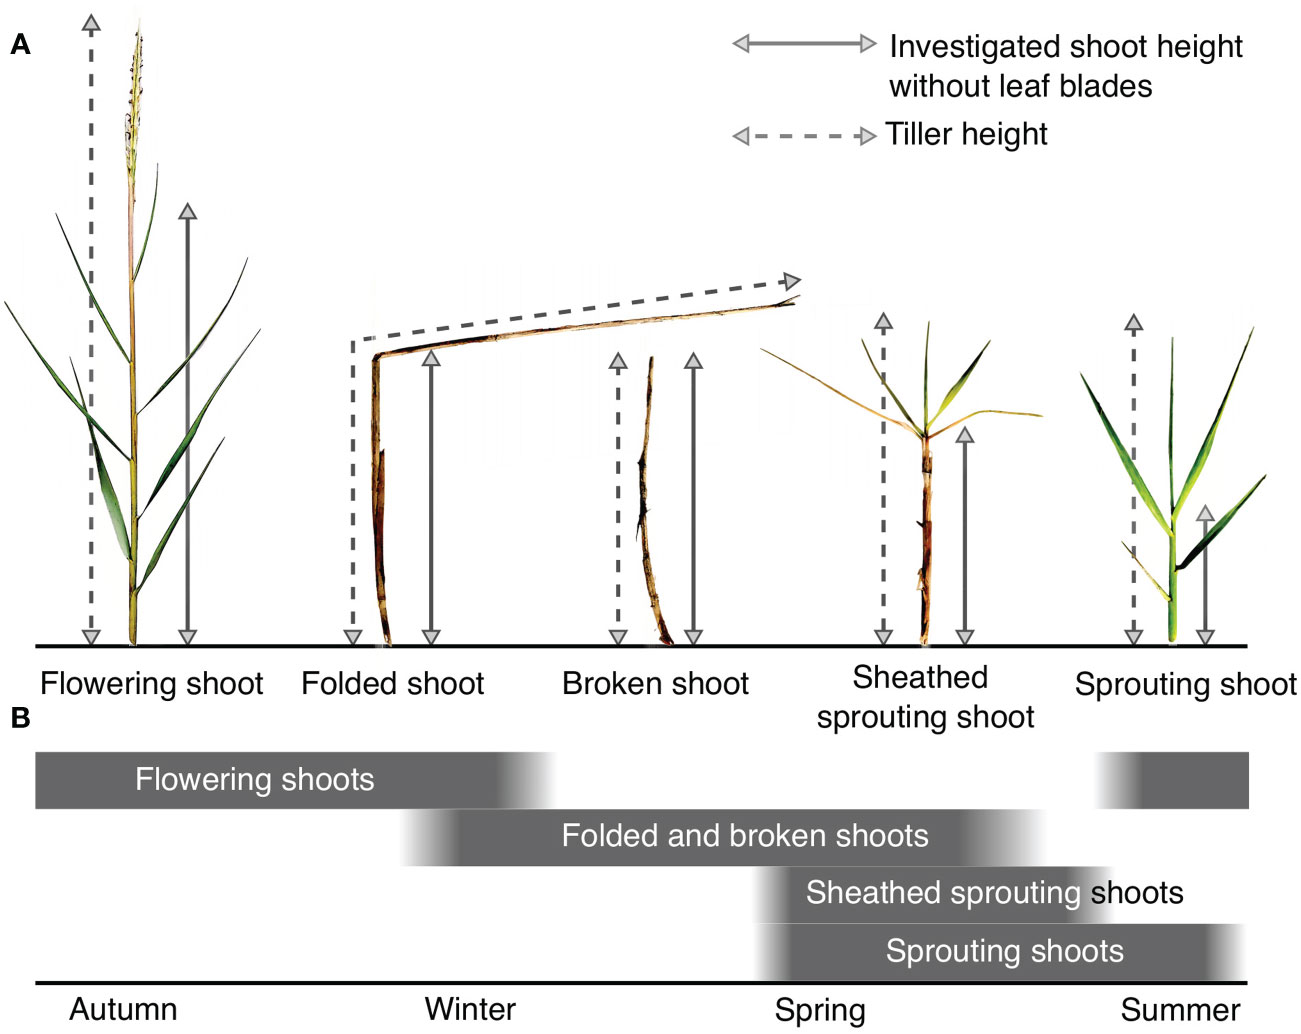
Figure 5 Observed states of S. anglica from December to July. (A) Phenological states with the tiller height and investigated shoot height without leaf blades labeled (not to scale). The tiller height of folded shoots can also be identified as a length. (B) Time frames for the different states observed on Spiekeroog.
For broken shoots of S. anglica the residual height was recorded as shoot height. Vegetation density in the field, defined as the number of shoots per unit area, was counted manually over an area of 0.2m by 0.2m (0.04m2) with the help of a steel frame keeping surrounding specimen away for accurate counts. Count values were extrapolated, yielding a horizontal density per square meter. The counts were conducted by inter-changing researchers regularly to even out any individual influence during sampling with the manual method. Locations were chosen randomly.
Three-point bending tests were executed to evaluate biomechanical properties, which help to understand and eventually target the experimental and numerical simulation of wave-current-vegetation interaction more accurately. Samples were taken from the top, middle and bottom of each specimen in December 2021 and January 2022 to include the biomechanical property changes in a shoot along their vertical axis; these were then analyzed separately following the procedures outlined in Rupprecht et al. (2015); Liu et al. (2021). In preparation of the bending tests, all individual specimens were cut into thirds. These samples were cut to a length of 80mm (Liu et al., 2021) (accuracy ± 1mm), with the lower 80mm for the bottom third, the center 80 mm for the middle third and the lower 80mm for the top third. For a visual of the chosen sampling and testing procedure, the reader may also refer to Figure 6. Field site experience in February 2022 lead to a modification of that method however, since storm surges prior to the indicated point in season resulted in folded and broken shoots of S. anglica (see Figure 3B), rendering the identification of the upper parts of the originally upright shoot portions impossible. Therefore, only the remaining upright standing biomass (bottom) was investigated from February to June 2022, neglecting the part that was bent over or broken off for this study. Because of this, results are only shown for broken shoots, which includes folded shoot samples. If the shoot height was smaller than 80 mm length, shoots were only measured in height and diameter without conducting bending tests. Generally, re-sampling and measuring geometrical and mechanical properties of individual specimen was prevented by taking the samples to the laboratory.
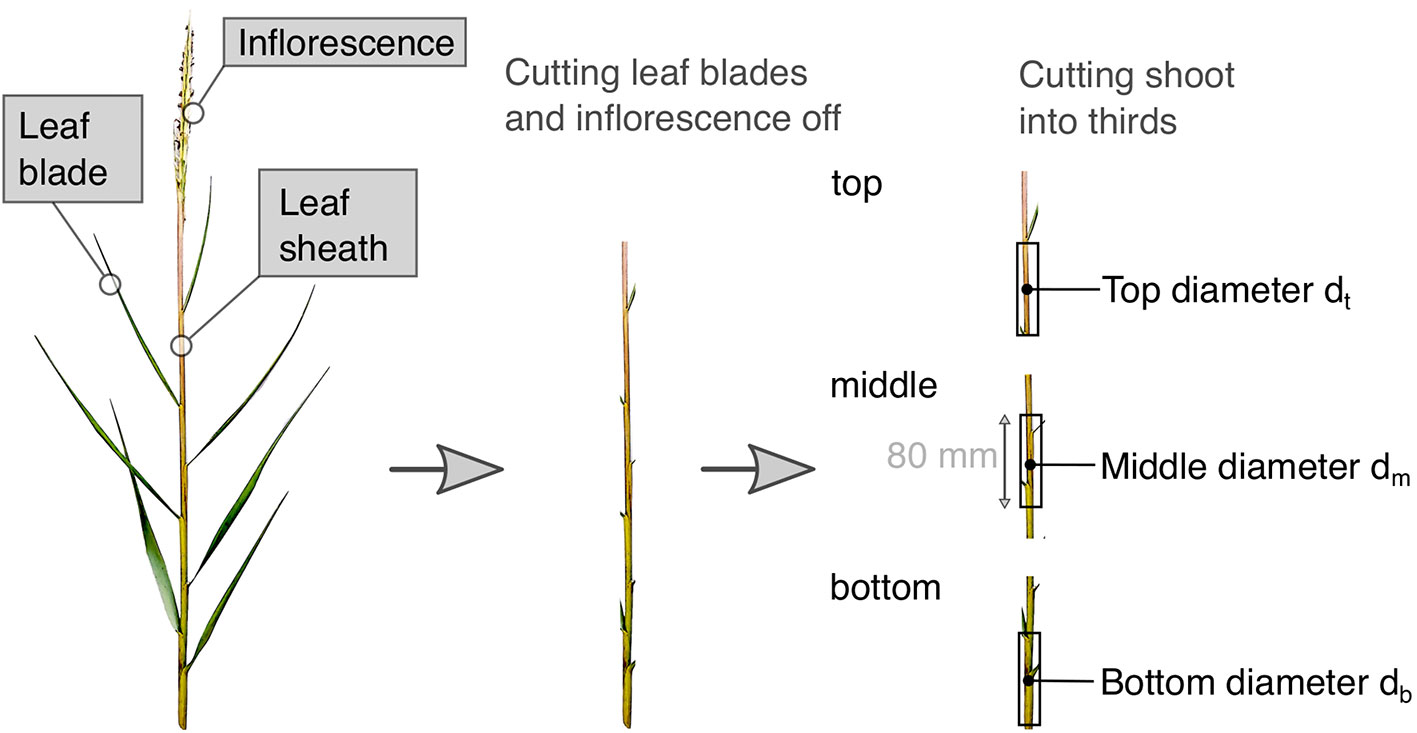
Figure 6 Preparing S. anglica for bending experiments, defining shoot thirds and measuring position for outer diameters.
The bending tests were conducted following ISO 178 (2019) on the day of extracting the vegetation samples from the field to reduce the effect of evaporation and in turn impacting the laboratory analysis through extended sample storage times. The universal testing machine “500N zwicki” by ZwickRoell GmbH & Co KG was used with a load cell, calibrated following DIN EN ISO 7500-1 (2018) from 0.2N to 50N. The uncertainty of the displacement is 0.0830μm. The radii of loading edge as well as supports are 5mm. The span between the two supports is 40mm see Figure 7, Vuik et al. (2017); Liu et al. (2021). The displacement rate was set to 0.05mm/s as quasi-static deformation, as seen in Liu et al. (2021). The preload was set to 0.1N, which needs to be attained by the load cell before a measurement starts. The setup of the bending tests is illustrated in Figure 7. The bending tests resulted in force-deflection relations, which are the basis for further analysis of a sample’s mechanical properties. The force F and the deflection D were then used to determine the stiffness S = F/D for each sample, using the initial slope of the force-deflection curve. In this study, the slope bound by the deflection range from 0.2mm to 1mm was chosen. This section was selected based on the range of the initial linear slope in force-deflection relation for all samples. The failure can be evaluated using the maximum force Fmax (also called breaking force), which is defined as the maximum value from the force-deflection curves (Zhu et al., 2020; Liu et al., 2021). For bending experiments with salt marsh species, the maximum force measured defines a folding rather than a breaking of the samples see Figure 7B, Vuik et al. (2017).
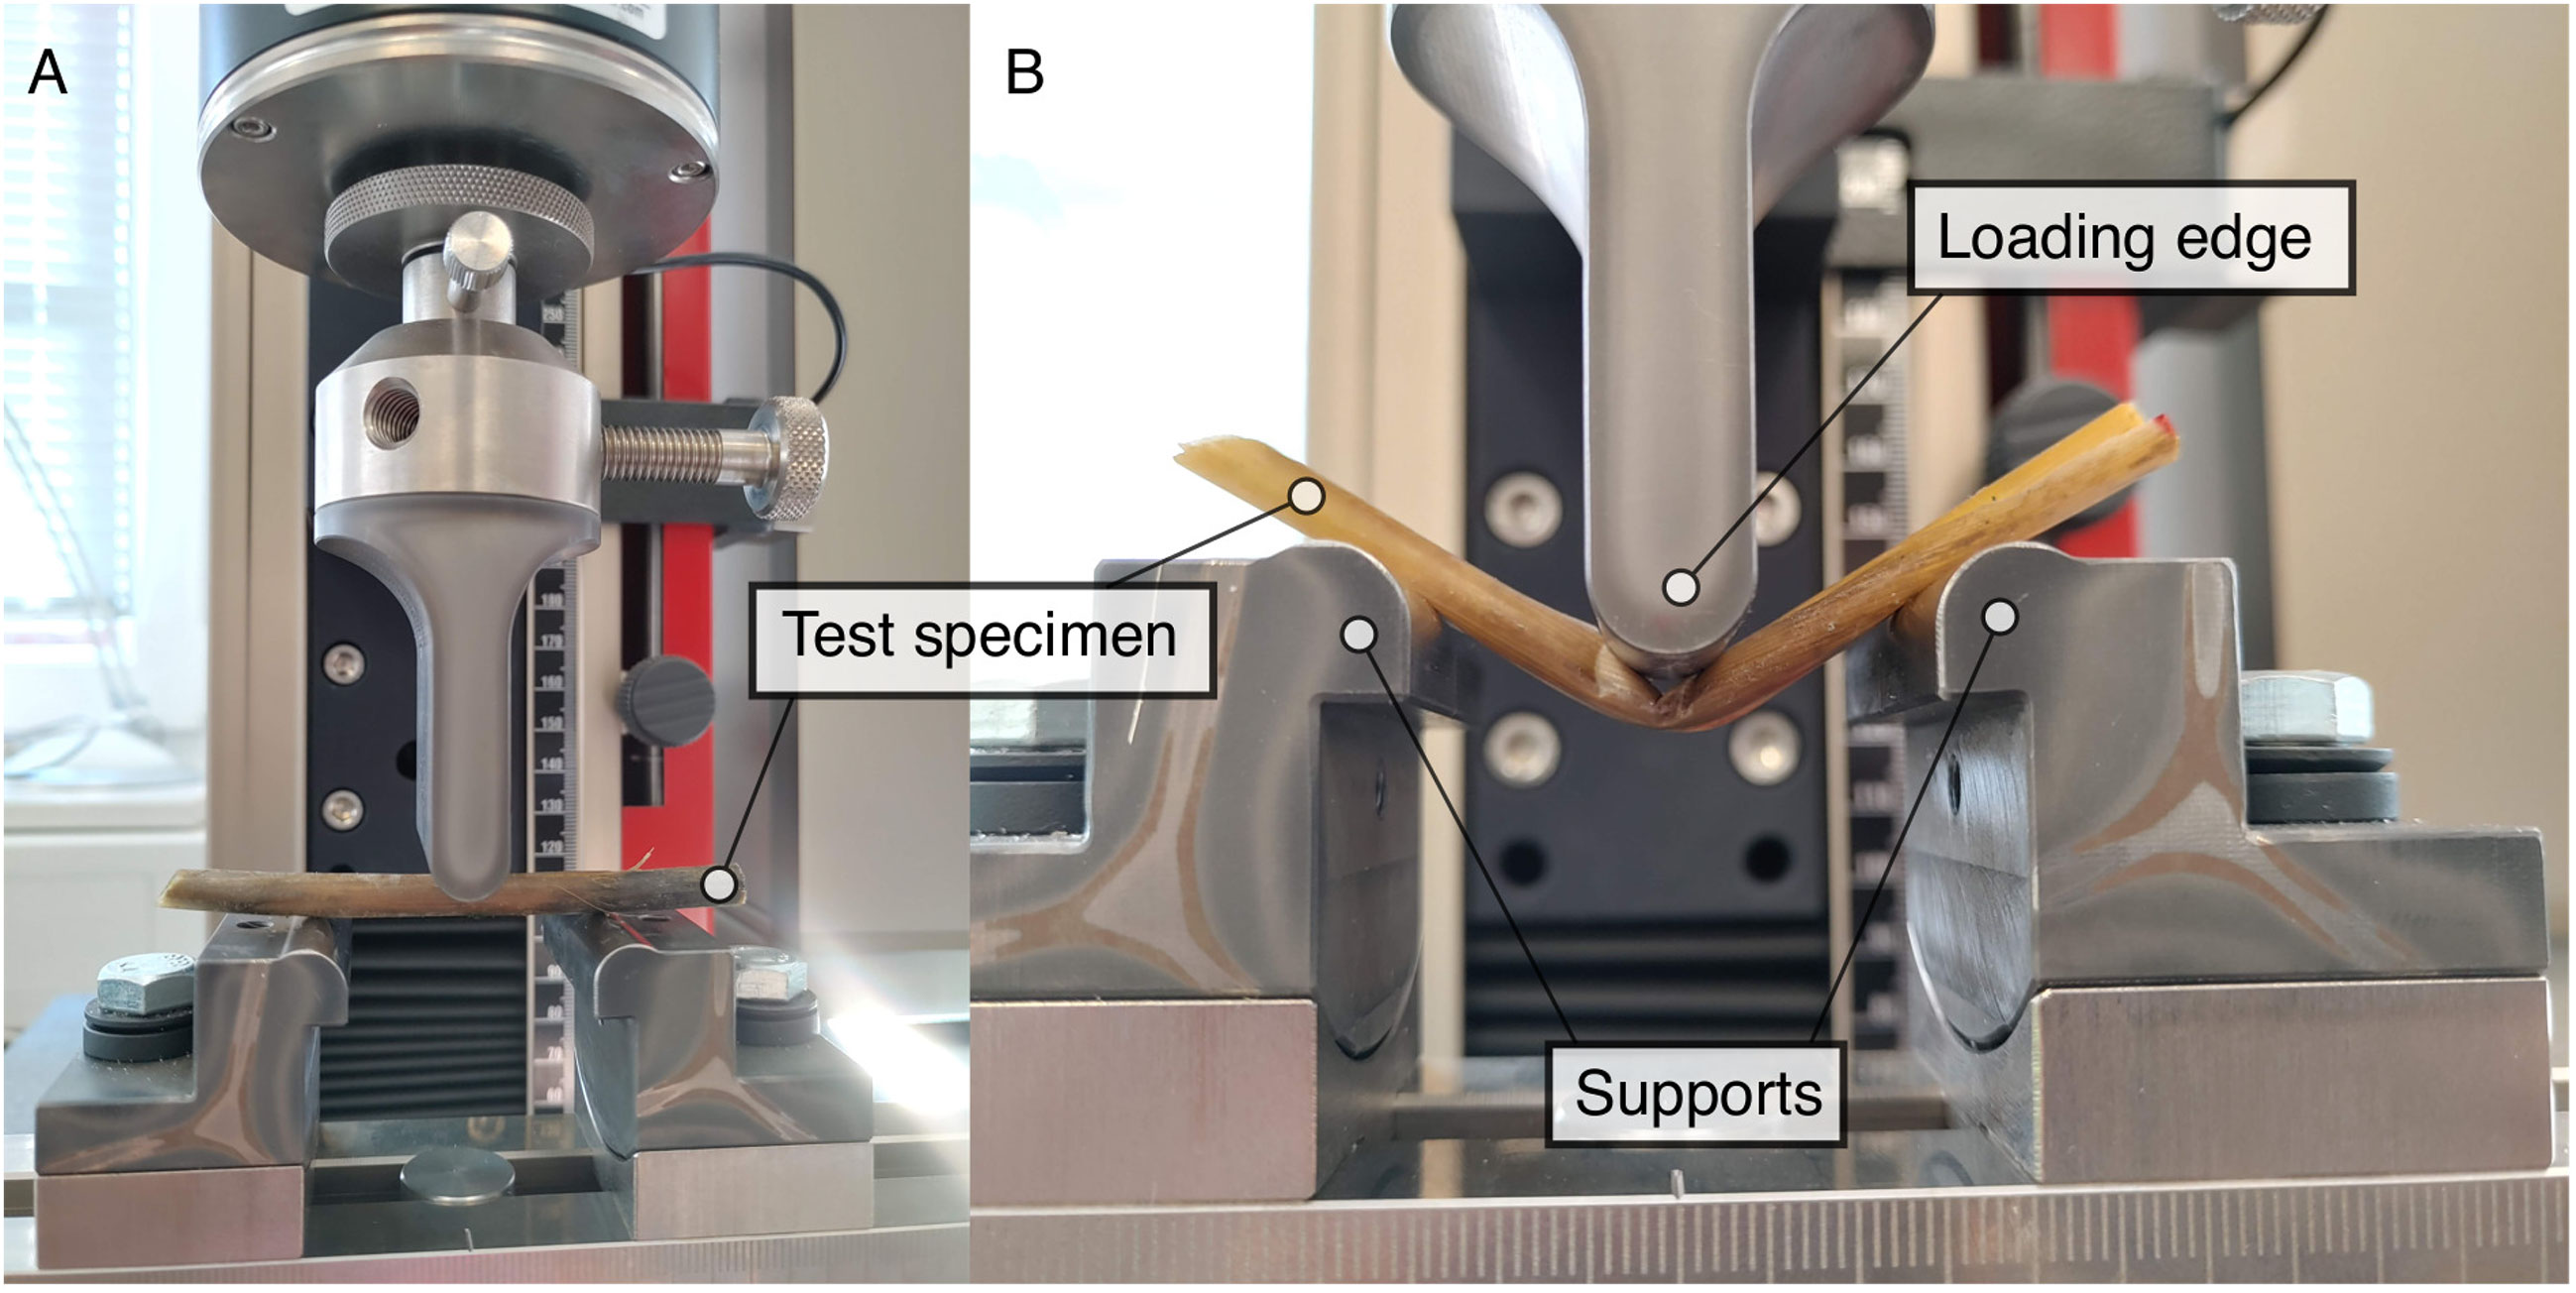
Figure 7 Setup of the bending machine after ISO 178 (2019) in March 2022 with a broken shoot of S. anglica. (A) Setting the bending test up. (B) Folding of the test specimen after bending test.
Additionally, bending tests were conducted with the force applied from various cardinal directions, which will be referred to as “bending force direction”. In this study, the loading edge was applied on north, west and south facing sides of different samples. This was done in order to identify possible environmental influences such as prevalent wind conditions or wave attack angles onto S. anglica sample stiffness.
2.3 Phenological classification
Throughout the field campaigns, S. anglica changed in terms of standing biomass. Five states characterized by their respective phenological differences were observed, which are illustrated in Figure 5A. The geometrical and biomechanical data collected during the field campaigns were correlated to these states (see Figure 5).
The months of December and January were dominated by “flowering shoots” from the previous growth period. After storm surges that followed these months, many flowering shoots were broken (see Figure 3). Some specimen had broken parts still connected to the rooted part (“folded shoots”). For the majority of shoots, however, only the rooted part remained (“broken shoots”, see Figure 5A). These shoots in a senescent state were sampled up until June. From May on, “sheathed sprouting shoots”, which are surrounded by biomass of the last growth period, started to appear accompanied by “sprouting shoots” without remanent biomass. The sprouting shoots were investigated with the bending tests in June and July, since growth height was still insufficient in May to follow the above outlined sampling procedure. It is noted, that the residual biomass around the sheathed sprouting shoots decomposes over time, which leads to a shoot similar to a sprouting shoot. Therefore, only properties of sprouting shoots were recorded in July, which were possibly sheathed sprouting shoots before.
Since leaf blades were mostly missing for flowering and broken as well as folded shoots, leaf countings were only conducted for sheathed and sprouting shoots. To determine the height of the shoots of S. anglica in the field after storm surge season, only the upright standing biomass was evaluated for folded shoots.
Thus, measured values for outer diameter, stiffness and maximum forces obtained from folded and broken shoots were collected in the same data set (see Table 2).
2.4 Statistical analysis
Natural variations of S. anglica shoot specimen are self-evident, and thus, the acquired field data entail a site-specific variance, subject to the plant material, environmental conditions and other factors. To investigate seasonal differences, which are a prime interest in this work, a statistical analysis is conducted. The statistical analysis was performed with R 4.2.2 (R Core Team, 2022) and was based on Logan (2010). First, the data were tested for normal distribution using qq-plots and the Shapiro-Wilk test. The homogeneity of the variance was tested using Bartlett’s test. If both assumptions were met, an ANOVA was performed and if necessary, a Tukey-Test was used for post-hoc testing after the ANOVA. If one or both assumptions were not met, a Wilcox test (for two groups) or a Kruskall-Wallis test (for more than two groups) followed by Dunn’s test were used to determine significant differences between the investigated groups. A significance level of p < 0.05 was used in this study. Significant differences between groups are marked by varying letters next to error bars in the figures.
3 Results
3.1 Shoot height
For the shoot heights, flowering shoots, broken shoots, sheathed sprouting shoots and sprouting shoots were distinguished. Shoot height was measured from ground level to the top, excluding leaf blades or folded parts, which are treated like broken shoots. The tiller height as shoot height including leaves and folded over parts can be found in Table 2.
Considering the development of the shoots through August to December, sprouting shoots are expected to grow into flowering shoots to complete the plants’ life cycle. Flowering shoots in December and January measured 29.6cm on average, while broken shoots were smaller, averaging 22.6cm (see Figure 8A). The mean shoot height for sheathed sprouting shoots measured 12.4cm. Sprouting shoots show the smallest height, with an average of 7.3cm. Significant differences for the phenological states of the specimen can be seen for each state (see Figure 8).
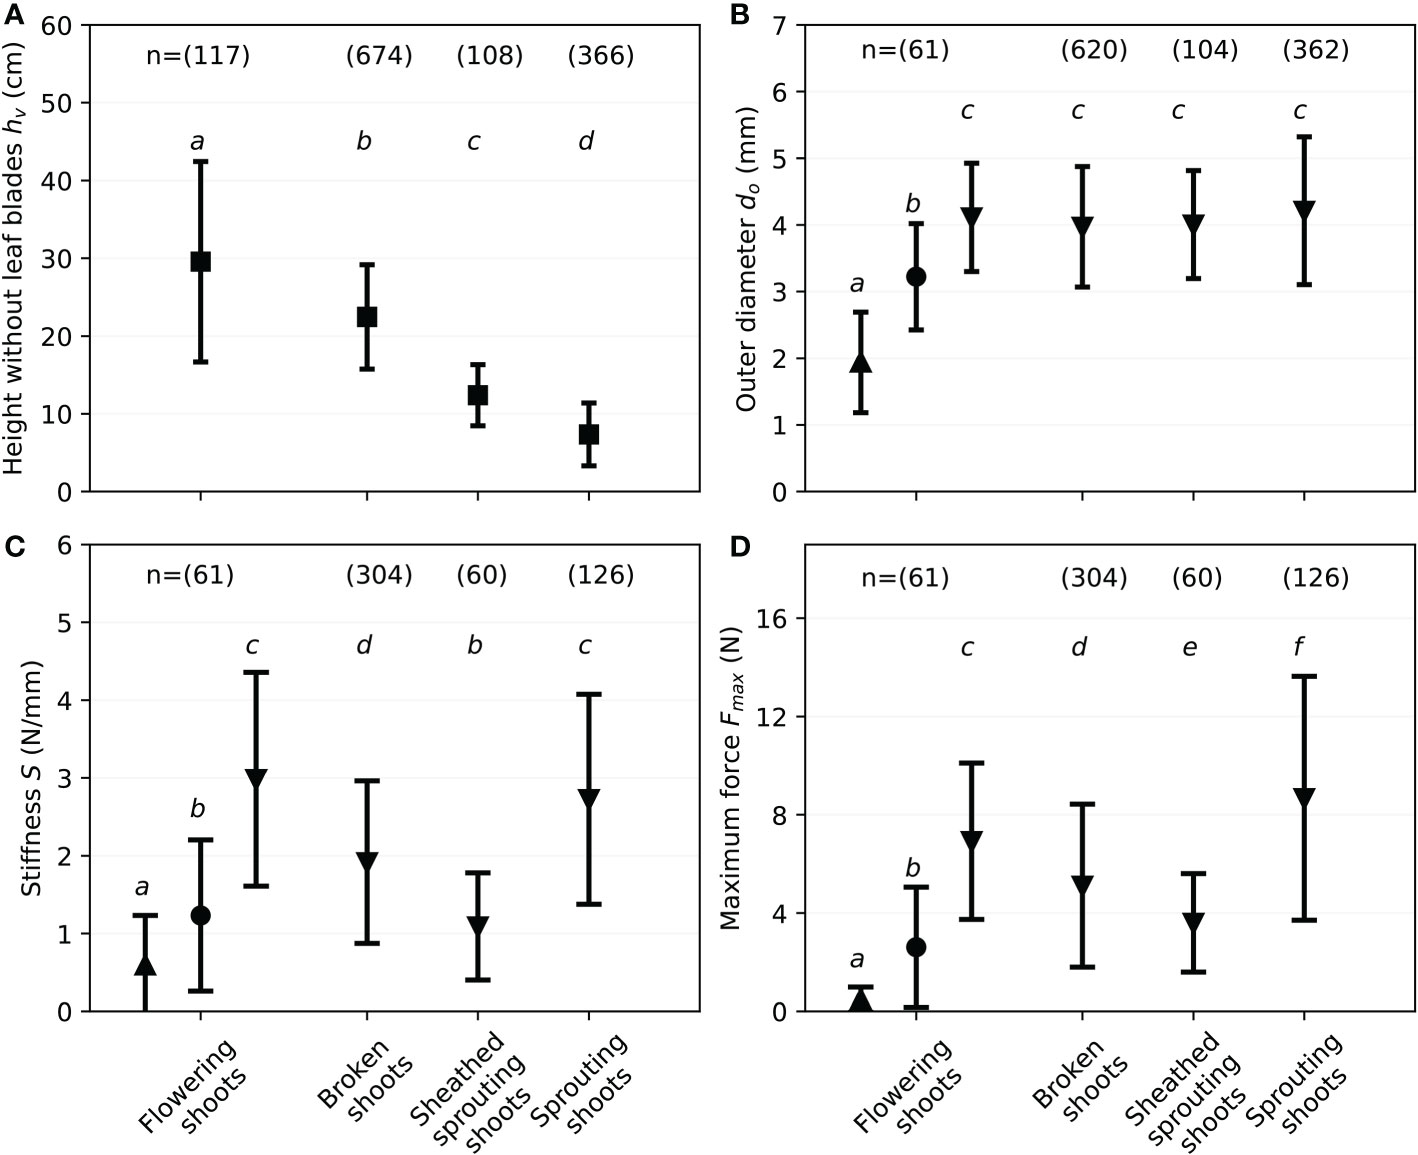
Figure 8 Results of monthly field investigations on S. anglica from December to July, showing mean values and standard deviation for each phenological state defined in Figure 5 with the flowering shoots separated into top (▲) middle (●) and bottom (▼) third, with small letters indicating significant differences. (A) Shoot height without leave blades hv. (B) Outer diameter do. (C) Stiffness S. (D) Maximum force Fmax.
3.2 Horizontal density
The density measurements before the storm surge season (December and January) resulted in 1933 ± 592 shoots per square meter (n = 12). With broken shoots indicating a large storm, densities showed afterwards (February, March and April) a mean value of (1265 ± 448) m-2 (n = 36). Summer counts (May, June and July) resulted in (1239 ± 650) m-2 (n = 97). A clear change over time cannot be seen, but a lower shoot density in May (n = 40), with (1077 ± 214) m-2, compared to the winter months indicates a density reduction over the winter due to broken shoots degrading. For 23 counts in June, the varying states of S. anglica were counted separately. The ratios resulted in 40% dried and broken shoots from the previous season and 60% sheathed or non-sheathed sprouting shoots. Since the died off biomass around sheathed sprouting shoots were rotting away, it was difficult to differentiate the two states in the field reliably at this time.
Since leaves need to be considered in addition to the horizontal vegetation density for vegetation-flow interaction, in May, June and July, the number of leaves per specimen were additionally counted. For the sheathed sprouting specimen, between 1 and 8 leaves were counted with a mean value of 3.4 ± 0.9 (n = 108). The sprouting shoots presented between 2 and 8 leaves for each shoot with a mean value of 4.3 ± 0.9 (n = 366). A correlation between number of leaves and shoot height was not evident.
3.3 Outer diameter
Monthly measurements of the outer diameter are presented next. Since individual shoots were divided in parts of 80mm each and the diameter was measured in the center of each part’s length, the outer diameter of the bottom third was measured 40mm above the ground. Results indicate fairly similar diameters for every month and for the different growth stages. This work found a mean bottom shoot diameter db of (4.1 ± 1.0) mm (n = 1150) by averaging over all states and all sampling campaigns between December and July. To separate the states and show intervals for the mechanical properties, Figure 8B shows the outer diameter for the varying states measured between December and July (see Figure 5). While the bottom outer diameter of broken shoots differs significantly to the bottom outer diameter of sprouting shoots, the diameters of the other states are not showing significant differences (see Figure 8B). Overall, the mean outer diameters for the varying states lie between 4.0 and 4.2mm (see Table 2).
For the flowering shoots with larger heights, the diameter decreased with the vertical position of the sample (see Figure 8B). Summarizing the data sets from December 2021 and January 2022 with n = 61 reveals significant vertical differences for the outer diameter (see also Table 2). With the mean outer diameter of the top third dt at (1.94 ± 0.75) mm and the mean outer diameter of the middle third dm at (3.22 ± 0.80) mm, the diameter reduced to the top of the shoot.
3.4 Mechanical behavior
To analyze the mechanical behavior of the plant material, the stiffness S and the maximum force Fmax were calculated for the states (see Figures 8C, D as well as Table 2). Looking at the bottom part of the investigated states of S. anglica, the mean stiffness S is 2.98N/mm for flowering shoots and 2.73N/mm for sprouting shoots, broken shoots only withstood 1.92N/mm and sheathed sprouting shoots 1.09N/mm. Similarities were detected comparing the bottom stiffness of flowering shoots and sprouting shoots, whereas the other states show significant differences (see Figure 8C).
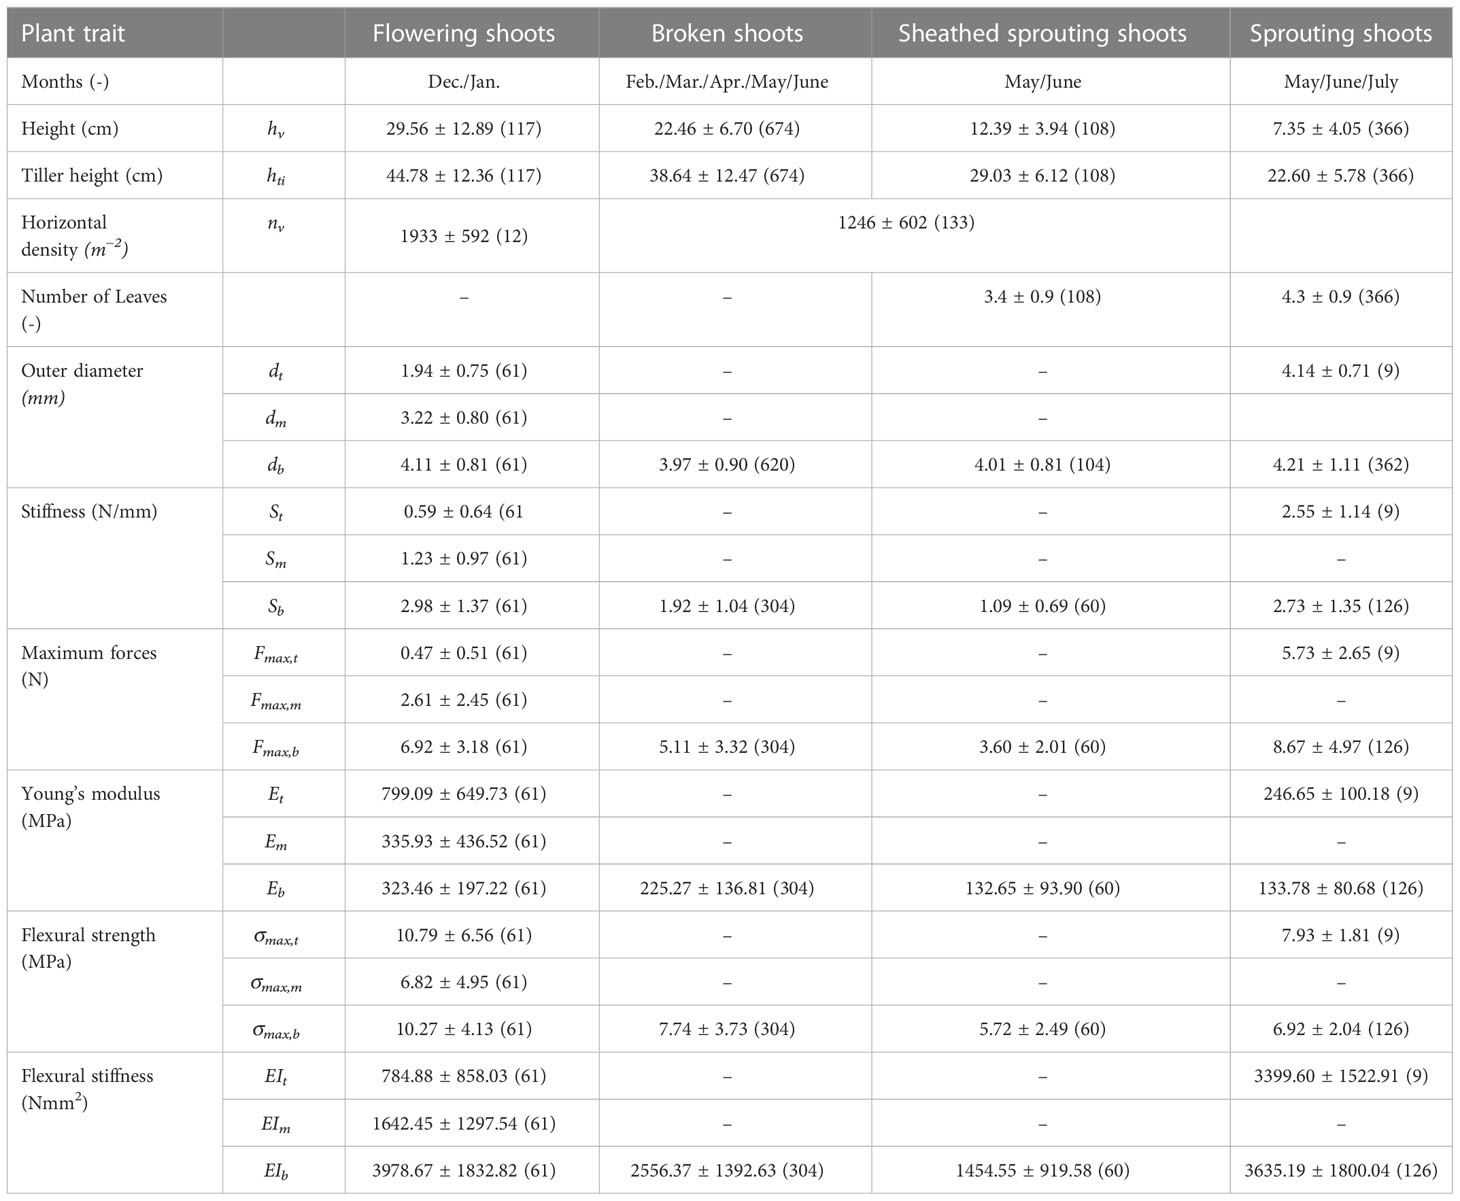
Table 2 Summarizing field measurement results for the states of S. anglica (December 2021 to July 2022) as seen in Figure 5 with mean values ± standard deviation and sample size (n) as well as a division in top –t, middle –m and bottom –b thirds.
The results for the maximum force Fmax show significant differences for each phenological state comparing the results for the bottom part (see Figure 8D and Table 3). The bottom third of flowering shoots showed on average a maximum force of 6.92N, broken shoots 5.11N, sheathed sprouting shoots 3.60N and sprouting shoots 8.67N.
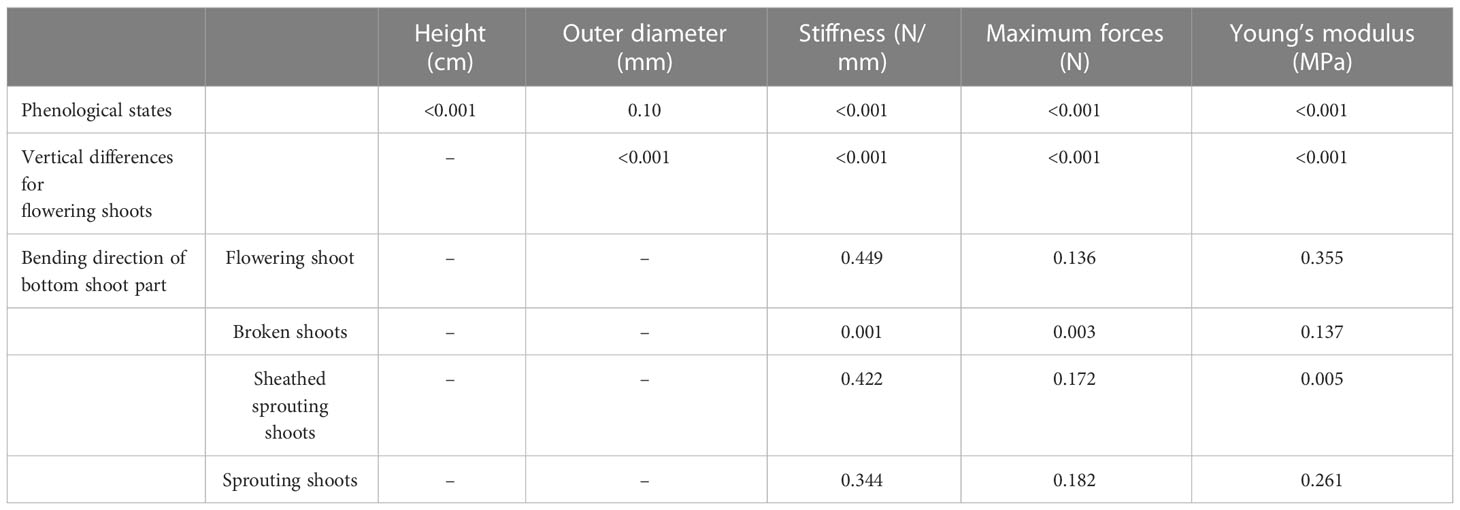
Table 3 P-values resulting from the statistical analysis.
Looking at broken shoots each month from February to June, a decrease in stiffness S of around 50% and maximum force Fmax of around 60% was seen. The stiffness S of the sprouting shoots increased by 48% between June and July, while the maximum forces Fmax increased by 71%, which shows a significant difference between these two months.
For the vertical difference of the mechanical behavior of flowering shoots (see Figures 6, 8), a decrease of stiffness and maximum force correlating with a higher vertical position on the specimen was expected since the outer shoot diameter decreased. The stiffness S for flowering shoots reduced with height from 2.98N/mm with a mean outer diameter of 4.11mm at the bottom part over 1.23N/mm with a mean outer diameter of 3.22mm for the middle part to 0.59N/mm with a mean outer diameter of 1.94mm. The maximum force developed equivalently (see Figure 8, summary in Table 2). This shows significant differences for stiffness S and maximum forces Fmax for the vertical position of the plant material.
For flowering shoots, the force direction plays no significant role, since the stiffness S for each part resulting from force from the west facing side of the shoot correlates to the stiffness S of the south facing part of the shoot (see Figure 9A). For sheathed sprouting shoots (Figure 9C) and sprouting shoots (Figure 9D), the difference of the stiffness S for varying bending force direction is not significant (see Table 3). For broken shoots, a significant difference can be identified (Figure 9B) in the force applied on the west side of the shoot with 1.5N/mm compared to 2.1N/mm of force applied to the north. The mean stiffness resulting from forces applied to the south side of the shoot (1.9N/mm) shows no significant differences with the results from applying force on the north as well as the west side. Directionality of maximum forces Fmax is similar to stiffness S. For sheathed sprouting shoots (Figure 9G) and sprouting shoots (Figure 9H), the directionality is not significant (see Table 3). Looking at the bottom parts of the flowering shoots, differences are not significant as well (see Table 3), but comparing directions as well as vertical differences (see Figure 9E) shows significant differences only for the top part. Broken shoots show a significant difference comparing the maximum forces of North as well as South to the West.
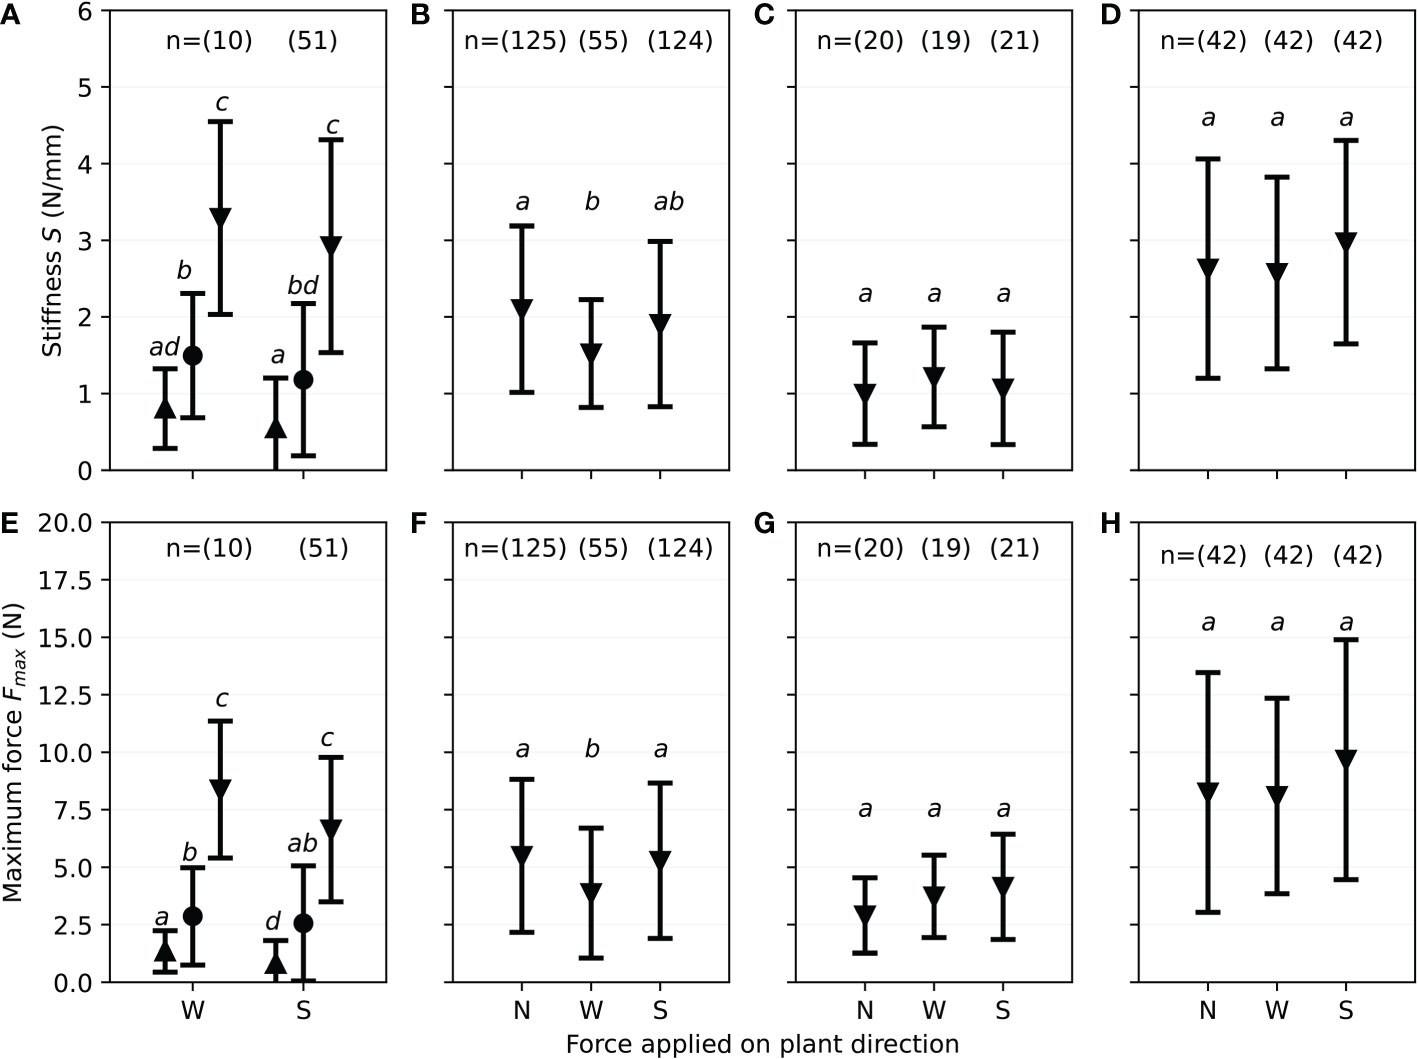
Figure 9 Results of monthly field investigations on S. anglica from December to July, showing mean values and standard deviation divided for each phenological state showing the stiffness S and maximum force Fmax divided for the shoot direction pointing towards the load edge during three-point bending tests (N, North; W, West; S, South) with the flowering shoots separated into top (▲), middle (●) and bottom (▼) third, with small letters indicating significant differences. (A) Directionality of stiffness S for flowering shoots. (B) Directionality of stiffness S for broken shoots. (C) Directionality of stiffness S for sheathed sprouting shoots. (D) Directionality of stiffness S for sprouting shoots. (E) Directionality of maximum forces Fmax for flowering shoots. (F) Directionality of maximum forces Fmax for broken shoots. (G) Directionality of maximum forces Fmax for sheathed sprouting shoots. (H) Directionality of maximum forces Fmax for sprouting shoots.
In addition to stiffness S and maximum forces Fmax, Table 2 includes the Young’s modulus E, the flexural strength σmax and the flexural stiffness EI. Note, that the flexural stiffness EI is proportional to the stiffness S, while only depending on the distance of the supports for three-point bending tests (see Rupprecht et al., 2015, for equations to calculate EI). These values can be used for comparing the different studies in the future, considering varying settings for three-point bending tests (see Supplementary Material), sample time, location and environmental conditions.
4 Discussion
This study investigated the biomechanical properties of S. anglica on the barrier island Spiekeroog in the Wadden Sea monthly, proposing a novel classification of phenological states. In this section, difficulties occurring during the field investigation as well as the laboratory testing are reviewed. Furthermore, open research questions and answers provided by this study are discussed to be later summarized to draw conclusions.
In the literature pertaining to biomechanical properties of salt marsh vegetation, it is common practice to rely on Young’s modulus E to investigate and describe bending behavior. Equations to estimate E were proposed by Coops and van der Velde (1996); Usherwood et al. (1997); Rupprecht et al. (2015) which depend on the measured outer diameter, based on assuming a solid circle structure as morphological geometry (Feagin et al., 2011; Chatagnier, 2012; Jadhav et al., 2013; Rupprecht et al., 2015; Schulze et al., 2019; van Veelen et al., 2020). In some other cases, formulations that make use of the outer and inner diameter assuming a ring structure are applied (Vuik et al., 2017; Zhu et al., 2020; Paul et al., 2022). Originally, Young’s modulus has been seen as a parameter, that is typically tabulated and associated with materials. It has been acknowledged that anisotropic materials have values of E that are dependent on the bending force direction. Even though the Young’s modulus, obtained from the initial slope of force-deflection curves, is used as a parameter describing the flexibility of the material without considering morphology (e.g. Schulze et al., 2019), it is a parameter calculated with the outer (and sometimes inner) diameter of the plant (Rupprecht et al., 2015) and therefore it inherently depends on the assumption made for morphology (in case of S. anglica). Only recently, Liu et al. (2021) presented a novel approach to determine material properties along with the individual structure of a plant specimen using microscopy images, digital image analysis and numerical modeling to exactly determine Young’s modulus as a material property alone. This work also implies that there is potential future work to improve the understanding of how stiff, flexible or elastic a plant is, when focusing further onto cell tissues and its inherent typological composition along a culm (Niklas and Spatz, 2012).
While previous studies have focused on Young’s modulus E as a global stiffness parameter, second moment of area I and its product, the flexural stiffness EI, this study uses the stiffness S and the maximum force Fmax to analyze the mechanical behavior of the natural plant material, including culms and leaf sheaths. By using the stiffness S and the maximum force Fmax, the effect of the morphology is not included in the equations. Niklas and Spatz (2012) outline the high variance of biological cross-sections and difficulties to quantify the mechanical behavior of the sample. An example was evaluated by simplifying the cross-sectional area to calculate flexural stiffness EI, second moment of area I and Young’s modulus E (see Figure 10). This example is used to compare the method presented by Liu et al. (2021) as seen in Figure 10B to the measuring of the outer and inner diameter assuming a ring structure (Figure 10C) and the measuring of the outer diameter assuming a solid circle structure (Figure 10D).
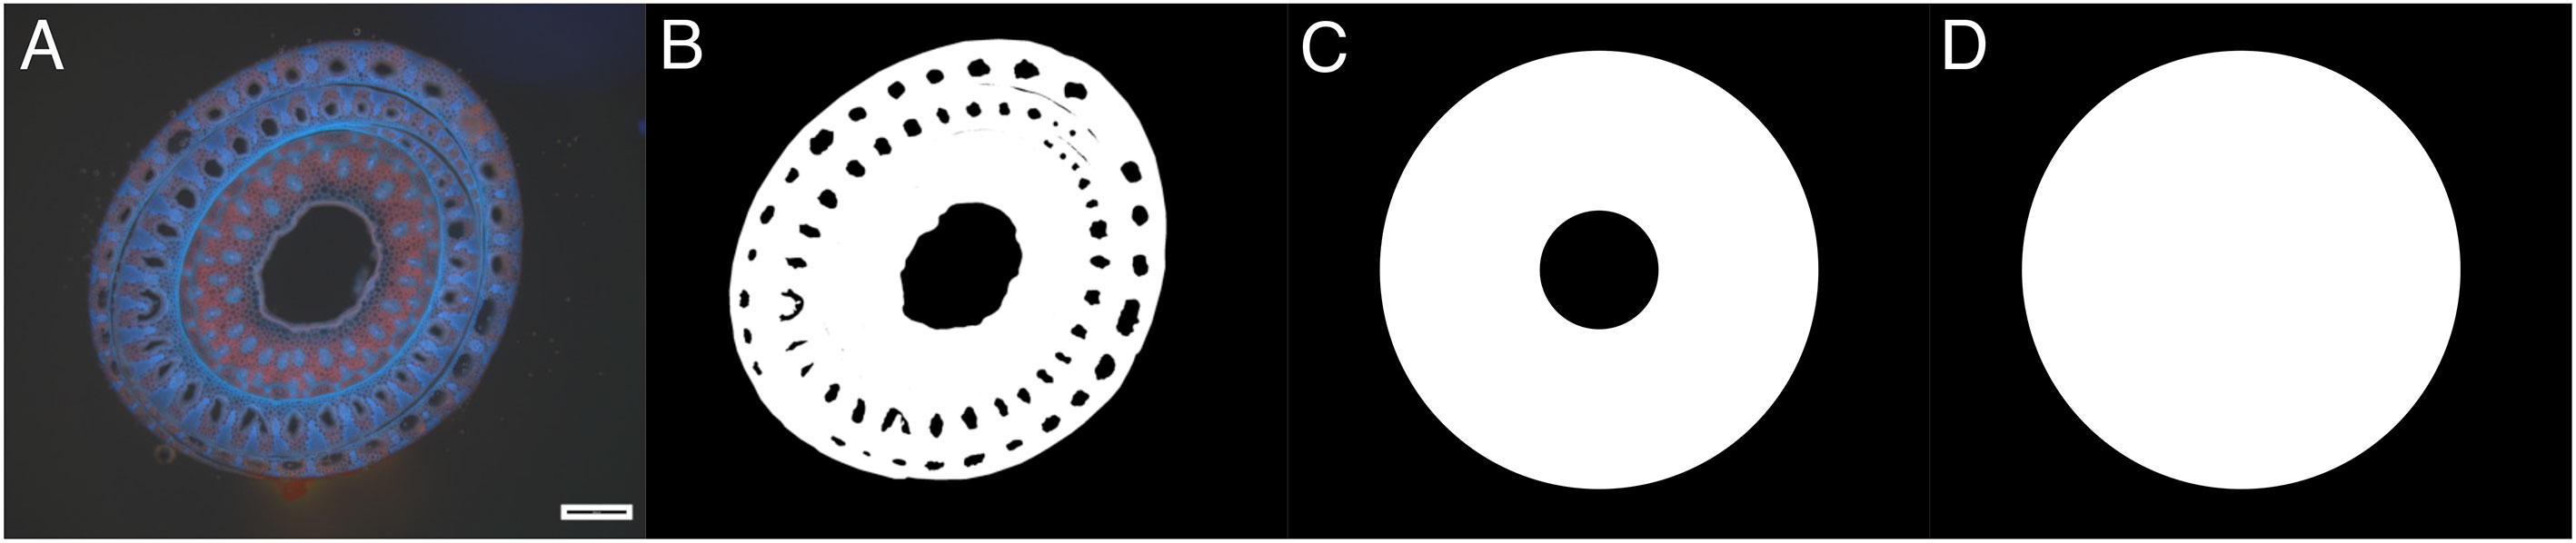
Figure 10 Cross-section of a middle third of S. anglica on Spiekeroog in August 2022 exposed to UV light (black scale bar equals 500µm, North side facing up). (A) Original image. (B) Binary image of morphology. (C) Idealized morphology for assuming a ring structure, measuring the outer and inner diameter. (D) Idealized morphology for assuming a circle structure measuring the outer diameter.
The area detected in the binary image resulting from the original image (Figure 10B) is about 6% smaller for the ring structure (Figure 10C) and 13% smaller compared to the circle structure (Figure 10D and Table 4). The second moment of area I shows 5% difference for the ring structure (Figure 10C) and 6% difference for the circle structure (Figure 10D) compared to the cross-section considering mesoscopic morphology (Figure 10B and Table 4). The highest differences for the calculated area can be associated with the outer diameter of a specimen, whose accurate determination in the field is often non-trivial. On one hand, measuring the outer diameter of the example (see Figure 10) with a caliper results in 3.25mm. On the other hand, the analysis after Liu et al. (2021) calculates the outer diameter from the cross-sectional area. In this example, the image analysis results in an outer diameter of 3.69mm and an inner diameter of 1.00mm. These values are taken for the idealized ring in Figure 10C and circle in Figure 10D. Note, that measurements by caliper include the risk of compressing the plant material slightly by trying to obtain an accurate measurement. Calculating Young’s modulus E following Usherwood et al. (1997), results in 556.29N/mm2 for 3.25mm and 334.75N/mm2 for 3.69mm. Therefore, Young’s modulus is 66% higher due to a 0.44mm difference in the outer diameter. However, during the field campaigns of this study, it was found that conducting thin-layer microscopy on, e.g., shoots in a senescent state during winter has proven very difficult due to the decaying biomass. The dead cell material is not shape-retentive, resulting in tearing of thin-layer samples, often impeding further microscopic analysis. In that regard, further research will have to find correlations between easily obtainable parameters, like the outer diameter, and the morphology. A larger data set along with data science methods can potentially help to provide means to estimate correct morphological properties for the determination of the Young’s modulus. It has to be noted, that this example is not looking at the mechanical behavior of the different materials within the cross-section (Niklas and Spatz, 2012).
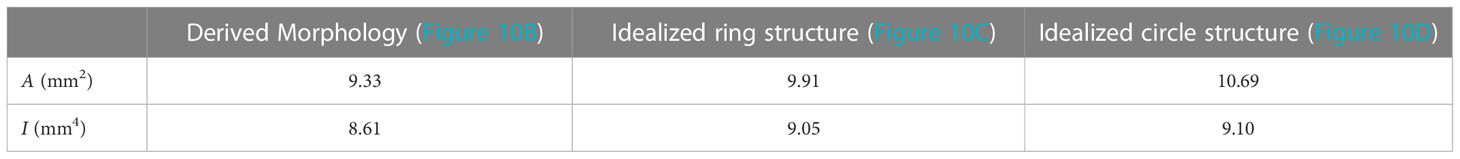
Table 4 Comparing the resulting area A and second moment of area I of the morphology derived from image analysis after Liu et al. (2021) to an idealized ring structure as well as an idealized circle structure (seen in Figure 10).
Due to the difficulties and inaccuracies in obtaining the morphology as mentioned above, this study relies on the stiffness S and the maximum force Fmax. Both parameters can be determined directly from the force-deflection curve obtained by the three-point bending tests. Applying a straight forward approach to determine mechanical parameters, flowering shoot samples exhibit large variability (see Figures 8C, D). This is traced back to the highly diverse material after months of growth and exposure to environmental conditions. Equivalently, the diversity of the results for sprouting shoots was relatively high due to the unknown location of the apical meristem (Figure 4) and therefore a high variance in morphology. Overall, stiffness S showed a decrease during storm surge season due to the senescent state and decay of biomass, while sprouting shoots present a higher stiffness with freshly grown biomass.
The morphology and its accuracy need to be considered, looking at Young’s modulus E, flexural strength σmax and flexural stiffness EI published in previous studies (see Table 1). In addition, varying bending test settings (see Supplementary Materials) should be considered when summarizing biomechanical properties by previously published studies for modeling purposes. Looking at mean values and standard deviations for Young’s modulus E exemplarily, the greatest difference is identified in Feagin et al. (2011). This is probably due to the manual bending method (see Supplementary Materials), which is less reproducible and controlled compared to digitized methods. Furthermore, biomechanical properties could be investigated at specific heights and distances, as seen in Feagin et al. (2011); Paul et al. (2022) instead of separating specimen into thirds. This conclusion can be drawn from a similar height for broken shoots during storm season. In addition, the effect of a folded shoot with a flexible tip versus a broken shoot should be quantified. Approaches similar to Losada et al. (2016); Paul et al. (2012) can be considered to improve understanding natural hydraulics.
Comparing Fmax determined in this study to the results by Zhu et al. (2020), S. anglica at the Hellegat Polder, Netherlands, withstood more than three times the force than specimens sampled on the back tidal flat of Spiekeroog, Germany. Spartina shoots were investigated in December, April, July and September and results show a higher maximum force for later seasons (see Table 1, Zhu et al., 2020). This relation can also be seen comparing winter state shoots (broken shoots and sheathed sprouting shoots) to sprouting shoots for the data set of this study (see Figure 8D). Looking at bending tests by Vuik et al. (2017), new shoots were investigated in April (Hellegat Polder, Netherlands), while in this study new shoots were observed in May and heights were not sufficient for bending tests until June, which indicates varying growth states for different location and time. Local differences, environmental conditions and influences of species composition can be explanations for observed differences. Looking at results by Zhu et al. (2020) and Vuik et al. (2017) with equal location and overlapping months of investigations, a difference for the mean values of outer diameter, Young’s modulus and flexural stiffness are still present, especially the flexural stiffness is twice as large found by Vuik et al. (2017).
Looking at the directional differences of stiffness, a significant difference was only identified for broken shoots (see Figure 9). Wind, waves and currents occurring under stormy weather conditions are stronger during winter, which is the season broken shoots were present. Main wind direction in this region is North-West after Reuter et al. (2009). Zielinski et al. (2018) (see Figure 1) have also looked at storm seasons in 2014 and 2015 separately, which resulted in a main wind direction of South-West. Looking at 2022 data from Deutscher Wetterdienst (2022) (see Figure 1B), mean wind direction in January and February was South-West, changing to South-East in March. Tidal current conditions equivalently showed a main direction from South-West or rather North-East (Zielinski et al., 2018) considering tidal dynamics in the German Bight. Taking wind and waves as forces on S. anglica in the lower marsh, forces coming from the west-facing shoot side can weaken the biomass in a senescent state, which results in lower stiffness and decreased maximum forces measured during this study. Considering the large variance in the raw data points as well as the highly diverse plant material and the different sample sizes, the results of this study suggest further research on this question, including comprehensive investigations on histology and cell structure conditions of plants in a senescent state. Equivalently, these investigations are suggested for flowering shoots, since a difference cannot clearly be defined due to small sample sizes.
Correlations in plant growth, biomechanical properties and directionality might vary with temporal and spatial differences. For now, this study only investigated S. anglica growing in a meadow on the back tidal flat of Spiekeroog. Future investigations should compare locations with different boundary conditions and growth patterns to determine influencing factors in all categories. This study helps to fill the seasonal gaps by conducting monthly investigations compared to quarterly investigations as seen by Vuik et al. (2017); Zhu et al. (2020). The proposed classification using phenological and biomechanical differences helps to specify seasonality of Spartina sp. in future studies. Furthermore, the results can be implemented into modeling approaches, including the coastal protection potential of above-ground biomass of salt marsh vegetation. Physical surrogates (see, for example, Augustin et al., 2009; van Veelen et al., 2020; Keimer et al., 2021; Keimer et al., 2022) can be adjusted to incorporate the aspect of seasonality for different storm scenarios. Furthermore, numerical simulations can be extended to include the variance in vegetation properties (see, for example, van Loon-Steensma et al., 2016). Extending the parameters with biomass, as seen by Maza et al. (2022) extends the reach of the results further. The objective, to quantify the highly diverse plant material as a coastal protection measure, helps to extend the knowledge of ecosystem services. This includes the variance in vegetation height, diameter and densities during the course of the year, since these parameters influence the wave energy reduction and the incoming wave heights at sea dikes (Ashall et al., 2016; Vuik et al., 2016; Hadadpour et al., 2019; Keimer et al., 2021). The results of this study help to supplement vegetation states and their biomechanical properties during winter season, since previous field investigations were mainly conducted during summer and autumn months (Knutson et al., 1982; Feagin et al., 2011; Ysebaert et al., 2011; Jadhav and Chen, 2013; Rupprecht et al., 2015; Paquier et al., 2017; Garzon et al., 2019; Zhang et al., 2020; Baaij et al., 2021).
Beyond the above-ground biomass investigated in this study, the below-ground biomass might change according to the plant states defined by above-ground biomass. It should be further investigated if the different phenological states have an impact on biogeomorphology. Previous studies have already shown that below-ground effects of root-soil interaction are important for energy reduction due to shoaling and erosion reduction (Alam et al., 2018; Redelstein et al., 2018; Kosmalla et al., 2022; Schoutens et al., 2022). This study therefore proposes to include above-ground plant state for future investigations on above as well as below-ground biomass. This includes investigations on the change of carbon fixation, considering ecosystem services provided by wetlands, which offer advantages in counteracting the effects of climate change.
5 Conclusion
This study presents results of monthly investigations from December 2021 to July 2022 on geometrical and biomechanical properties of S. anglica, growing in the back tidal flat of the barrier island Spiekeroog, Germany. During winter and spring, the condition of plant material changed considerably. Therefore, five different states (Figure 5) were defined and investigated separately. Aiming at a novel classification of the state of above-ground biomass, phenological differences were considered, looking at geometrical and biomechanical properties. Looking at the states separately, significant differences can be identified for the shoot height, stiffness and maximum forces. Shoot height was highest for the most adult shoots, emphasizing the temporal importance. Stiffness and maximum forces decreased accordingly during winter and significantly increased for sprouting shoots. Shoot height, and stiffness are relevant parameters when attributing the effects of the above-ground biomass on coastal protection through tracing of wave energy from offshore to coastal protection measures. Thus, seasonality and associated state classification are an important aspect of future estimates of coastal protection traits of salt marsh plants.
Reflecting on previous literature, investigating plants in winter and spring, the definition of the states seen in Figure 5 can help to discuss the results and reduce the variance of the data. In addition, assessing mechanical and geometric vegetation properties and corresponding ecosystem states could vastly improve the understanding, facilitate modeling and prediction of ecosystem services of salt marshes. If plant states, as defined within this study, are equivalently applicable for other species or not, should be investigated separately.
The broken shoots were the prevalent state of the storm surge season from February to April. They were characterized by the loss of all leaf blades and a very similar height over the investigated area. No relation between the height of the broken shoots and the tiller height was identified by assessing folded shoots, indicating a dependence on the surface area for wave attack. This indicates that environmental conditions, like incoming wave properties, or biomechanical properties changing over shoot height are influencing factors on the height of the broken shoots. Future investigations should pursuit a comprehensive data set for the environmental parameters influencing the surrounding biogeomorphology and plant growth.
For modeling purposes and to assess ecosystem services by S. anglica, worst case scenarios and properties at the lower end of the spectrum should be used to prevent overestimation of wave energy dissipation. Looking at the data set presented in this study, field investigations focusing on the winter state should be conducted in March or April to consider the worst case from an engineering perspective. Similarly, Chatagnier (2012) identified the growing season for S. alterniflora starting in April. Boundary conditions, e.g. breeding season of salt marsh fauna, should be included in the decision for field campaigns. For investigations and research questions regarding drag coefficients and flow resistance, leaf blades can be neglected for winter state, since a senescent state and storm surges result in folded and broken shoots without leaf blades. For modeling purposes, it should be considered that using mean values evaluated in the field can still result in an overestimation of drag up to 26% as shown previously by Marjoribanks and Paul (2021). In addition, vegetation cover and tussock shapes should be considered (e.g. Balke et al., 2012; Zhou et al., 2018). Also, composition of salt marsh meadows with varying species compositions should be investigated by future research. On Spiekeroog, for example, Atriplex portulacoides is a prevalent species in the low marsh, which is a small shrub. It might have a larger impact on wave attenuation because of lignified areas.
Based on the work presented here, future studies may include histological investigations of different plant states to systematically map growth states and structural changes at a cellular level. This will greatly enhance the current knowledge of biomechanical properties. In addition, it could help to reliably identify sampling time windows for critical plant properties relevant to include ecosystem based solutions into coastal protection measures. This includes the determination of cell wall and tissue properties, like stiffness, changing due to physical stress (Niklas et al., 2006; Niklas and Spatz, 2012). Investigating the morphology of plants in a senescent state requires additional histological sample preparation. Otherwise, the cell-structure is not form-retentive enough, for thin-layer microscopy, due to high moisture and decay of biomass. In addition, other salt marsh locations should be investigated for a recurrence of the proposed states. If recurrences are observed, a general definition of plant states in regard to coastal protection capabilities could be developed.
Data availability statement
The original contributions presented in the study are included in the article/Supplementary Material. Further inquiries can be directed to the corresponding author.
Author contributions
KK, VK, OL, MP, DS, and NG contributed to conceptualization and design of the study as well as methodology. KK, VK, IP, OL, and MP carried out the investigation in the field. KK conducted the formal analysis, wrote the first draft of the manuscript and prepared visualizations. MP analyzed, explained and visualized results for the mapping of the salt marsh vegetation. MP and KK conducted the statistical analysis. OL provided the visualization of the geodata and administered the project. OL, DS, HF, and NG organized funding acquisition. All authors contributed to the article and approved the submitted version.
Funding
This study was performed as part of the joint research project “Gute Küste Niedersachsen” funded by the Lower-Saxon Ministry of Research and Culture (FKZ: 76251-17-5/19) and the Volkswagen Stiftung. We acknowledge support by the Open Access Publication Funds of Technische Universität Braunschweig.
Acknowledgments
We are greatly indebted to the National Park authority (Nationalparkverwaltung Niedersächsisches Wattenmeer) for providing site access and permission to use it for scientific research. We would also like to thank research assistants - Mr. Lukas Ahrenbeck, Ms. Neira Babovic - and student research assistants - Mr. Philippe Dilger, Mr. Felix Kind, Mr. Malte Kumlehn, Ms. Mechthild Cramer - assisting at field campaigns as well as supporting in the laboratory. Felix Brennecke and his Photoshop skills played an important role in creating the overview for the different states from low quality field photos - great work! A big thanks to Dr. Robert Müller, who invested multiple evenings to discuss the research findings. We also gained a lot of insight into plant biology during our discussions with Prof. Robert Hänsch (Technische Universität Braunschweig). Thorsten Balke and Cai Ladd (University of Glasgow) provided valuable advice for the usage and analysis of Mini Buoy results. Thomas van Veelen (University of Twente) and Dennis Schulze (University of Hamburg) shared additional data to their publications, which is highly acknowledged.
Conflict of interest
The authors declare that the research was conducted in the absence of any commercial or financial relationships that could be construed as a potential conflict of interest.
Publisher’s note
All claims expressed in this article are solely those of the authors and do not necessarily represent those of their affiliated organizations, or those of the publisher, the editors and the reviewers. Any product that may be evaluated in this article, or claim that may be made by its manufacturer, is not guaranteed or endorsed by the publisher.
Supplementary material
The Supplementary Material for this article can be found online at: https://www.frontiersin.org/articles/10.3389/fmars.2023.1095200/full#supplementary-material
References
Alam S., Banjara A., Wang J., Patterson W. B., Baral S. (2018). Novel approach in sampling and tensile strength evaluation of roots to enhance soil for preventing erosion. Open J. Soil Sci. 08, 330–349. doi: 10.4236/ojss.2018.812024
Andersen T. J., Svinth S., Pejrup M. (2011). Temporal variation of accumulation rates on a natural salt marsh in the 20th century — the impact of sea level rise and increased inundation frequency. Mar. Geol. 279, 178–187. doi: 10.1016/j.margeo.2010.10.025
Anderson M. E., Smith J. M. (2014). Wave attenuation by flexible, idealized salt marsh vegetation. Coast. Eng. 83, 82–92. doi: 10.1016/j.coastaleng.2013.10.004
Ashall L. M., Mulligan R. P., van Proosdij D., Poirier E. (2016). Application and validation of a three-dimensional hydrodynamic model of a macrotidal salt marsh. Coast. Eng. 114, 35–46. doi: 10.1016/j.coastaleng.2016.04.005
Augustin L. N., Irish J. L., Lynett P. (2009). Laboratory and numerical studies of wave damping by emergent and near-emergent wetland vegetation. Coast. Eng. 56, 332–340. doi: 10.1016/j.coastaleng.2008.09.004
Baaij B. M., Kooijman J., Limpens J., Marijnissen R. J. C., van Loon-Steensma J. M. (2021). Monitoring impact of salt-marsh vegetation characteristics on sedimentation: an outlook for nature-based flood protection. Wetlands 41. doi: 10.1007/s13157-021-01467-w
Bakker J. (2014). Ecology of salt marshes: 40 years of research in the wadden sea (Leeuwarden: Wadden Academy).
Balke T., Klaassen P. C., Garbutt A., van der Wal D., Herman P. M., Bouma T. J. (2012). Conditional outcome of ecosystem engineering: A case study on tussocks of the salt marsh pioneer spartina anglica. Geomorphology 153-154, 232–238. doi: 10.1016/j.geomorph.2012.03.002
Balke T., Vovides A., Schwarz C., Chmura G. L., Ladd C., Basyuni M. (2021). Monitoring tidal hydrology in coastal wetlands with the “mini buoy”: applications for mangrove restoration. Hydrol. Earth Syst. Sci. 25, 1229–1244. doi: 10.5194/hess-25-1229-2021
Bouma T. J., Temmerman S., van Duren L. A., Martini E., Vandenbruwaene W., Callaghan D. P., et al. (2013). Organism traits determine the strength of scale-dependent bio-geomorphic feedbacks: A flume study on three intertidal plant species. Geomorphology 180–181. doi: 10.1016/j.geomorph.2012.09.005
Bouma T. J., van Belzen J., Balke T., van Dalen J., Klaassen P., Hartog A. M., et al. (2016). Short-term mudflat dynamics drive long-term cyclic salt marsh dynamics. Limnol. Oceanogr. 61, 2261–2275. doi: 10.1002/lno.10374
Bouma T. J., van Belzen J., Balke T., Zhu Z., Airoldi L., Blight A. J., et al. (2014). Identifying knowledge gaps hampering application of intertidal habitats in coastal protection: Opportunities & steps to take. Coast. Eng. 87, 147–157. doi: 10.1016/j.coastaleng.2013.11.014
Bouma T. J., Vries M. B., Low E., Peralta G., Tánczos I. C., van de Koppel J., et al. (2005). Trade-offs related to ecosystem engineering: A case study on stiffness of emerging macrophytes. Ecology 86, 2187–2199. doi: 10.1890/04-1588
Bungenstock F., Freund H., Bartholomä A. (2021). Holocene Relative sea-level data for the east frisian barrier coast, NW germany, southern north sea. Netherlands J. Geosci. 100. doi: 10.1017/njg.2021.11
Cahoon D. R., Hensel P. F., Spencer T., Reed D. J., McKee K. L., Saintilan N. (2006). “Coastal wetland vulnerability to relative sea-level rise: Wetland elevation trends and process controls,” in Wetlands and natural resource management, vol. 190 . Eds. Verhoeven J. T. A., Beltman B., Bobbink R., Whigham D. F. (Berlin, Heidelberg: Springer-Verlag Berlin Heidelberg), 271–292. doi: 10.1007/978-3-540-33187-2
Cahoon D. R., McKee K. L., Morris J. T. (2021). How plants influence resilience of salt marsh and mangrove wetlands to sea-level rise. Estuar. Coasts 44, 883–898. doi: 10.1007/s12237-020-00834-w
Cao H., Zhu Z., Herman P. M., Temmerman S., Smit J., Zhang L., et al. (2021). Plant traits determining biogeomorphic landscape dynamics: A study on clonal expansion strategies driving cliff formation at marsh edges. Limnol. Oceanogr. 66, 3754–3767. doi: 10.1002/lno.11915
Carus J., Paul M., Schröder B. (2016). Vegetation as self-adaptive coastal protection: Reduction of current velocity and morphologic plasticity of a brackish marsh pioneer. Ecol. Evol. 6, 1579–1589. doi: 10.1002/ece3.1904
Chatagnier J. (2012). The biomechanics of salt marsh vegetation applied to wave and surge attenuation. 1351, LSU Master’s Theses. doi: 10.31390/gradschool_theses.1351
Chen L., Zhou Z., Xu F., Möller I., Zhang C. (2020). Field observation of saltmarsh-edge morphology and associated vegetation characteristics in an open-coast tidal flat. J. Coast. Res. 95, 412–416. doi: 10.2112/SI95-080.1
Christiansen T., Wiberg P. L., Milligan T. G. (2000). Flow and sediment transport on a tidal salt marsh surface. Estuar. Coast. Shelf Sci. 50, 315–331. doi: 10.1006/ecss.2000.0548
Coleman D. J., Cassalho F., Miesse T. W., Ferreira C. M. (2022). The role of invasive phragmites australis in wave attenuation in the eastern united states. Estuar. Coasts 87, 404–416. doi: 10.1007/s12237-022-01138-x
Coops H., van der Velde G. (1996). Effects of waves on helophyte stands: mechanical characteristics of stems of phragmites australis and scirpus lacustris. Aquat. Bot. 53, 175–185. doi: 10.1016/0304-3770(96)01026-1
CPSL (2010). CPSL third report. the role of spatial planning and sediment in coastal risk management. wadden Sea ecosystem no. 28 (Wilhelmshaven, Germany: Common Wadden Sea Secretariat, Trilateral Working Group on Coastal Protection and Sea Level Rise (CPSL).
Day J. C., Heron S. F., Markham A. (2020). Assessing the climate vulnerability of the world’s natural and cultural heritage. Parks Stewardship Forum 36. doi: 10.5070/P536146384
Deutscher Wetterdienst (2022). Open data DWD.2022. Avaialable at: https://opendata.dwd.de/.
DIN EN ISO 7500-1 (2018). Metallic materials – calibration and verification of static uniaxial testing machines – part 1: Tension/compression testing machines – calibration and verification of the force-measuring system.
Döring M., Walsh C., Egberts L. (2021). Beyond nature and culture: relational perspectives on the wadden sea landscape. Marit. Stud. 20, 225–234. doi: 10.1007/s40152-021-00246-x
Doswald N., Munroe R., Roe D., Giuliani A., Castelli I., Stephens J., et al. (2014). Effectiveness of ecosystem-based approaches for adaptation: review of the evidence-base. Climate Dev. 6, 185–201. doi: 10.1080/17565529.2013.867247
European Commission and Directorate-General for Environment (2014). Mapping and assessment of ecosystems and their services: an analytical framework for ecosystem assessments under action 5 of the EU biodiversity strategy to 2020. doi: 10.2779/12398
Feagin R. A., Irish J. L., Möller I., Williams A. M., Colón-Rivera R. J., Mousavi M. E. (2011). Short communication: Engineering properties of wetland plants with application to wave attenuation. Coast. Eng. 58, 251–255. doi: 10.1016/j.coastaleng.2010.10.003
Ford H., Garbutt A., Ladd C., Malarkey J., Skov M. W. (2016). Soil stabilization linked to plant diversity and environmental context in coastal wetlands. J. Veg. Sci. 27, 259–268. doi: 10.1111/jvs.12367
Garzon J. L., Maza M., Ferreira C. M., Lara J. L., Losada I. J. (2019). Wave attenuation by spartina saltmarshes in the chesapeake bay under storm surge conditions. J. Geophys. Res.: Ocean. 124, 5220–5243. doi: 10.1029/2018JC014865
Ghisalberti M., Nepf H. (2006). The structure of the shear layer in flows over rigid and flexible canopies. Environ. Fluid Mech. 6, 277–301. doi: 10.1007/s10652-006-0002-4
González Trilla G., Borro M. M., Morandeira N. S., Schivo F., Kandus P., Marcovecchio J. (2013). Allometric scaling of dry weight and leaf area for spartina densiflora and spartina alterniflora in two southwest atlantic saltmarshes. J. Coast. Res. 29, 1373–1381. doi: 10.2112/JCOASTRES-D-11-00201.1
Granse D., Romeiro Motta M., Suchrow S., von Schwartzenberg K., Schnittger A., Jensen K. (2022). The overlooked hybrid: Geographic distribution and niche differentiation between spartina cytotypes (poaceae) in wadden sea salt marshes. Estuar. Coasts 45, 1409–1421. doi: 10.1007/s12237-021-00985-4
Granse D., Suchrow S., Jensen K. (2021). Long-term invasion dynamics of spartina increase vegetation diversity and geomorphological resistance of salt marshes against sea level rise. Biol. Invasions 23, 871–883. doi: 10.1007/s10530-020-02408-0
Hadadpour S., Paul M., Oumeraci H. (2019). Numerical investigation of wave attenuation by rigid vegetation based on a porous media approach. J. Coast. Res. 92, 92–100. doi: 10.2112/SI92-011.1
Haines-Young R., Potschin M. B. (2018). Common international classification of ecosystem services (cices) v5.1 and guidance on the application of the revised structure.
Heron S., Day J., Zijlstra R., Engels B., Weber A., Marencic H., et al. (2020). Workshop report: Climate risk assessment for wadden sea world heritage property. application of the climate vulnerability index – outstanding universal value (ouv) vulnerability (Wilhelmshaven, Germany: Common Wadden Sea Secretariat).
Jadhav R. S., Chen Q. (2013). Probability distribution of wave heights attenuated by salt marsh vegetation during tropical cyclone. Coast. Eng. 82, 47–55. doi: 10.1016/j.coastaleng.2013.08.006
Jadhav R. S., Chen Q., Smith J. M. (2013). Spectral distribution of wave energy dissipation by salt marsh vegetation. Coast. Eng. 77, 99–107. doi: 10.1016/j.coastaleng.2013.02.013
Keimer K., Kosmalla V., Lojek O., Goseberg N. (2022). Biomechanical replication of salt marsh vegetation using resin 3D printing. Proc. 39th IAHR World Congress. 106–114. doi: 10.3850/IAHR-39WC2521-71192022SS2087
Keimer K., Schürenkamp D., Miescke F., Kosmalla V., Lojek O., Goseberg N. (2021). Ecohydraulics of surrogate salt marshes for coastal protection: Wave–vegetation interaction and related hydrodynamics on vegetated foreshores at sea dikes. J. Waterway Port Coast. Ocean Eng. 147. doi: 10.1061/(ASCE)WW.1943-5460.0000667
Knutson P. L., Brochu R. A., Seelig W. N., Inskeep M. (1982). Wave damping in spartina alterniflora marshes. Wetlands 2, 87–104. doi: 10.1007/BF03160548
Koftis T., Prinos P., Stratigaki V. (2013). Wave damping over artificial posidonia oceanica meadow: A large-scale experimental study. Coast. Eng. 73, 71–83. doi: 10.1016/j.coastaleng.2012.10.007
Kosmalla V., Keimer K., Schürenkamp D., Lojek O., Goseberg N. (2022). Erosion resistance of vegetation-covered soils: Impact of different grazing conditions in salt marshes and analysis of soil-vegetation interactions by the novel dicoastar method. Ecol. Eng. 181. doi: 10.1016/j.ecoleng.2022.106657
Ladd C. J. T., Duggan-Edwards M. F., Pagès J. F., Skov M. W. (2021). Saltmarsh resilience to periodic shifts in tidal channels. Front. Mar. Sci. 8. doi: 10.3389/fmars.2021.757715
Lara J. L., Maza M., Ondiviela B., Trinogga J., Losada I. J., Bouma T. J., et al. (2016). Large-Scale 3-D experiments of wave and current interaction with real vegetation. Part 1: Guidelines for physical modeling. Coast. Eng. 107, 70–83. doi: 10.1016/j.coastaleng.2015.09.012
Leonard L. A., Croft A. L. (2006). The effect of standing biomass on flow velocity and turbulence in spartina alterniflora canopies. Estuar. Coast. Shelf Sci. 69, 325–336. doi: 10.1016/j.ecss.2006.05.004
Leuschner C., Ellenberg H. (2017). Ecology of central european non-forest vegetation: Coastal to alpine, natural to man-made habitats (Cham, Switzerland: Springer International Publishing). doi: 10.1007/978-3-319-43048-5
LGLN (2022). Excerpt from the geodata of the Landesamt für Geoinformation und Landesvermessung Niedersachsen - digital ortho pictures for the island of spiekeroog.
Liu J., Kutschke S., Keimer K., Kosmalla V., Schürenkamp D., Goseberg N., et al. (2021). Experimental characterisation and three-dimensional modelling of elymus for the assessment of ecosystem services. Ecol. Eng. 166. doi: 10.1016/j.ecoleng.2021.106233
Logan M. (2010). Biostatistical design and analysis using r: A practical guide (Sussex, UK: Wiley-Blackwell). doi: 10.1002/9781444319620
Losada I. J., Maza M., Lara J. L. (2016). A new formulation for vegetation-induced damping under combined waves and currents. Coast. Eng. 107, 1–13. doi: 10.1016/j.coastaleng.2015.09.011
Lou S., Chen M., Ma G., Liu S., Zhong G. (2018). Laboratory study of the effect of vertically varying vegetation density on waves, currents and wave-current interactions. Appl. Ocean Res. 79, 74–87. doi: 10.1016/j.apor.2018.07.012
Marjoribanks T. I., Lague D., Hardy R. J., Boothroyd R. J., Leroux J., Mony C., et al. (2019). Flexural rigidity and shoot reconfiguration determine wake length behind saltmarsh vegetation patches. J. Geophys. Res.: Earth Surface 124, 2176–2196. doi: 10.1029/2019JF005012
Marjoribanks T. I., Paul M. (2021). Modelling flow-induced reconfiguration of variable rigidity aquatic vegetation. J. Hydraul. Res. doi: 10.1080/00221686.2020.1866693
Maza M., Lara J. L., Losada I. J. (2022). A paradigm shift in the quantification of wave energy attenuation due to saltmarshes based on their standing biomass. Sci. Rep. 12. doi: 10.1038/s41598-022-18143-6
Mcowen C. J., Weatherdon L. V., van Bochove J.-W., Sullivan E., Blyth S., Zockler C., et al. (2017). A global map of saltmarshes. Biodivers. Data J. doi: 10.3897/BDJ.5.e11764
Möller I., Kudella M., Rupprecht F., Spencer T., Paul M., van Wesenbeeck B. K., et al. (2014). Wave attenuation over coastal salt marshes under storm surge conditions. Nat. Geosci. 7, 727–731. doi: 10.1038/ngeo2251
Möller I., Spencer T. (2002). Wave dissipation over macro-tidal saltmarshes: Effects of marsh edge typology and vegetation change. J. Coast. Res. 36, 506–521. doi: 10.2112/1551-5036-36.sp1.506
Morris R. L., Bilkovic D. M., Walles B., Strain E. M. (2022). Nature-based coastal defence: Developing the knowledge needed for wider implementation of living shorelines. Ecol. Eng. 185. doi: 10.1016/j.ecoleng.2022.106798
Nehring S., Hesse K.-J. (2008). Invasive alien plants in marine protected areas: the spartina anglica affair in the european wadden sea. Biol. Invasions. 10, 937–950. doi: 10.1007/s10530-008-9244-z
Niklas K. J., Spatz H.-C. (2012). Plant physics (Chicago, United States of America: The University of Chicago Press).
Niklas K. J., Spatz H.-C., Vincent J. (2006). Plant biomechanics: an overview and prospectus. Am. J. Bot. 93. doi: 10.3732/ajb.93.10.1369
Paquier A.-E., Haddad J., Lawler S., Ferreira C. M. (2017). Quantification of the attenuation of storm surge components by a coastal wetland of the us mid atlantic. Estuar. Coasts 40, 930–949. doi: 10.1007/s12237-016-0190-1
Paul M., Bischoff C., Koop-Jakobsen K. (2022). Biomechanical traits of salt marsh vegetation are insensitive to future climate scenarios. Sci. Rep. 12. doi: 10.1038/s41598-022-25525-3
Paul M., Bouma T. J., Amos C. L. (2012). Wave attenuation by submerged vegetation: combining the effect of organism traits and tidal current. Mar. Ecol. Prog. Ser. 444, 31–41. doi: 10.3354/meps09489
Paul M., Kerpen N. B. (2021). Erosion protection by winter state of salt marsh vegetation. J. Ecohydraulics. doi: 10.1080/24705357.2021.1938252
Petersen J., Kers B., Stock M. (2014). TMAP-typology of coastal vegetation in the wadden sea area. ecosystem no. 32 (Wilhelmshaven, Germany: Common Wadden Sea Secretariat).
Peterson P. M., Romaschenko K., Herrera Arrieta Y., Saarela J. M. (2014). A molecular phylogeny and new subgeneric classification of sporobolus (poaceae: Chloridoideae: Sporobolinae). Taxon 63, 1212–1243. doi: 10.12705/636.19
Pieck D., Hillebrand H., Kleyer M., Lõhmus K., Zielinski O. (2022). Continuous wave and tide observations, (2021) at dynacom artificial islands in the back-barrier tidal flat, spiekeroog, germany 2021-01 to 2021-10. PANGEA. doi: 10.1594/PANGAEA.945516
Pieck D., Thölen C., Hillebrand H., Kleyer M., Lõhmus K., Zielinski O. (2021). Continuous wave and tide observations, (2020) at dynacom artificial islands in the back-barrier tidal flat, spiekeroog, germany 2021-01 to 2020-12. PANGEA. doi: 10.1594/PANGAEA.935185
Proença B., Ganthy F., Michalet R., Sottolichio A. (2021). Observations of tidal flat sedimentation within a native and an exotic spartina species. Water 13. doi: 10.3390/w13111566
R Core Team (2022). R: A language and environment for statistical computing (Vienna: R Foundation for Statistical Computing).
Redelstein R., Dinter T., Hertel D., Leuschner C. (2018). Effects of inundation, nutrient availability and plant species diversity on fine root mass and morphology across a saltmarsh flooding gradient. Front. Plant Sci. 9. doi: 10.3389/fpls.2018.00098
Reise K., Baptist M., Burbridge P., Dankers N., Fischer L., Flemming B., et al. (2010). The wadden sea – a universally outstanding tidal wetland. wadden sea ecosystem no. 29 (Wilhelmshaven, Germany: Common Wadden Sea Secretariat).
Reuter R., Badewien T. H., Bartholomä A., Braun A., Lübben A., Rullkötter J. (2009). A hydrographic time series station in the wadden sea (southern north sea). Ocean Dyn. 59, 195–211. doi: 10.1007/s10236-009-0196-3
Rupprecht F., Möller I., Evans B., Spencer T., Jensen K. (2015). Biophysical properties of salt marsh canopies - quantifying plant stem flexibility and above ground biomass. Coast. Eng. 100, 48–57. doi: 10.1016/j.coastaleng.2015.03.009
Rupprecht F., Möller I., Paul M., Kudella M., Spencer T., van Wesenbeeck B. K., et al. (2017). Vegetation-wave interactions in salt marshes under storm surge conditions. Ecol. Eng. 100, 301–315. doi: 10.1016/j.ecoleng.2016.12.030
Schoonees T., Gijón Mancheño A., Scheres B., Bouma T., Silva R., Schlurmann T., et al. (2019). Hard structures for coastal protection, towards greener designs. J. Estuar. Coasts 42, 1709–1729. doi: 10.1007/s12237-019-00551-z
Schoutens K., Heuner M., Fuchs E., Minden V., Schulte-Ostermann T., Belliard J.-P., et al. (2020). Nature-based shoreline protection by tidal marsh plants depends on trade-offs between avoidance and attenuation of hydrodynamic forces. Estuar. Coast. Shelf Sci. 236. doi: 10.1016/j.ecss.2020.106645
Schoutens K., Stoorvogel M., van den Berg M., van den Hoven K., Bouma T. J., Aarninkhof S., et al. (2022). Stability of a tidal marsh under very high flow velocities and implications for nature-based flood defense. Front. Mar. Sci. 9. doi: 10.3389/fmars.2022.920480
Schulze D., Rupprecht F., Nolte S., Jensen K. (2019). Seasonal and spatial within-marsh differences of biophysical plant properties: implications for wave attenuation capacity of salt marshes. Aquat. Sci. 81. doi: 10.1007/s00027-019-0660-1
Sievers J., Malte R., Milbradt P. (2020). EasyGSH-DB: Bathymetrie, (1996-2016). doi: 10.48437/02.2020.K2.7000.0002
Silinski A., Schoutens K., Puijalon S., Schoelynck J., Luyckx D., Troch P., et al. (2018). Coping with waves: Plasticity in tidal marsh plants as self-adapting coastal ecosystem engineers. Limnol. Oceanogr. 63, 799–815. doi: 10.1002/lno.10671
Temmerman S., Horstman E. M., Krauss K. W., Mullarney J. C., Pelckmans I., Schoutens K. (2023). Marshes and mangroves as nature-based coastal storm buffers. Annu. Rev. Mar. Sci. 15, 95–118. doi: 10.1146/annurev-marine-040422-092951
Usherwood J. R., Ennos A. R., Ball D. J. (1997). Mechanical and anatomical adaptations in terrestrial and aquatic buttercups to their respective environments. J. Exp. Bot. 48, 1469–1475. doi: 10.1093/jxb/48.7.1469
van Hulzen J. B., van Soelen J., Bouma T. J. (2007). Morphological variation and habitat modification are strongly correlated for the autogenic ecosystem engineerspartina anglica (common cordgrass). Estuar. Coasts 30, 3–11. doi: 10.1007/BF02782962
van Loon-Steensma J. M., Hu Z., Slim P. A. (2016). Modelled impact of vegetation heterogeneity and salt-marsh zonation on wave damping. J. Coast. Res. 32, 241–252. doi: 10.2112/JCOASTRES-D-15-00095.1
van Veelen T. J., Fairchild T. P., Reeve D. E., Karunarathna H. (2020). Experimental study on vegetation flexibility as control parameter for wave damping and velocity structure. Coast. Eng. 157. doi: 10.1016/j.coastaleng.2020.103648
von Drachenfels O. (2021). Kartierschlüssel für Biotoptypen in Niedersachsen unter besonderer Berücksichtigung der gesetzlich geschützten Biotope sowie der Lebensraumtypen von Anhang I der FFH-Richtlinie. Naturschutz und landschaftspflege in niedersachsen, heft A/4, 1-336. Hannover.
Vuik V., Jonkman S. N., Borsje B. W., Suzuki T. (2016). Nature-based flood protection: The efficiency of vegetated foreshores for reducing wave loads on coastal dikes. Coast. Eng. 116, 42–56. doi: 10.1016/j.coastaleng.2016.06.001
Vuik V., Suh Heo H. Y., Zhu Z., Borsje B. W., Jonkman S. N. (2017). Stem breakage of salt marsh vegetation under wave forcing: A field and model study. Estuar. Coast. Shelf Sci. 200, 41–58. doi: 10.1016/j.ecss.2017.09.028
Wadden Sea Board - Task Group Climate (2017). Trilateral climate change adaptation strategy. monitoring report for the trilateral cooperation on the protection of the wadden sea (Wilhelmshaven, Germany: Common Wadden Sea Secretariat).
Wehrmann A., Schwartz M., Hecker N., Liebezeit G. (2014). “Initial barrier island evolution (kachelotplate, central wadden sea): sediment-vegetation interaction,” in Dynamic islands in the wadden Sea.Ecosystem no. 33. Eds. Hellwig U., Stock M. (Wilhelmshaven, Germany: Common Wadden Sea Secretariat).
Widdows J., Pope N. D., Brinsley M. D. (2008). Effect of spartina anglica stems on near-bed hydrodynamics, sediment erodability and morphological changes on an intertidal mudflat. Mar. Ecol. Prog. Ser. 362, 45–57. doi: 10.3354/meps07448
Willemsen P. W., Borsje B. W., Vuik V., Bouma T. J., Hulscher S. J. (2020). Field-based decadal wave attenuating capacity of combined tidal flats and salt marshes. Coast. Eng. 156. doi: 10.1016/j.coastaleng.2019.103628
Wolff W. J., Bakker J. P., Laursen K., Reise K. (2010). The wadden sea quality status report - synthesis report 2010. wadden sea ecosystem no. 29 (Wilhelmshaven, Germany: Common Wadden Sea Secretariat).
Yang S. L., Shi B. W., Bouma T. J., Ysebaert T., Luo X. X. (2012). Wave attenuation at a salt marsh margin: A case study of an exposed coast on the yangtze estuary. Estuar. Coasts 35, 169–182. doi: 10.1007/s12237-011-9424-4
Ysebaert T., Yang S.-L., Zhang L., He Q., Bouma T. J., Herman P. M. J. (2011). Wave attenuation by two contrasting ecosystem engineering salt marsh macrophytes in the intertidal pioneer zone. Wetlands 31, 1043–1054. doi: 10.1007/s13157-011-0240-1
Zhang W., Ge Z.-M., Li S.-H., Tan L.-S., Zhou K., Li Y.-L., et al. (2022). The role of seasonal vegetation properties in determining the wave attenuation capacity of coastal marshes: Implications for building natural defenses. Ecol. Eng. 175. doi: 10.1016/j.ecoleng.2021.106494
Zhang X., Lin P., Gong Z., Li B., Chen X. (2020). Wave attenuation by spartina alterniflora under macro-tidal and storm surge conditions. Wetlands 40, 2151–2162. doi: 10.1007/s13157-020-01346-w
Zhou Z., Yang Y., Chen B. (2018). Estimating spartina alterniflora fractional vegetation cover and aboveground biomass in a coastal wetland using spot6 satellite and uav data. Aquat. Bot. 144, 38–45. doi: 10.1016/j.aquabot.2017.10.004
Zhu Z., Yang Z., Bouma T. J. (2020). Biomechanical properties of marsh vegetation in space and time: effects of salinity, inundation and seasonality. Ann. Bot. 125, 277–290. doi: 10.1093/aob/mcz063
Keywords: salt marsh, ecosystem services, barrier island, Spartina anglica, stiffness, three-point bending tests, seasonality, biomechanical properties
Citation: Keimer K, Kosmalla V, Prüter I, Lojek O, Prinz M, Schürenkamp D, Freund H and Goseberg N (2023) Proposing a novel classification of growth periods based on biomechanical properties and seasonal changes of Spartina anglica. Front. Mar. Sci. 10:1095200. doi: 10.3389/fmars.2023.1095200
Received: 10 November 2022; Accepted: 30 January 2023;
Published: 22 February 2023.
Edited by:
Angel Borja, Technology Center Expert in Marine and Food Innovation (AZTI), SpainReviewed by:
Richard Michalet, Université de Bordeaux, FranceJeff Shimeta, RMIT University, Australia
Copyright © 2023 Keimer, Kosmalla, Prüter, Lojek, Prinz, Schürenkamp, Freund and Goseberg. This is an open-access article distributed under the terms of the Creative Commons Attribution License (CC BY). The use, distribution or reproduction in other forums is permitted, provided the original author(s) and the copyright owner(s) are credited and that the original publication in this journal is cited, in accordance with accepted academic practice. No use, distribution or reproduction is permitted which does not comply with these terms.
*Correspondence: Kara Keimer, k.keimer@tu-braunschweig.de