Beyond the Tree-Line: The C3-C4 “Grass-Line” Can Track Global Change in the World’s Grassy Mountain Systems
 João de Deus Vidal Jr.1,2*
  Peter C. le Roux3
  Steven D. Johnson4
  Mariska te Beest5,6,7
  Vincent Ralph Clark2
- 1Department of Plant Sciences, University of the Free State, Phuthaditjhaba, South Africa
- 2Afromontane Research Unit and Department of Geography, University of the Free State, Phuthaditjhaba, South Africa
- 3Department of Plant and Soil Sciences, University of Pretoria, Pretoria, South Africa
- 4Centre for Functional Biodiversity, School of Life Sciences, University of KwaZulu-Natal, Pietermaritzburg, South Africa
- 5Copernicus Institute of Sustainable Development, Utrecht University, Utrecht, Netherlands
- 6Centre for African Conservation Ecology, Nelson Mandela University, Port Elizabeth, South Africa
- 7South African Environmental Observation Network, Grasslands-Forests-Wetlands Node, Montrose, South Africa
von Humboldt’s tree-line concept has dominated mountain ecology for almost two hundred years, and is considered a key indicator for monitoring change in biome boundaries and biodiversity shifts under climate change. Even though the concept of life zones and elevation gradients are a globally observed phenomenon, they have not been thoroughly explored for many contexts. One such example is the tree-line ecotone, a widely used conceptual tool to track climate change in many regions, which has limited application in the widespread tree-sparse, grassy systems that comprise a third of the world’s mountain systems. Among grasses (Poaceae), temperature is linked to variation in photosynthetic performance and community dominance for C3 and C4 metabolic groups, due to its role in limiting photorespiration in the C3 photosynthesis process. Here, we investigate this community shift in grassland-dominated mountains to demonstrate the role of climate in driving this transition and discuss the potential applications of this tool to mountain ecosystem conservation worldwide. For identifying grass-dominated mountains worldwide, we measured the grass-cover using satellite data. We then compiled Poaceae distribution data for ten grass-dominated mountains spanning from 42°S to 41°N and determined the temperature intervals and elevation ranges at which each genus was found, testing for effects of temperature, precipitation, and latitudinal gradients on the dominance of C3-C4 grasses. Temperature was the main driver of C3 dominance, with the richness of C3 genera tending to surpass the taxonomic dominance of C4 plants along mountain temperature gradients where the annual mean temperature was colder than ca. 14.6°C. Similar patterns were observed in eight out of ten mountains, suggesting that this may constitute an isotherm-driven ecotone. Consequently, this C3-C4 transition offers a promising tool for monitoring climate change impacts in grassy mountains. C3-C4 grass community shifts in response to environmental change will likely have major implications for fire frequency and severity, rangeland productivity and livelihoods, food security, and water budgets in mountain systems. Given the severity of the implications of global change on these social-ecological systems, we propose that a “grass-line” monitoring protocol be developed for global application.
Introduction
Mountains and Arctic systems are experiencing climate change faster than any other natural systems (Dirnböck et al., 2011; Steinbauer et al., 2018; Hock et al., 2019). In mountain systems characterized by woody natural vegetation, the tree-line is one of the primary indicators that ecologists use to measure the ecosystem-level impacts of rising temperatures, with a similar approach being followed at high boreal latitudes viz. the forest-tundra timberline (Körner, 2012; Paulsen and Körner, 2014). One of the most valuable applications of the tree-line as a tool to track climate change is that—whenever the tree-line is physically present (whether as a broad ecotone or a sharper transitional zone)—it provides a clear visual reference which can be globally assessed (Körner, 2012) and tracked over time (Paulsen and Körner, 2014). Even though this tree-line-based isotherm tracking has considerable merit in regions where there is a physical tree-line, it has limited practical applicability in regions that are naturally tree-sparse and dominated by grasslands, and which thus demand more locally suited methods and approaches (Veldman et al., 2015; Bond, 2016) in order to be equally understood under scenarios of past and future climatic change.
Tree-line studies have historically been centered in temperate regions of the northern hemisphere, which—for the most part—has woody vegetation (Woodward et al., 2004). The tropical areas of the Americas, Africa, and Asia also have a clear transition between woody and non-woody vegetation with elevation (Woodward et al., 2004; Körner, 2012). However, many sub-tropical and temperate systems in the southern hemisphere do not show the same pattern and are dominated by natural grassy systems, in contrast to their northern temperate and tropical equivalents (Woodward et al., 2004; Edwards and Still, 2008; Sylvester et al., 2017; Carbutt, 2019). As a result, the tree-line concept has limited to no practical value in monitoring global change in these systems.
After forests (34%), grasslands (18%) are the dominant land-cover in the World’s mountains, with almost a third (31.6%) of the World’s mountains having a larger proportion of grassland cover than forest cover (Figure 1). Grassiness is therefore an ecologically fundamental component of mountain systems globally, with grass-dominated (e.g., grasslands, meadows) or co-dominated biomes (e.g., savannas, steppes) occurring in mountain regions of all continents (except Antarctica; Figure 1). Although the World’s most grassy mountains occur in Central Asia, southern Africa, southern South America, and New Zealand, almost all mountains worldwide have some element of grassiness (Figure 1). Grassy mountains provide valuable ecosystem services (Parr et al., 2014); and entire cultures, livelihoods, and various forms of indigenous food security strategies have evolved in and around such grassy mountain systems (Maurer et al., 2006; Lavorel et al., 2011). Such montane grasslands are also often paleo-grasslands, with high floristic endemism and richness (Van Wyk and Smith, 2001; Mucina and Rutherford, 2006; Clark et al., 2011; Parr et al., 2014), while natural montane forest in these grassy mountains may be confined to lowest elevations in topographically suitable locations and fire refugia (Mucina and Rutherford, 2006; Adie et al., 2017).
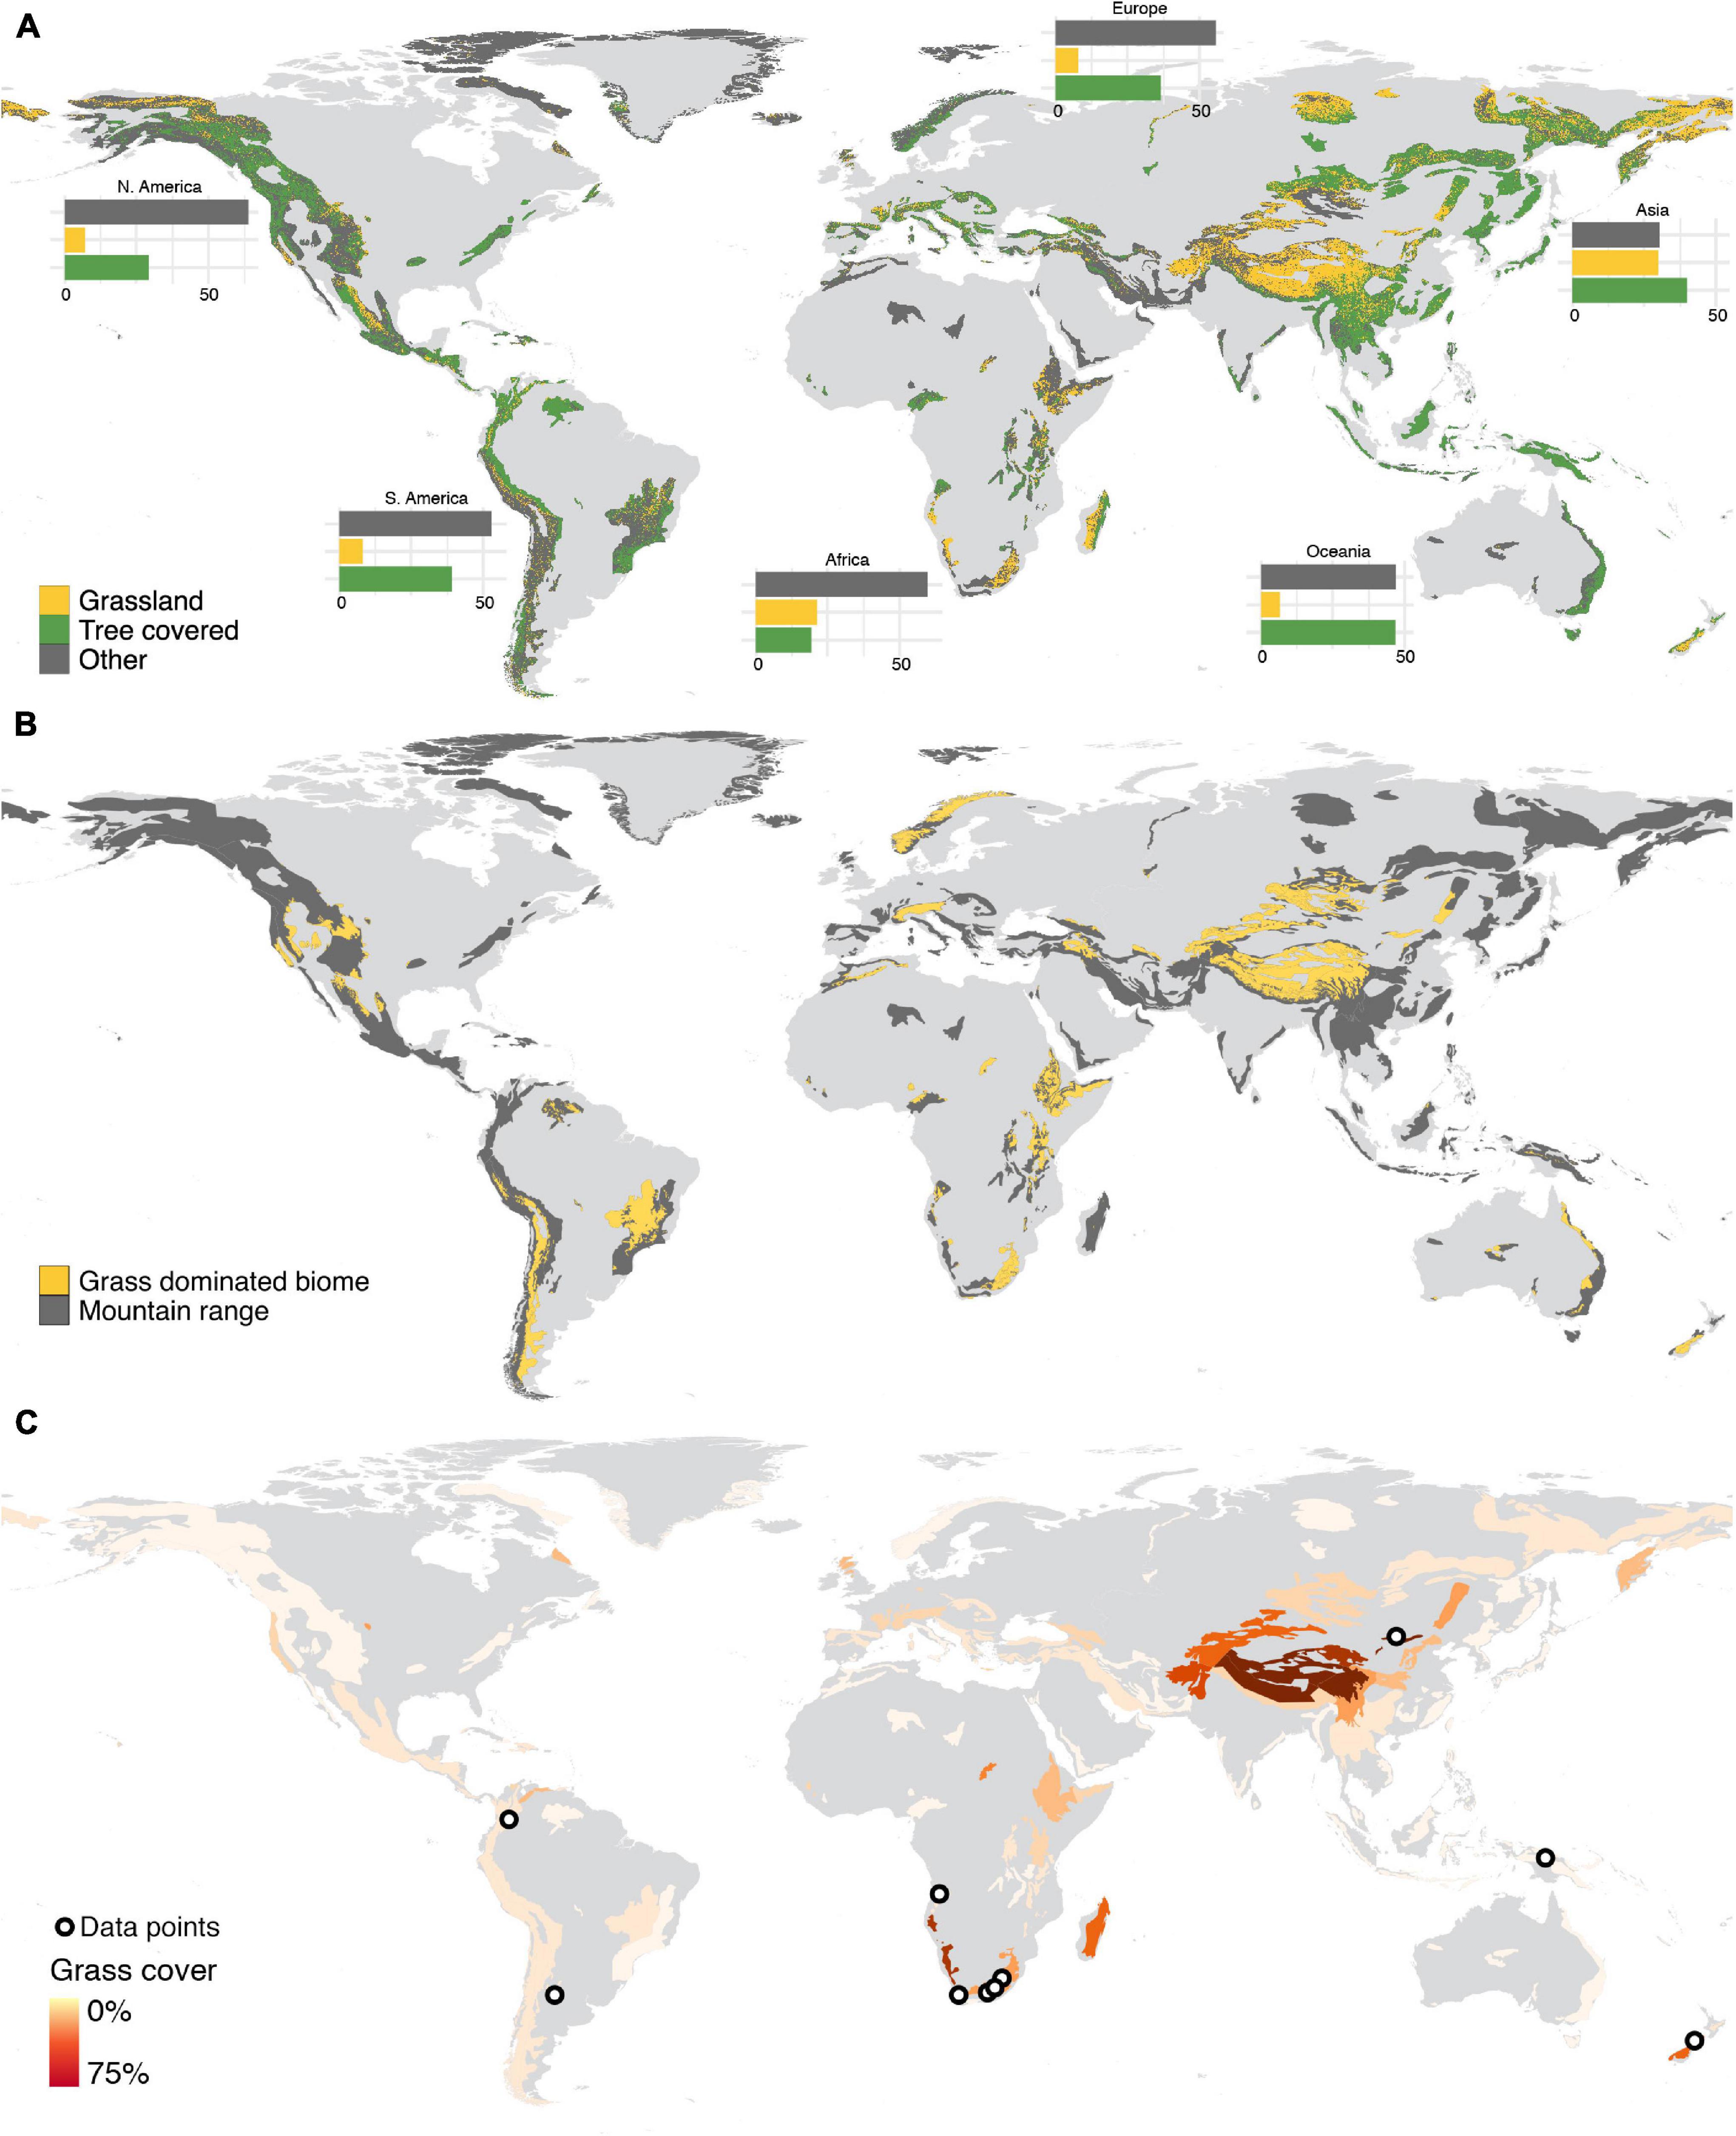
Figure 1. Grassiness in the World’s mountains. (A) Proportion of area occupied by grasslands, forests, or other land cover categories in each mountain. (B) The spatial distribution of grass-dominated and co-dominated biomes in the World’s mountains. (C) Percentage of land in each mountain covered by grassland and data localities used in the elevation vs. C3 -C4 community change analysis.
In the absence of a woody component, developing alternative tools to track how communities in grassy mountains are being transformed by anthropogenic climatic change is necessary to ensure specific grassland-focused conservation strategies. Changes in physiological characteristics and/or the functional composition of grass communities can provide valuable insights on how changes in environmental gradients (like temperature) affect grass species ranges in mountains. One such relationship is the well-known differential niche occupancy of C3 and C4 grasses along temperature gradients. Indeed, empirical data shows that the relative taxonomic richness of C3 grasses gradually increases with decreasing temperature found along elevation gradients (Tieszen et al., 1979; Bremond et al., 2012). This phenomenon is a result of a narrow niche overlap of the temperature tolerances in the abiotic component of the realized niches between these two photosynthetic groups, mainly due to the differences in temperature response of instantaneous net CO2 assimilation rate and the regeneration potential of ribulose bisphosphate (RuBP) and ribulose 1⋅5-bisphosphate carboxylase/oxygenase (Rubisco) between these groups (Sage and Kubien, 2007). Available data suggests that, under enriched CO2 environments, the Rubisco regeneration limits the distribution of C3 plants, while CO2 assimilation rates is restrained by temperatures lower than 20°C in C4. While this limitation seems to be a key driver of C3 habitat suitability, occasional acclimation to cooler environments in C4 is empirically observed, through positive regulation of Rubisco and C4 cycle enzymes (Sage and Kubien, 2007). However, due to its close relation to a specific temperature threshold in C3, it is possible to identify the temperatures where most C3 grasses have their lower elevational limits of their distributions, and to track changes in the community transition to C4 along temperature gradients. This concept, proposed here as the “grass-line,” can be tested and implemented in grassy mountain regions and provides a valuable tool to monitor temperature changes in grass dominated mountain regions where this transition occurs.
The aim of this study was, therefore, to test for a consistent/general relationship between environmental conditions and the elevation where colder temperatures allow C3 grasses to dominate over C4 genera. Specifically, we aim to test if the temperature where Poaceae C3 genera richness becomes higher than C4 genera richness along elevation gradients is driven by similar temperature thresholds across grassland-dominated mountains, and thus, linked to an isotherm and to demonstrate how it can be applied to track temperature change in mountains missing a tree-line. By gathering distribution data for C3 and C4 genera of grasses on different grass-dominated or co-dominated mountains worldwide, we demonstrate the potential of using the isotherm thresholds of this ecological shift in different grassy mountains to keep track of isotherms over time and provide a basic framework to the development of a specific tracking protocol. Grassland-dominated mountains from southern Africa, Asia, Australia, and the Americas consistently show a transition from C4 to C3 plants along elevation. This relationship between decreasing temperature and the C3-C4 ratio along elevation indicates an unambiguous link between community photosynthetic strategy turnover and the elevational distribution of isotherms. For grassy mountains this is as ecologically significant as the tree-line, and consequently we propose the C3-C4 dominance turnover transition as a “grass-line”: a consistent ecological phenomenon conceptually comparable to the tree-line in that it can easily be used to monitor the ecological impacts of short- or long-term climate change using, for example, satellite imagery (Shoko et al., 2016), carbon isotopes (Collatz et al., 1998), and pollen record (Ehleringer et al., 1997; Collatz et al., 1998).
Materials and Methods
Grass Dominated Mountains Identification and Site Selection
To identify which mountains are grassland-dominated and have low tree cover, we combined two strategies. First, we used the Global Mountain Delimitation shapefile (Rahbek et al., 2019b) and the Global Land Cover-SHARE (GLC-SHARE) databases developed by the Food and Agriculture Organization of the United Nations (FAO) (Latham et al., 2014). We summarized the land cover classification for each mountain, and then calculated the ratio of grasslands and forests cover using QGIS version 2.8.4 and R package “raster” version 3.5-2 (Hijmans, 2021). We then identified which grassland biomes were located within mountain ranges by overlaying the global mountain delimitation shapefile with the WWF’s World Grassland Types (Dixon et al., 2014). We followed Dixon et al. (2014) definition of grassland biomes: “a non-wetland type with at least 10% vegetation cover, dominated or co-dominated by graminoid and forb growth forms, and where the trees form a single-layer canopy with either less than 10% cover and 5 m height (temperate) or less than 40% cover and 8 m height (tropical).”
Biodiversity Dataset Compilation and Preparing
For sampling the occurrence data, we used both published literature surveys and the Global Biodiversity Information Facility (GBIF), as listed in Table 1. We selected localities comprising 40°S–41°N to represent the latitudinal range of sub-tropical to tropical mountain grasslands: the Andes (Mount Córdoba and Transecto Sumapaz, in Cordillera Oriental), the Mongolian Mountains in China, the New Guinea mountains, and southern Africa’s Eastern Great Escarpment (Cape Midlands Escarpment, Mpumalanga Limpopo, Maloti-Drakensberg, Manica Highlands) and Angola’s Western Escarpment. We extracted individual geographic polygons for each mountain and used the contour of the elevation features to isolate individual mountains that were generalized within larger mountain groups in Rahbek et al. (2019b). The resulting spatial polygons used for the extant analysis are available as Supplementary Material 1. For GBIF data, we configured the occurrence record search to include all Poaceae within each of the grassland-dominated mountains identified in the previous step, and restricted search parameters to include only preserved specimen records with geographic coordinates. We checked spelling and authorship for all genera using the collaborative database Taxonomic Name Resolution Service v4.01, provided by IPlant. Once we obtained a set of records for each mountain, we removed putative geographic outliers and imprecise coordinates using the R package “CoordinateCleaner” (Zizka et al., 2019). Since the intervals of occurrence were calculated without taking into account the year of sampling, it is possible that the distributions of some genera were overestimated. Similar studies in regions with more abundant and refined records should ideally account for the year of the collection, since the temperature increased considerably in some regions during the past decades. The complete record dataset used is available in Supplementary Material 2. We determined the photosynthetic pathway for each genus using literature sources (Osborne et al., 2014; Fish et al., 2015), and from this calculated the proportional occurrence of C3 and C4 genera for each elevational interval for each mountain (Supplementary Material 3).
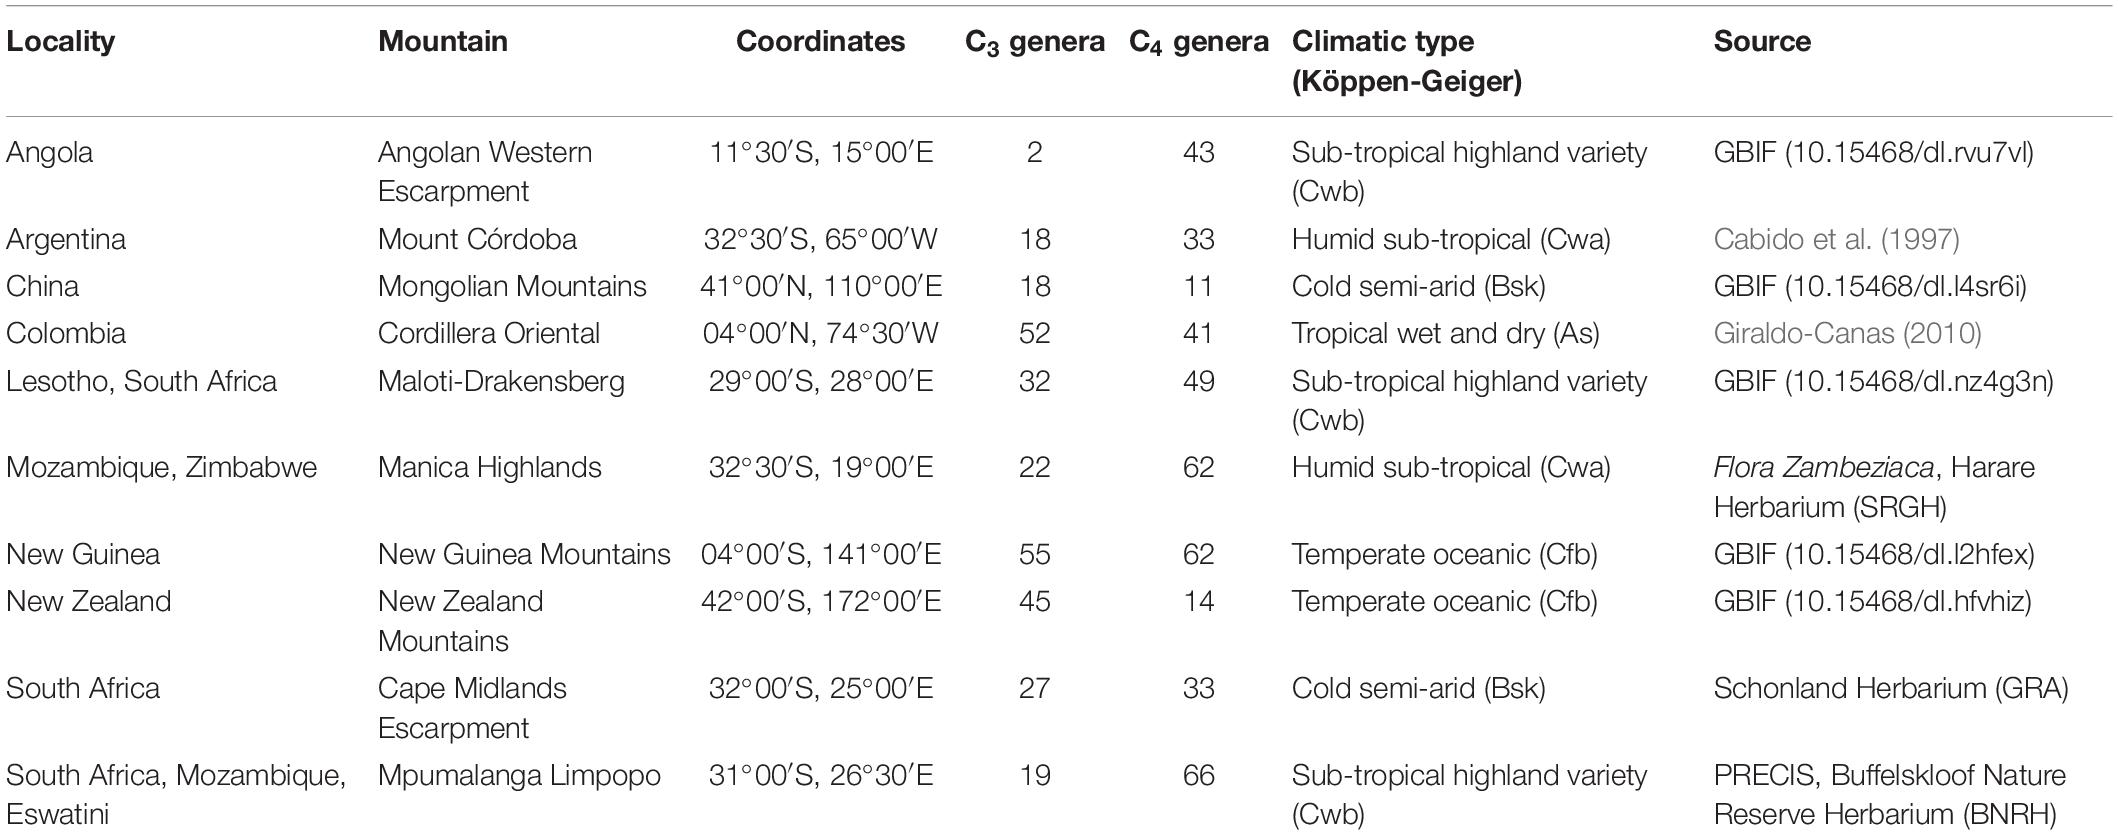
Table 1. Mountain grasslands and the countries in which they occur, coordinates, number of C3 and C4 genera, climatic type (Köppen-Geiger), and the literature source for the species lists and occurrences.
Grass Dominated Mountains in Africa
Of the 18 major mountain regions delimited for Africa by Rahbek et al. (2019b), nine have greater areas of grasslands than forests: (1) Atlas Mountains, (2) Dafur Highlands, (3) East African Highlands, (4) Ethiopian Highlands, (5) Jos Plateau, (6) Namibian/Angolan Escarpments, (7) North Somali Mountains, (8) Southern Cape region, and (9) Madagascar Highlands. African grassy mountains extend from 35°S to 35°N, and are found within the steppe, savanna, grassland, bushveld, forest, and woodland biomes.
Grass Dominated Mountains in South America
In South America, grass-dominated mountain regions (i.e., mountains with greater areas covered by grasses than forests) were found in Patagonia, Central Western Andes and the Brazilian Central Plateau. We identified eight mountains harboring grassy biomes (Figure 1): (1) Brazilian Central Plateau (Cerrado) and (2) Atlantic Mountains (Campos Rupestres); (3) Bolivian Huanchaca Plateau, (4) Southern Andes and Western Central Andes (Punas and Andean steppe), (5) Northern Andes (Páramos), (6) Peruvian-Bolivian Yungas (Puna, Espinal and Andean steppe), (7) Patagonia (Patagonian steppe) and (8) Venezuelan-Brazilian Tepuis (Llanos, Campinarama, Guianan savanna, and Pantepui). In these mountains, the dominant vegetation types included steppes, grasslands, shrublands, and savannas. The Cerrado, for example, has a savanna-like vegetation, harboring grasslands, shrublands and forests. There are 470 native species of Poaceae listed for the Cerrado (Filgueiras, 2021), and the most common C4 genera are Paspalum, Panicum (C4 and C3), Axonopus, Mesosetum, Aristida (C4 and C3), Andropogon, Eragrostis, Digitaria, and Sporobolus. Native C3 genera, like Ichnanthus, Echinolaena, are rare (Filgueiras, 2021).
Grass Dominated Mountains in Asia
In Asia, grass-covered mountains are found in the west (the Sinai, the Iranian Mountains, the South Western Arabian Mountains, and the Ural Mountains); in Central Asia (the Tibetan Mountains, the Pamir-Tian-Shan Highlands, the Hindu-Kush Highlands); in the North (Siberian Mountains and the Kamchatka), and in Eastern continental Asia (Qilian Mountains, Shanxi Mountains, and the Inner Mongolian Mountains), predominantly in the form of steppes, but also as bushlands and meadows. In insular Asia, grasslands are found in the alpine regions of Borneo and New Guinea, but forest cover is dominant in both mountains. In continental Asia, due to the temperate environmental conditions found in most mountains, C3 grasses tend to dominate.
Grass Dominated Mountains in Australia/New Zealand
In Australia and New Zealand, grassland-dominated mountains are concentrated in New Zealand and in the central-western mountain regions of Australia: Flinders Range, Macdonnell Ranges, and Pilbara-Hamersley Ranges. In the Flinders Range, the southern parts of the mountains are occupied by Mount Lofty woodlands, and the western portions of Macdonnell Ranges are occupied by the Great Sandy-Tanami desert, both including grasslands as vegetation types. For Australia, the GBIF database most-recorded Poaceae genera include three C3 genera, namely Austrostipa, Rytidosperma, and Poa; one C4 genera (Eragrostis); and one genera with both mechanisms, Aristida. Meanwhile, in New Zealand, the five most sampled Poaceae genera are all C3: Poa, Rytidosperma, Chionochloa, Agrostis, and Festuca.
Spatial Analysis and Statistical Analyses
We extracted the elevation data for each record using the ASTER Digital Elevation Model (30 m resolution) and then identified the elevation range (minimum and maximum values) occupied for each genus in each mountain to create presence-absence matrices using intervals of 50 meters of elevation, assuming that each genus has the potential to occupy all the elevation bands within this interval (Supplementary Material 4). We used WorldClim (Fick and Hijmans, 2017) bioclimatic variables (annual mean temperature, maximum temperature on the warmest month, minimum temperature in the coldest month, annual precipitation, minimum precipitation on the driest month, maximum precipitation on the wettest month) to calculate the environmental space for each elevation interval of each mountain. For this, we converted the raster layers into spatial points for each set of mountains and then reclassified them according to the same elevation intervals used in the previous step, and then calculated mean values for each variable. The WorldClim 2.0 bioclimatic variables are based on multiple weather stations’ data from over 25 years between 1970 and 2000, interpolated and spatially adjusted with geographic covariates. Annual mean temperature (bio 1) is calculated as the annual mean temperature for each station during the timeframe and their mean value over the years. Maximum and minimum temperature on the warmest and coldest month (bio 5 and 6, respectively) applies the same mean temperatures dataset to identify annual extremes and average them over this timeframe. It is important to note, however, that annual mean temperature might be a biased feature at high elevations because of the great diurnal and seasonal temperature variation in mountains. Thus, this predictor requires careful interpretation, with maximum annual temperature being more biologically meaningful when discussing climatic pressures on plants’ survival and development because it is a more direct proxy to the growing season, along with precipitation. The information about elevation, temperature, precipitation, and the proportion of C3 in each elevation range was then summarized in a single dataset, which we used to generate the plots and to produce generalized linear mixed models (GLMMs).
At the global scale, data were analyzed using GLMMs implemented using the glm() function, available in the base package “stats” (version 3.6.2) in the base R (R Core Team, 2020). We modeled the proportion of C3 genera in relation to various predictors in models that incorporated a binomial distribution (with events/trials structure) and logit link function. Both slopes and intercepts were estimated for the relations between the proportion of C3 genera and various continuous environmental variables in each mountain region. In order to minimize the effect of outlier sites where regional factors could create noise on the performance of GLMMs, mountains with p-values for individual models higher than 0.05 were removed from the global analysis steps. We eliminated variables that showed excessive collinearity (VIF > 5) and then used AIC criteria to select among plausible competing models. The sensitivity and specificity of each predicted threshold for annual mean temperature, maximum temperature in the warmest month and annual precipitation were calculated using confusion matrices created with the grass-line (i.e., the proportion of C3 grasses passes 50%) indicated by the GLMMs and the number of true/false positives/negatives (i.e., C3 > 0.5 sites) and the empirical dataset. All model fitting and sensitivity calculations are available as the Supplementary Material 6.
Results
All continents except Antarctica host mountain-associated grass cover or grass-dominated biomes, but only in African mountains does grass cover occupy a larger area than forests (Figures 1A,B). Proportionally, individual mountain regions dominated by grasslands (>50% of the area covered by grasses) were concentrated in Southern Africa, Central Asia, and New Zealand (Figure 1C).
We identified a consistent relationship between the temperatures found at the elevation intervals at which C3 grasses become more representative than C4 genera. By gathering distribution data for 245 genera of grasses (122 C3 and 123 C4) on 10 different grass-dominated or co-dominated mountains (Table 1), spanning 42°S to 41°N, we show how the temperature thresholds of this ecological shift are related to steppe-like climatic conditions found along elevational and latitudinal gradients. There is a clear latitudinal gradient in the C3-C4 threshold elevation (i.e., the elevation at which dominance switches from C3 to C4) (Figure 2 and Supplementary Material 7). As expected, C3 genera were typically associated with colder temperature conditions, becoming more dominant as temperatures decrease along the elevation gradient (Figure 3). Since there was a weak effect of annual mean temperature (p > 0.05) on C3 proportion in Manica Highlands and Western Angola Escarpments, it was not possible to fit grass-line values for these mountains (Table 2). Single-factor models for annual mean temperature, the maximum temperature in the warmest month, and annual mean precipitation returned p-values lower than 0.05 (Table 3). Individual mountains models had grass-line temperature thresholds ranging from 8.94 to 17.75°C (12.46 ± 2.26°C, mean ± 95% CI, N = 8), and the global model estimated the grass-line as 14.6°C. The higher sensitivity and specificity values for individual predictors were 0.99 and 0.73, both for annual mean temperature. Annual precipitation specificity had the lowest ability to predict C3 or C4-dominated sites, with sensitivity and specificity of 0.5 and 0.47, respectively. Multiple-factor models recovered significant coefficients (p < 0.05) for annual mean temperature and annual precipitation (Supplementary Material 6). Annual mean temperature showed a higher magnitude of changes in the C3 proportion and a negative coefficient (−0.1061), while the lowest coefficients were identified for elevation (−0.0004) and annual precipitation (0.0003). The compositional shift between C3-C4 in the communities (that is, >50% of the recorded genera showing C3 photosynthesis) was identified by the multiple-factor models in sites where the mean annual temperature gets lower than 14.6°C (Figure 4). Other predictors showed more variable effects.
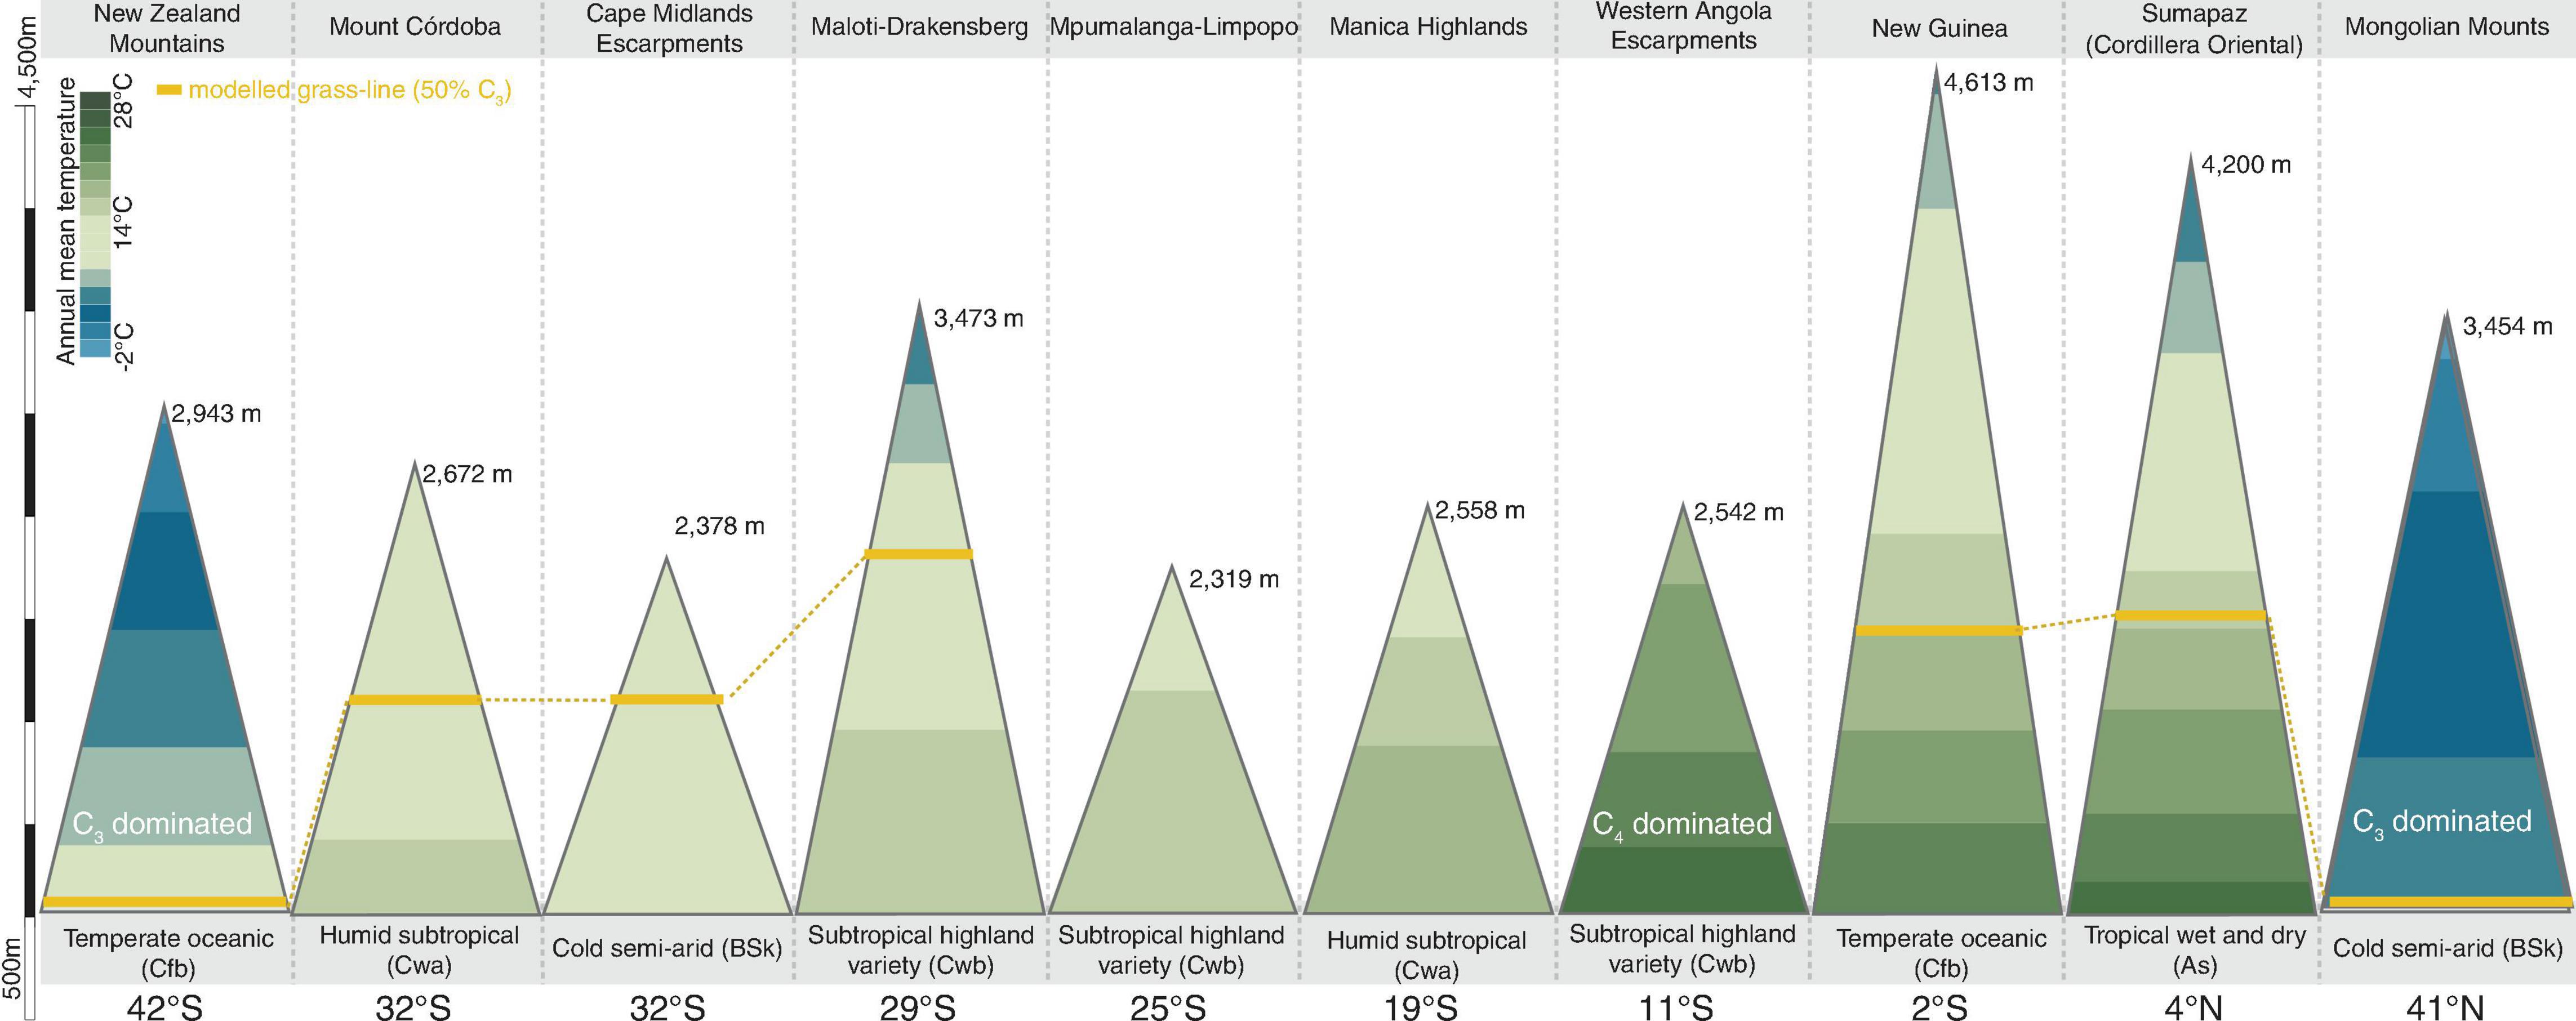
Figure 2. Proportional C3 composition of grasslands communities along elevation gradients in grassland dominated mountains in Asia, New Zealand, Africa, and South America, and their respective elevation, temperature, climates, latitudes, and modeled grass-line (50% of the genera on the community presenting C3 photosynthesis).
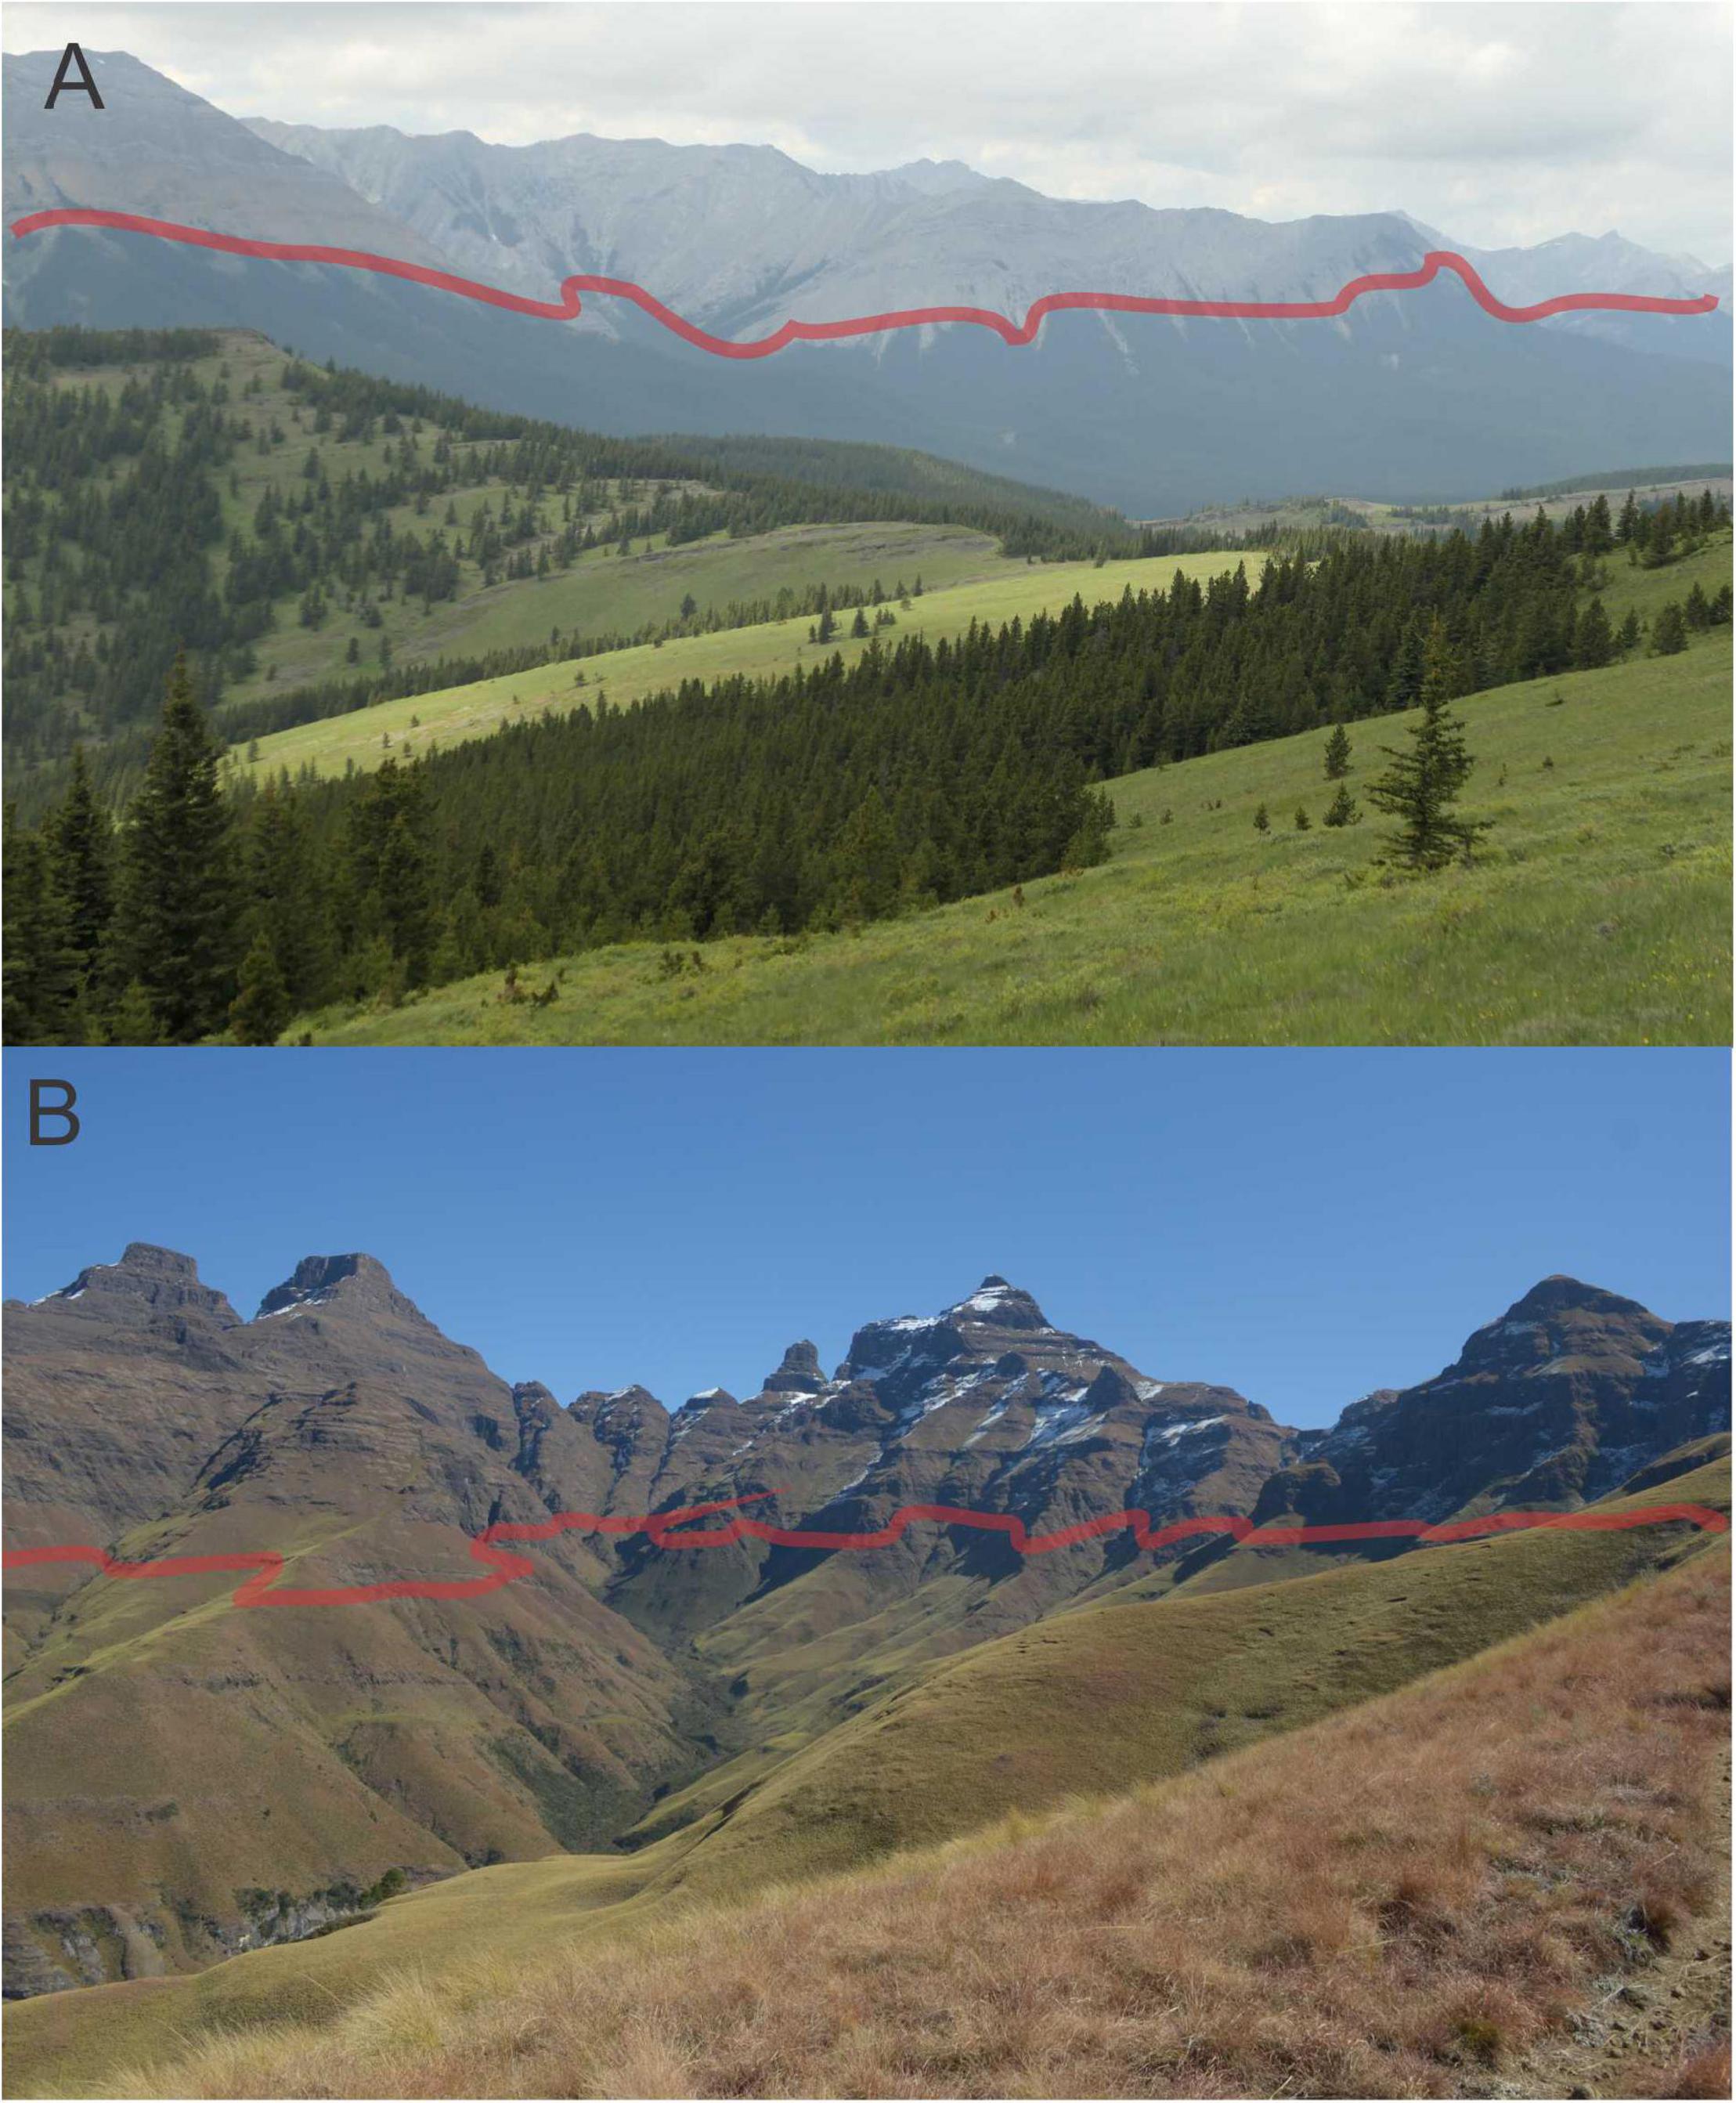
Figure 3. Temperature-related ecological transition zones occurring on mountains. (A) Tree-line at c. 2,100 m on Compression Ridge in the Canadian Rockies. (B) C3-C4 grass-line transition zone at c. 2,500 m on Cathedral Ridge in the Maloti–Drakensberg (Cathedral Peak range, KwaZulu-Natal, South Africa). Pictures taken by S. D. Johnson.
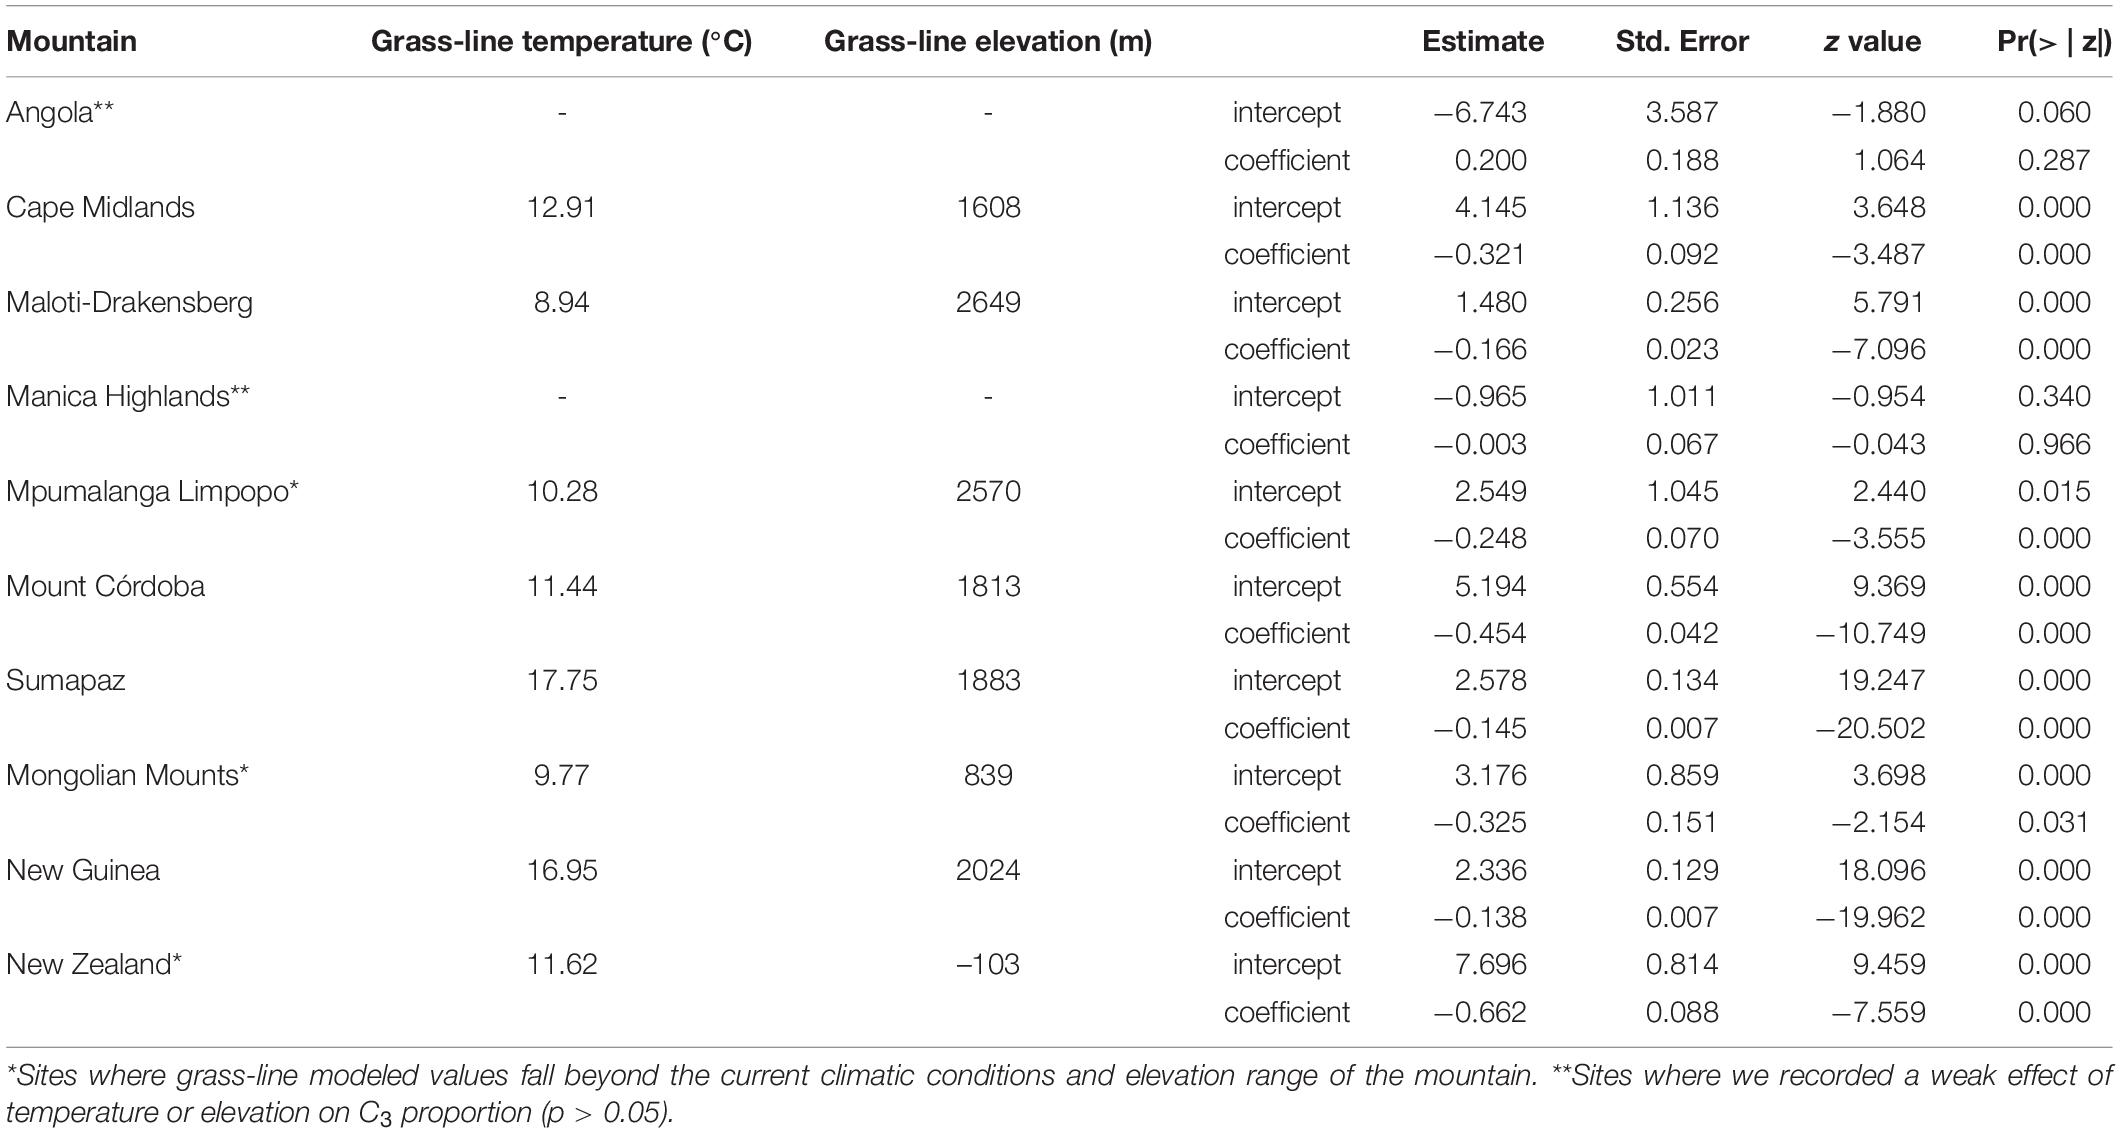
Table 2. Individual mountains grass-line elevation and model coefficients for each generalized linear model fitted for C3 proportion and elevation data.
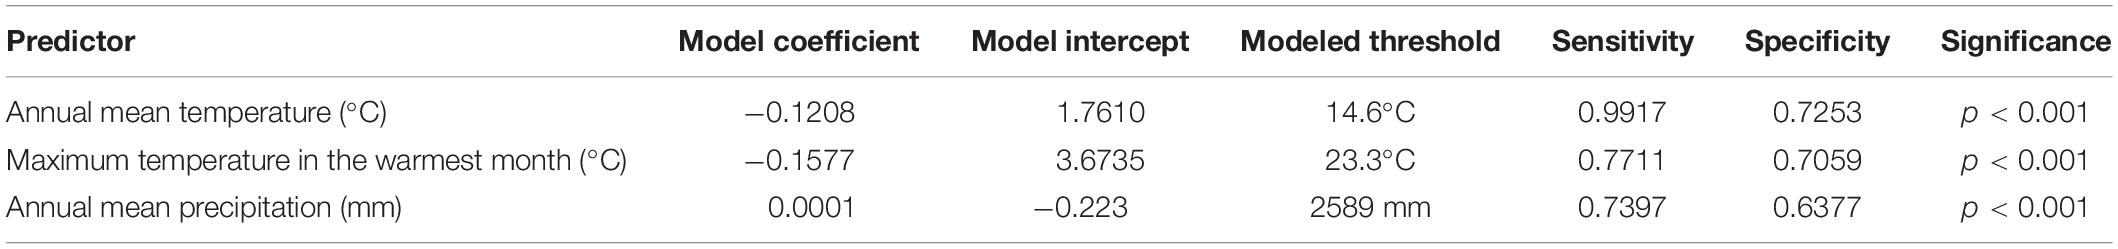
Table 3. Single-factor models coefficients, intercepts, identified threshold for higher than 50% C3 genera composition, sensitivity, specificity, and associated z-value probabilities.
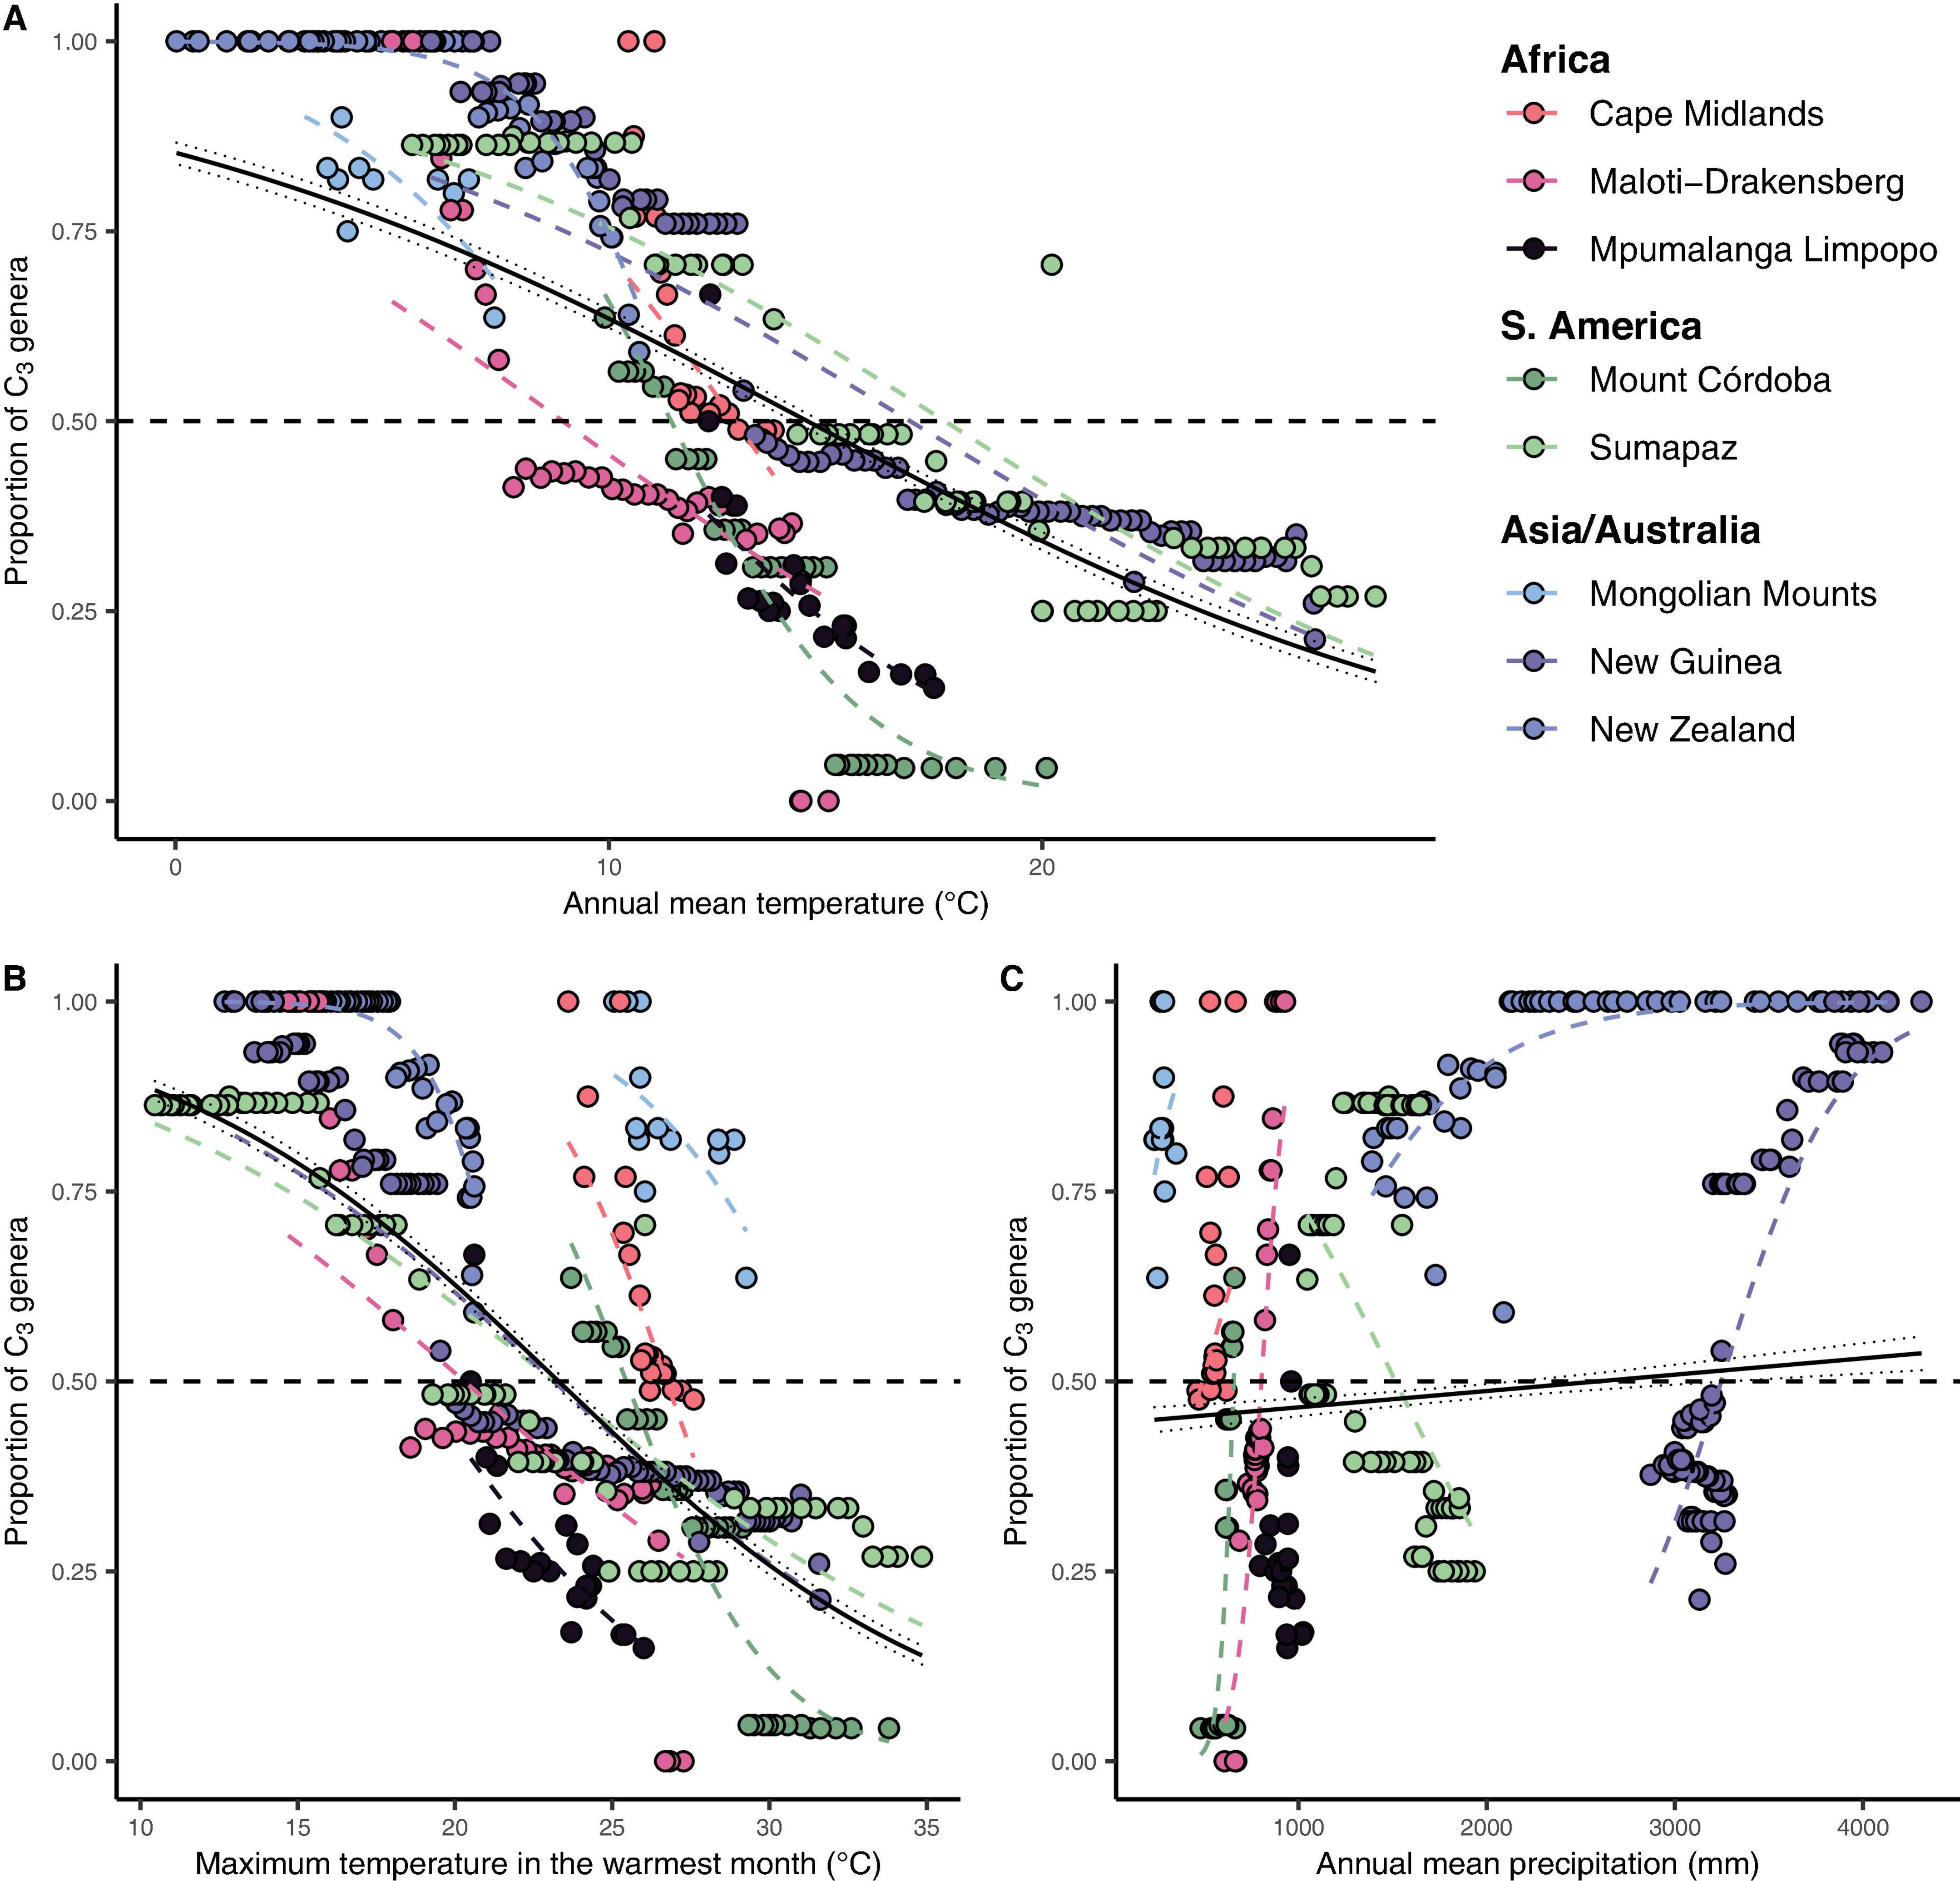
Figure 4. The global relationship between the proportion of C3 genera in each elevation interval and their respective maximum temperature in the warmest month and annual precipitation. (A) Annual mean temperature (°C) vs. the proportion of C3 Poaceae genera in each elevation interval. (B) Maximum annual temperature (°C) vs. the proportion of C3 Poaceae genera in each elevation interval. (C) Annual precipitation (mm) vs. the proportion of C3 Poaceae genera in each elevation interval. Each point represents a 50 m elevation belt in each mountain (represented by the colors on the legend) in each continent/region. Dashed colored lines represent individual mountains fitted logit link function with a binomial distribution (with events/trials structure) for the number of C3 and C4 genera found in each site. The continuous black lines represent the global fitted logit function for each variable with 95% confidence interval. The horizontal dashed black line represents the 50% of C3 threshold, proposed here as the grass-line.
C3-C4 Turnover in African Mountain Grasslands
In the African subtropical region, C3 genera represent a considerable proportion of the taxonomic diversity in the southernmost mountains (32°S to 28°S), with at least 27 genera found in the Cape Midlands Escarpments (vs. 33 C4) and 32 in the Maloti-Drakensberg (vs. 49 C4). In the Cape Midlands Escarpments, C3 genera become more abundant than C4 genera above 1600–1700 m, which is the upper limit of the distribution of lowland C4 genera like Alloteropsis, Hemarthria, and Setaria. Above 2200 meters, the only C4 genera found are Cymbopogon, Tetrachne, and Pennisetum, while C3 genera like Helictotrichon and Festuca reach elevations up to 2400 meters. In this C3-C4 shift region between 1600–1700 m, mean values for annual mean temperature was 12.9°C and for annual precipitation, 749 mm. In the Maloti-Drakensberg, the elevation identified for the community taxonomic transition between C3 and C4 genera was 2650 m, where annual mean temperature is ca. 9°C. C3 genera like Koordersiochloa, Stipa, Styppeiochloa, and Lamarckia were only recorded above 2700 m, while many lowland abundant C4 genera (Brachiaria, Cynodon, Digitaria, Eleusine, Enneapogon, Hyparrhenia, Microchloa, Pennisetum, Setaria, Trachypogon, Tragus) reach their upper elevational limit around 2850 m a.s.l.
Between 28°S and 10°S, the richness of C3 genera decreases with the increase in temperature along the latitudinal gradient, while the number of C4 genera increases. In the Mpumalanga-Limpopo mountains (26.7 to 24.7°S), for instance, we found 69 C4 genera and 20 C3 genera. Further north, between 20°S and 17.7°S, we listed 62 C4 genera and 18 C3 genera for Manica Highlands. For Mpumalanga-Limpopo, while the compositional shift gradually occurs as the temperature decreases along the elevation gradient, the grass-line is higher than the maximum elevation of the mountains, meaning that the proportion of C3 genera does not surpass the proportion of C4 at any point. The highest peak of Mpumalanga-Limpopo is 2319 m a.s.l., where annual mean temperature is 12.3°C and minimum annual temperature is 5°C. Around 33% of the Poaceae genera occurring at this elevation are C3, which become gradually more common above 1500 m a.s.l., where genera like Poa, Bromus, and Festuca have their lower elevational boundaries. Meanwhile, several C4 genera occur along the entire temperature gradient, like Bothriochloa, Dactyloctenium, Paspalum, Schizachyrium, Aristida, Cenchrus, Trachypogon, and Eleusine. On the other hand, Manica Highlands and Western Angola Escarpments are dominated by C4 grasses (62 genera in Manica Highlands and 44 genera in Angola). Only two C3 genera are recorded in Western Angola Escarpments, mostly at colder temperature sites found in high elevation belts (above 2050 m a.s.l.): Isachne and Sacciolepis. Even above 2050 m, the annual mean temperature ranges from 23.3 to 15.3°C, the minimum annual temperature ranges from 4.6 to 13.6°C, and the average annual precipitation is 1115 mm. For Manica Highlands, annual mean temperatures range from 12.9 to 17.84°C, and the average annual precipitation is 1354 mm. Since p-values calculated by individual models were higher than the significance threshold of 0.05 for both of these mountains, we removed them from the global model calculations and discussed their results individually.
C3-C4 Turnover in South America Mountain Grasslands
Grassland community gradient studies were available for Argentina (Mount Córdoba; Cabido et al., 1997) and Colombia (Transecto Sumapaz; Giraldo-Canas, 2010), and were included in our analysis. As expected, the proportion of C3 genera increased in both areas as temperature decreases along the elevation gradient. In the Colombian Andes, the grass-line if found around 1,883 m a.s.l., where C3 genera like Arthrostylidium, Aulonemia, Avena, Calamagrostis, Danthonia, Festuca, Glyceria, Jarava, Nassella, Phalaris, Piptochaetium, and Rhipidocladum have the lower elevation limits of their distribution. For this region, we calculated an annual mean temperature of 20.2°C, a minimum annual temperature of 14.7°C, and an annual precipitation of 1550 mm. For Patagonia and the Southern Andes in Argentina, four genera of C3 grasses (Agrostis, Panicum, Poa, and Vulpia) had their lower distribution limits around 1400 m, while C4 genera become gradually less abundant, since genera like Andropogon, Axonopus, Gymnopogon, and Elionurus have their upper elevation limit around 1550 meters. In this region, the grass-line in Mount Córdoba is found in 1813 m, where the annual mean temperature is 13°C, minimum annual temperature −7.1°C, and annual precipitation 617 mm.
C3-C4 Turnover in Asian Mountain Grasslands
In the temperate Mongolian Mountains, 11 C4 genera were found, with some occurring along the entire elevation gradient of the mountain, such as Cenchrus, Cleistogenes, and Setaria. There are 18 C3 genera recorded and some are found even in low elevation sites, like Agropyron, Poa, Elymus, and others. Annual mean temperatures range from 3 to 7.4°C, with maximum temperatures in the warmest month ranging from 25 to 29.3°C. In comparison, tropical mountains of Asia, like New Guinea, show a transition between C3 and C4 along the elevation gradient. The C3 turnover is observed around 2050 m a.s.l., where the average annual mean temperature is around 17°C. Overall, we listed 58 C3 genera and 64 C4 genera for the mountains. Most C3 genera (26 of 58) have their lower distribution limits around 2750 m (e.g., Anthoxanthum, Brachypodium, Cyperochloa, Danthonia, Dichelachne, Isachne, and Trisetum), and only six C4 genera have records above 2800 m (Arthraxon, Arundinella, Capillipedium, Coix, Digitaria, and Dimeria).
C3–C4 Turnover in Australia and New Zealand
In the New Zealand Mountains, we listed 45 C3 and 14 C4 genera, and identified occurrences of C4 genera like Digitaria, Cenchrus, Echinochloa, and others in warmer sites, in elevations bellow 1050 m, but mountains are almost entirely dominated by C3 genera. The dominant climate in New Zealand mountains is Temperate oceanic (Cfb), with annual mean temperatures ranging from 0 to 10.7°C.
Discussion
The Transition Between C3 and C4 in Grassy Mountains Is Driven Mainly by Temperature
The turnover from C4 to C3 dominated grasslands with decreasing temperature along the elevation gradient is transitional and is not in the form of a sharply demarcated line (Figure 3). It occurs along an isotherm, a temperature-linked elevation interval, which has a stronger effect than precipitation and elevation itself. The same phenomenon occurs with tree-lines, which are very often a transitional zone distributed over hundreds of meters. Transitional change does not mean that the grass-line cannot be used for monitoring as logistic regression models can provide temperatures and elevations associated with probabilities of turnover from C4 to C3 dominated grasslands. Based on our results, we argue that identifying the elevation interval where the annual mean temperature is around 14.6°C is indicative of the elevation range where C3 genera become more representative than C4, especially for subtropical grassy mountains. While there is a range of variation in the grass-line temperature for empirical datasets, the average value of 14.6°C can be used as an initial reference to the development of locally suited plots focused on tracking changes in the “grass-line” over time, since the overall pattern is effectively demonstrated: lower temperature sites show higher probabilities of being dominated by C3 genera. Here, we also present a model of the general guidelines for the development of such protocols using the Maloti-Drakensberg as an example.
Several factors like phenotypic plasticity, C4 acclimatization, microclimatic variation, edaphic factors, biologic interactions, regional genera pool, biogeographic histories of individual mountains, and even methodological limitations (spatial resolution of the mountain delimitation polygons, climatic datasets, and digital elevation models) could influence the results observed for Angola and Manica Highlands, and affect the precision of the global model. Thus, the global model is a starting point to the development of individual mountain-focused protocols, and elevation intervals need to be locally identified and adapted to be effectively applied for the development of locally suitable plot designs to track the changes in C3-C4 composition over time and the point of inflection where the communities along the elevation gradient begin to become C3 dominated. It is important to replicate our analysis in individual sites and test for further convergence of temperatures linked to the grass-line in each mountain before applying the protocol. This is necessary since our results are limited by sample size, as grass-lines are physically present in five of the ten mountains we analyzed. Even for modeled grass-lines, like the ones we identified for Mpumalanga Limpopo, Mongolian Mountains, and New Zealand, there was a considerable variation in annual mean temperature thresholds, suggesting that the grass-line may be a more suitable tool for certain localities than others (like Manica Highlands and Angola, for example). For these tropical mountains where the transition was not empirically observed, the combination of warm temperatures and a limited regional pool of C3 genera (only 2 of 45 Poaceae genera found in Angola are C3) justifies the low effect of annual temperature on the increase of C3 in Angola. On the other hand, the tropical conditions and the relative lower elevation extent (2558 m) in Manica Highlands, when compared to other tropical mountains included in our analysis (4613 m in New Guinea and 4200 m in Mount Sumapaz) do not allow for the temperature gradient to reach the same temperate conditions observed for higher elevation belts of other tropical mountains. This result suggests that the grass-line is more efficient for subtropical mountains, which already have a local pool of C3 species and where the elevation gradient reaches temperatures lower than the global threshold of 14.6°C.
This C3-C4 grass-line has a dynamic temporal history, with isotope reconstructions indicating that past climates greatly affected C3-C4 proportional dominance globally; data indicate a pronounced increase in C4 dominance for both sub-tropical and tropical regions during cold and dry periods, like the Last Glacial Maximum (Ehleringer et al., 1997; Collatz et al., 1998; Osborne, 2008; Edwards et al., 2010). Controversially, available data suggest that even though C3 grasses might have historically benefited from a carbon-richer atmosphere over C4 species (Ehleringer et al., 1997; Collatz et al., 1998; Osborne, 2008; Edwards et al., 2010), temperature is still one of the overriding determinants of their dominance (Collatz et al., 1998; Edwards and Still, 2008). Even though the evolution of C4 grasses seems to be strongly influenced by warmer climatic conditions (Sage, 2001; Sage et al., 2018), in an evolutionary context, however, temperature change itself is not capable of explaining C4 plant evolution (Sage, 2004). Instead, it is likely that complex interactions between biological, atmospheric, and geologic elements interacted (Sage, 2004). Interestingly, even though current CO2 levels are rising dramatically, C3 plants still employ substantial metabolic effort in sustaining a photosynthetic apparatus capable of handling low CO2 concentrations (Sage and Coleman, 2001).
This pattern is a direct consequence of the relatively poor photosynthetic performance of C3 plants under warm climatic conditions, a well known as physiological limitation caused by the lower specificity of RuBisCO under such conditions, resulting in a metabolic waste of energy in the form of photorespiration. As a result, in cooler mountains (such as New Zealand and northern China), the whole elevation continuum is dominated by C3 genera, while warmer tropical mountains (such as the Angolan Highlands) are dominated by C4 genera (Figure 2). For example, in New Zealand, while there are occurrences of C4 genera at warmer belts found in low elevations (below 1050 m), all the upper belts are dominated by C3 genera, while in China given the remarked temperate climate found in these mountains, most elevation belts present a relatively stable 70% C3 composition, with no clear increase along the elevation gradient (Supplementary Material 7). Even in tropical mountains like the Northern Andes, where the climatic heterogeneity is considerably higher (Rahbek et al., 2019a), C3 genera like Alopecurus, Aphanelytrum, Brachypodium, Cinna, Cortaderia, Elymus, Neurolepis, Phleum, Ortachne, Triniochloa, and Trisetum only become dominant above 2450 m a.s.l., where the mean annual temperatures become lower than 14.6°C. It is noteworthy though, that air temperature per se, despite being highly correlated, is not a direct measure of leaf temperature for low stature functional groups, which is usually warmer than the atmospheric measure because of boundary layer effects. Also, since WorldClim variables are interpolated 2 m above ground-level weather-station data, we recognize that our temperature data is possibly not refined enough to capture more local scale dynamics. In mountain systems where there is snowfall, grasses might also be periodically isolated from atmospheric conditions whenever there is snow accumulation. For trees, this is not observed, and it is one of the reasons for the sharper tree-line limit observed in forest-dominated mountains (Körner, 2003; Scherrer and Köerner, 2010; Scherrer and Körner, 2011).
As the World’s grassy mountain systems are most extensive in the moisture-stressed mid-latitudes, moisture availability (or moisture reliability) may favor C3 over C4 richness in these regions. However, precipitation itself seems to play a weak role (Figure 4 and Supplementary Table 3) in this community shift at the local gradient level, even though it may play an important role in explaining variation among regions (Edwards and Still, 2008) and also the global dominance of C4 grasses (Adie et al., 2017). Our models therefore reinforce the role of temperature as the primary driver of the C3-C4 “grass-line,” in the same way that it determines the global distribution of C3 and C4 grass communities, surpassing even the effects of the latitudinal gradient.
One immediate implication is that—with temperature increases of 1.5°C projected for the next 50 years under current emission scenarios (Hock et al., 2019)—as the C3-C4 threshold shifts upslope under warmer temperatures, montane C3 grasses are likely to undergo contractions in their distributions. Narrow endemic genera (like Arthrostylidium, Aulonemia, Calotropis, Danthonia, Deyeuxia, Rytidosperma, Sacciolepis, Trichopteryx, and Vulpia) may be at most risk from population bottlenecks and a decrease in photosynthetic productivity, or even local extinction. Meanwhile, C3 dominated mountains (e.g., temperate mountains in New Zealand and China) will face an increase in the presence and dominance of C4 species and higher vulnerability to invasions of alien C4 grasses. Thus, biodiversity erosion will certainly be a consequence of increased temperatures in currently C3-dominated mountains, due to the predicted warming of originally colder sites found in higher elevation in other sub-tropical mountains.
Developing a Grass-Line Protocol: How Can we Track the Transition in Grassy Mountains?
While developing strategies to track the grass-line is challenging and needs to be continuously developed, we outline some basics for such study designs when monitoring grassy mountains. Thus, the geographic distribution and the sizes of the plots—ideally large permanent rectangular plots with randomly distributed smaller sampling plots—need to be carefully planned and evaluated for each region.
As a case in point, we hereby propose a pilot protocol to monitor C3-C4 grass community shifts in grassy mountains using the Maloti-Drakensberg as an example. We propose a permanent nested-plot-based design that can be revisited every 2–5 years, with more frequent surveys during years of environmental extremes. Permanent plots should span the whole ecotone (i.e., cover an elevational gradient), centered approximately on the grass-line calculated for a given mountain. Target areas can be delimited using GIS tools to maximize the inclusion of grassland transects known to include both C3 and C4 genera, where multiple permanent larger rectangular plots (e.g., 100 × 50 m) are established along the elevation gradient with smaller 1 × 1 m subplots systematically sampled to measure presence/absence for indicative grass genera (Figure 5). With this data, it becomes possible to calculate the relative abundance of C3 vs. C4 grasses for the large plots and to monitor shifts in the distribution of indicative genera along the elevational gradient (in the Maloti-Drakensberg the transition would typically start around 1850–2000 m in elevation, reaching 50% around 2650 m). Additionally, this protocol would allow for monitoring the occurrence and abundance of native and invasive C4 genera above the predicted elevational threshold over time, as well as monitoring population declines in indicator C3 genera occurring in high-elevation sites (e.g., above 1850 m a. s. l. in the Maloti-Drakensberg). By monitoring the “grass-line” over time, while simultaneously tracking ongoing temperature changes, it will be possible to estimate the habitat loss for C3 genera, the rate of expansion of C4 genera, and, as a result, the increasing vulnerability of grass-dominated mountain peaks to lowland taxa (as reported for tree-dominated temperate mountains by Steinbauer et al., 2018). Overall, the protocol needs to take into account the individual environmental characteristics of each region and the diversity of genera found in each elevation associated with the transition to be able to capture changes in this composition over time.
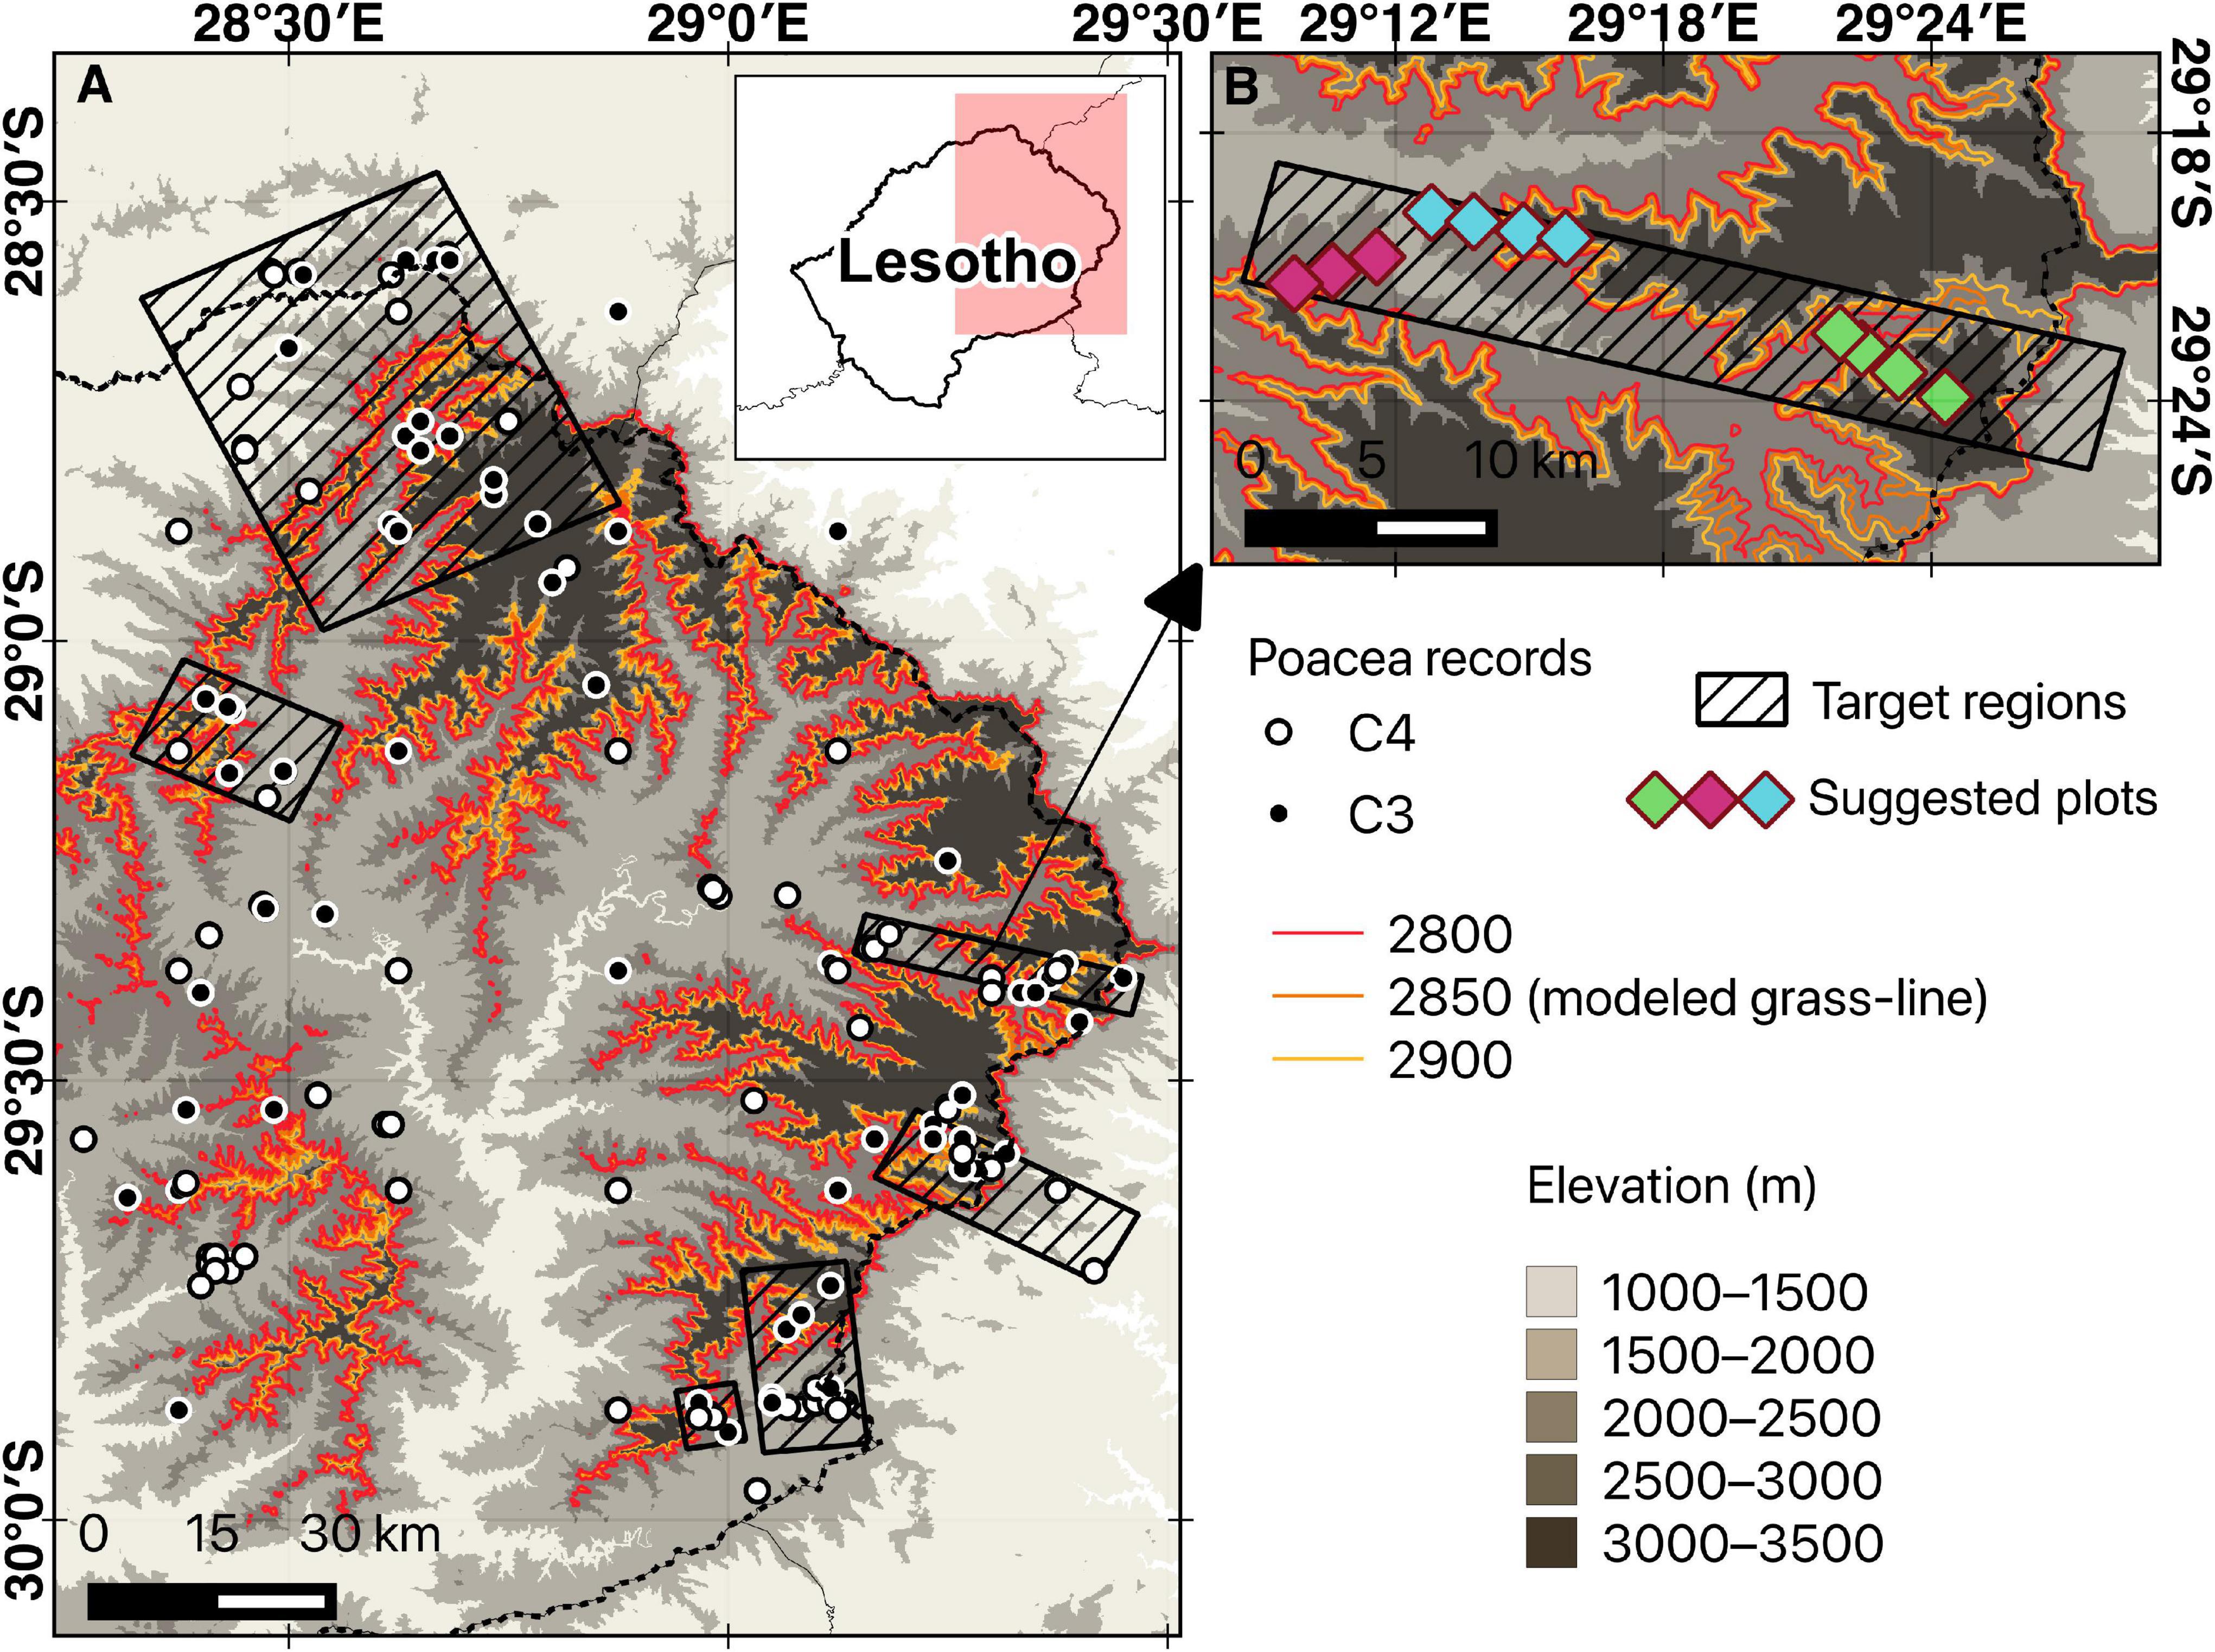
Figure 5. Example of site selection for grass-line large and small plots using the Maloti-Drakensberg as a point in case.
The grass-line is complementary to monitoring the elevational limits of individual species, but it is preferred since it provides a generalized approach. It uses a functional/physiological metric that is less affected by, for example, non-thermal distributional boundaries of native species which may be limited to specific geologies or soil moisture levels and will not respond to changes in temperature; or the establishment of alien species, which may cause big changes in species composition, but are unrelated to changes in climate. The grass-line offers the same advantage as (other) functional trait approaches—it allows us to compare areas irrespective of species composition, using a functional/physiological metric that has direct ecological relevance.
Under changing environmental conditions we expect to see some degree of idiosyncrasy in the responses of individual species, and using a “community-level” metric will provide a better indicator of how the ecosystem is changing. As in tree-line studies, “grass-line” ecotone behavior is best monitored through tracking the growth and movement of C3 and C3 genera/species in fixed plots, resampled at intervals. A similar protocol is the Mountain Invasion Research Network (MIREN) that determines the behavior of non-native species in mountains. By designing a protocol that can be replicated across the grass-line ecotone, and repeatedly sampled at temporal intervals we can determine the behavior of the grass-line on a large scale.
Future Climatic Scenarios Impact on This Composition Shift and the Importance of a Grass Focused Protocol
The social-ecological impacts of shifts in the C3-C4 “grass-line” on culture, livelihoods, and rangeland-dependent food security will be likely considerable, and will require major adaptations in both (1) fire management—given that higher temperatures favor fire-prone C4 grasses over fire-retarding C3 grasses (Clark et al., 2009)—and (2) grazing governance—as natural pasture palatability will change in response to grass community changes; grazing management will need to adapt accordingly to become sustainable (Clark et al., 2009). The currently available evidence is not conclusive about quantitative implications of the C4 to C3 shifts in the cascading ecological effects of this community transition and its net impact on herbivores (Chamaillé-Jammes and Bond, 2010). Therefore, developing a protocol monitoring grassland community shifts in C3-C4 generic composition offers a valuable tool to quantify and to identify sites where this shift may occur. Moreover, monitoring “grass-line” boundaries can clarify the real impacts of regional community changes in phenology, digestibility, and productivity, since they may vary substantially between C3 and C4 grasses, and these traits are likely to affect the diets of large mammalian herbivores (Ehleringer et al., 2002). Among these groups, productivity is also a complex function influenced by multiple environmental conditions (e.g., daytime growing season temperature, nitrogen, water, carbon), making it difficult to establish a generalizable differentiation and to predict precisely expected local changes, reinforcing the necessity to monitor and measure this shift at regional scales (Chamaillé-Jammes and Bond, 2010). There will likely be both “winners” and “losers” from such changes. For example, longer growing seasons may increase carry capacity in some regions (provided aridity does not also increase), and many C4 grasses may be palatable than C3 grasses (e.g., C4 Themeda over C3 Tenaxia in southern Africa) (Clark et al., 2009) suggesting a switch to more favorable natural pastures. All these peculiarities reinforce the need for monitoring this change in multiple scales across different environments, and the “grass-line” concept provides a suitable protocol for this purpose.
For many of the World’s mountains there is evidence that sustained increases in temperature over the past century and land-use related disturbances have promoted upward elevation shifts in the tree-line (Ameztegui et al., 2016; Cazzolla Gatti et al., 2019) as well as increasing incidence of “lowland” taxa at novel higher elevations, with standardized global protocols being used to track these ecological responses (Grabherr et al., 2000; Naccarella et al., 2020). Historical compositional shift datasets are available to many temperature mountains (mostly in western Europe), and they provide important evidences of how climate change is affecting mountains biodiversity and how conservation efforts can be directed to mitigate these impacts (Steinbauer et al., 2018). At present, there are no comparable data for grassy mountain systems, especially in the southern hemisphere. We suggest that a common global protocol to monitor the C3-C4 “grass-line” in grassy mountain systems may provide equivalent data for tracking change and providing scientific support for climate adaptation programs in such mountains.
Data Availability Statement
The datasets are available as Supplementary Material.
Author Contributions
JD developed the methodology, collected and analyzed the data, prepared the figures, developed the protocol, and wrote the foundation manuscript and supplementary data. PR provided the data, developed the protocol, and assisted with constructing the body text. SJ assisted with data analysis and figures, and edited the manuscript. MB assisted on the discussion of the results, developed the protocol, and edited the manuscript. VC conceived the study, collected and provided field data, assisted with constructing the body text, and provided project leadership. All authors contributed to the article and approved the submitted version.
Funding
The development of this manuscript was supported by a University of the Free State (UFS) post-doctoral research fellowship to JD through the Afromontane Research Unit in 2019. This project was also funded by Coordenação de Aperfei oamento de Pessoal de N vel Superior, under the project 88887.136423/2017-00-465420/2014-1-INCT Virtual da Flora e dos Fungos (Grant No. 88887.644102/2021-00), and by Conselho Nacional de Desenvolvimento Cient fico e Tecnológico (Grant No. 153973/2018-8) in the form of two Postdoctoral Fellowships to JD.
Conflict of Interest
The authors declare that the research was conducted in the absence of any commercial or financial relationships that could be construed as a potential conflict of interest.
Publisher’s Note
All claims expressed in this article are solely those of the authors and do not necessarily represent those of their affiliated organizations, or those of the publisher, the editors and the reviewers. Any product that may be evaluated in this article, or claim that may be made by its manufacturer, is not guaranteed or endorsed by the publisher.
Acknowledgments
We acknowledge the University of the Free State for providing a postdoctoral fellowship to JD and the editors and reviewers for their time and consideration of this manuscript. We also thank Graham Baker, Peter Linder, and William Bond for providing feedback on the development of this research.
Supplementary Material
The Supplementary Material for this article can be found online at: https://www.frontiersin.org/articles/10.3389/fevo.2021.760118/full#supplementary-material
Footnotes
References
Adie, H., Kotze, D., and Lawes, M. (2017). Small fire refugia in the grassy matrix and the persistence of Afrotemperate forest in the Drakensberg mountains. Sci. Rep. 7:6549. doi: 10.1038/s41598-017-06747-2
Ameztegui, A., Coll, L., Brotons, L., and Ninot, J. (2016). Land-use legacies rather than climate change are driving the recent upward shift of the mountain tree line in the Pyrenees. Glob. Ecol. Biogeogr. 25, 263–273. doi: 10.1111/geb.12407
Bremond, L., Boom, A., and Favier, C. (2012). Neotropical C3/C4 grass distributions—present, past and future. Glob. Chang. Biol. 18, 1–11.
Cabido, M., Ateca, N., Astegiano, M., and Anton, A. (1997). Distribution of C3 and C4 grasses along an altitudinal gradient in central Argentina. J. Biogeogr. 24, 197–204. doi: 10.1046/j.1365-2699.1997.00085.x
Carbutt, C. (2019). The Drakensberg mountain centre: a necessary revision of southern Africa’s high-elevation centre of plant endemism. South African J. Bot. 124, 508–529. doi: 10.1016/j.sajb.2019.05.032
Cazzolla Gatti, R., Callaghan, T., Velichevskaya, A., Dudko, A., Fabbio, L., Battipaglia, G., et al. (2019). Accelerating upward treeline shift in the Altai mountains under last-century climate change. Sci. Rep. 9:7678. doi: 10.1038/s41598-019-44188-1
Chamaillé-Jammes, S., and Bond, W. J. (2010). Will global change improve grazing quality of grasslands? A call for a deeper understanding of the effects of shifts from C4 to C3 grasses for large herbivores. Oikos 119, 1857–1861. doi: 10.1111/j.1600-0706.2010.19070.x
Clark, V., Barker, N., and Mucina, L. (2009). The sneeuberg: a new centre of floristic endemism on the Great Escarpment, South Africa. South African J. Bot. 75, 196–238. doi: 10.1016/j.sajb.2008.10.010
Clark, V., Barker, N., and Mucina, L. (2011). The Great Escarpment of southern Africa: a new frontier for biodiversity exploration. Biodivers. Conserv. 20, 2543–2561. doi: 10.1007/s10531-011-0103-3
Collatz, G., Berry, J., and Clark, J. (1998). Effects of climate and atmospheric CO2 partial pressure on the global distribution of C4 grasses: present, past, and future. Oecologia 114, 441–454. doi: 10.1007/s004420050468
Dirnböck, T., Essl, F., and Rabitsch, W. (2011). Disproportional risk for habitat loss of high-altitude endemic species under climate change. Glob. Chang. Biol. 17, 990–996. doi: 10.1111/j.1365-2486.2010.02266.x
Dixon, A. P., Faber-Langendoen, D., Josse, C., Morrison, J., and Loucks, C. J. (2014). Distribution mapping of world grassland types. J. Biogeogr. 41, 2003–2019. doi: 10.1111/jbi.12381
Edwards, E., Osborne, C., Stromberg, C., Smith, S., Bond, W., Christin, P., et al. (2010). The origins of C4 grasslands: integrating evolutionary and ecosystem science. Science 328, 587–591. doi: 10.1126/science.1177216
Edwards, E., and Still, C. (2008). Climate, phylogeny and the ecological distribution of C4 grasses. Ecol. Lett. 11, 266–276. doi: 10.1111/j.1461-0248.2007.01144.x
Ehleringer, J., Cerling, T., and Helliker, B. (1997). C4 photosynthesis, atmospheric CO2, and climate. Oecologia 112, 285–299.
Ehleringer, J. R., Cerling, T. E., and Dearing, M. D. (2002). Atmospheric CO2 as a global change driver influencing plant-animal interactions. Integr. Comp. Biol. 42, 424–430. doi: 10.1093/icb/42.3.424
Fick, S., and Hijmans, R. (2017). WorldClim 2: new 1-km spatial resolution climate surfaces for global land areas. Int. J. Climatol. 37, 4302–4315. doi: 10.1002/joc.5086
Fish, L., Mashau, A., Moeaha, M., and Nembudani, M. (2015). Identification Guide to Southern African grasses. An Identification Manual with Keys, Descriptions and Distributions. Pretoria: South African National Biodiversity Institute.
Giraldo-Canas, D. (2010). Distribution and invasion of C3 and C4 grasses (Poaceae) along an altitudinal gradient in the Andes of Colombia. Caldasia 32, 65–86.
Grabherr, G., Gottfried, M., and Pauli, H. (2000). GLORIA: a global observation research initiative in alpine environments. Mt. Res. Dev. 20, 190–191. doi: 10.1659/0276-4741(2000)020[0190:gagori]2.0.co;2
Hijmans, R. (2021). raster: Geographic Data Analysis and Modeling. R Package Version 3.5-2. Available online at: https://CRAN.R-project.org/package=raster
Hock, R., Rasul, G., Adler, C., Cáceres, B., Gruber, S., Hirabayashi, Y., et al. (2019). “High mountain areas,” in IPCC Special Report on the Ocean and Cryosphere in a Changing Climate, eds H. -O. Pörtner, D. C. Roberts, V. Masson-Delmotte, P. Zhai, M. Tignor, E. Poloczanska, et al. (Geneva: Intergovernmental Panel on Climate Change).
Körner, C. (2003). “Alpine treelines,” in Alpine Plant Life: Functional Plant Ecology of High Mountain Ecosystems, (Berlin: Springer), 349. doi: 10.1007/978-3-642-18970-8_7
Körner, C. (2012). Treeline Formation—Currently, in the Past and in the Future, 169–180, in Alpine Treelines. Basel: Springer Basel, 1–220.
Latham, J., Cumani, R., Rosati, I., and Bloise, M. (2014). Global Land Cover Share (GLC-SHARE) Database Beta-Release Version 1.0-2014. Rome: FAO.
Lavorel, S., Grigulis, K., Lamarque, P., Colace, M., Garden, D., Girel, J., et al. (2011). Using plant functional traits to understand the landscape distribution of multiple ecosystem services. J. Ecol. 99, 135–147. doi: 10.1111/j.1365-2745.2010.01753.x
Maurer, K., Weyand, A., Fischer, M., and Stöcklin, J. (2006). Old cultural traditions, in addition to land use and topography, are shaping plant diversity of grasslands in the Alps. Biol. Conserv. 130, 438–446. doi: 10.1016/j.biocon.2006.01.005
Mucina, L., and Rutherford, M. (2006). The Vegetation of South Africa, Lesotho and Swaziland. Pretoria: South African National Biodiversity Institute.
Naccarella, A., Morgan, J., Cutler, S., and Venn, S. (2020). Alpine treeline ecotone stasis in the face of recent climate change and disturbance by fire. PLoS One. 15:e0231339. doi: 10.1371/journal.pone.0231339
Osborne, C. (2008). Atmosphere, ecology and evolution: what drove the Miocene expansion of C4 grasslands? J. Ecol. 96, 35–45. doi: 10.1111/j.1365-2745.2007.01323.x
Osborne, C., Salomaa, A., Kluyver, T., Visser, V., Kellogg, E., Morrone, O., et al. (2014). A global database of C4 photosynthesis in grasses. New Phytol. 204, 441–446.
Parr, C., Lehmann, C., Bond, W., Hoffmann, W., and Andersen, A. (2014). Tropical grassy biomes: misunderstood, neglected, and under threat. Trends Ecol. Evol. 29, 205–213. doi: 10.1016/j.tree.2014.02.004
Paulsen, J., and Körner, C. (2014). A climate-based model to predict potential treeline position around the globe. Alp. Bot. 124, 1–12. doi: 10.1007/s00035-014-0124-0
R Core Team (2020). R: A Language and Environment for Statistical Computing. Vienna: R Foundation for Statistical Computing.
Rahbek, C., Borregaard, M., Colwell, R., Dalsgaard, B., Holt, B., Morueta-Holme, N., et al. (2019a). Humboldt’s enigma: what causes global patterns of mountain biodiversity? Science 365, 1108–1113. doi: 10.1126/science.aax0149
Rahbek, C., Borregaard, M., Hermansen, B., Nogués-Bravo, D., and Fjeldså, J. (2019b). Mountain Regions of the World. Available online at: https://macroecology.ku.dk/resources/Mountain_Regions. (accessed October 15, 2021).
Sage, R. (2001). Environmental and evolutionary preconditions for the origin and diversification of the C4 photosynthetic syndrome. Plant Biol. 3, 202–213. doi: 10.1055/s-2001-15206
Sage, R., and Coleman, J. (2001). Effects of low atmospheric CO2 on plants: more than a thing of the past. Trends Plant Sci. 6, 18–24. doi: 10.1016/s1360-1385(00)01813-6
Sage, R. F., and Kubien, D. S. (2007). The temperature response of C3 and C4 photosynthesis. Plant Cell Environ. 30, 1086–1106. doi: 10.1111/j.1365-3040.2007.01682.x
Sage, R., Monson, R., Ehleringer, J., Adachi, S., and Pearcy, R. (2018). Some like it hot: the physiological ecology of C4 plant evolution. Oecologia 187, 941–966. doi: 10.1007/s00442-018-4191-6
Scherrer, D., and Köerner, C. (2010). Infra-red thermometry of alpine landscapes challenges climatic warming projections. Glob. Change Biol. 16, 2602–2613. doi: 10.1111/j.1365-2486.2009.02122.x
Scherrer, D., and Körner, C. (2011). Topographically controlled thermal-habitat differentiation buffers alpine plant diversity against climate warming. J. Biogeogr. 38, 406–416. doi: 10.1111/j.1365-2699.2010.02407.x
Shoko, C., Mutanga, O., and Dube, T. (2016). Progress in the remote sensing of C3 and C4 grass species aboveground biomass over time and space. ISPRS J. Photogramm. Remote Sens. 120, 13–24.
Steinbauer, M., Grytnes, J.-A., Jurasinski, G., Kulonen, A., Lenoir, J., Pauli, H., et al. (2018). Accelerated increase in plant species richness on mountain summits is linked to warming. Nature 556:231. doi: 10.1038/s41586-018-0005-6
Sylvester, S., Heitkamp, F., Sylvester, M., Jungkunst, H., Sipman, H., Toivonen, J., et al. (2017). Relict high-Andean ecosystems challenge our concepts of naturalness and human impact. Sci. Rep. 7:3334. doi: 10.1038/s41598-017-03500-7
Tieszen, L., Senyimba, M., Imbamba, S., and Troughton, J. (1979). The distribution of C3 and C4 grasses and carbon isotope discrimination along an altitudinal and moisture gradient in Kenya. Oecologia 37, 337–350. doi: 10.1007/BF00347910
Van Wyk, A., and Smith, G. (2001). Regions of Floristic Endemism in Southern Africa: A Review With Emphasis on Succulents. Cleckheaton: Umdaus press.
Veldman, J., Overbeck, G., Negreiros, D., Mahy, G., Le Stradic, S., Fernandes, G., et al. (2015). Tyranny of trees in grassy biomes. Science 347, 484–485. doi: 10.1126/science.347.6221.484-c
Woodward, F., Lomas, M., and Kelly, C. (2004). Global climate and the distribution of plant biomes. Philos. Trans. R. Soc. B Biol. Sci. 359, 1465–1476. doi: 10.1098/rstb.2004.1525
Keywords: taxonomic diversity, photosynthesis, mountain ecology, environmental gradients, climate change, community shift, Poaceae (=Gramineae)
Citation: de Deus Vidal J Jr, le Roux PC, Johnson SD, te Beest M and Clark VR (2021) Beyond the Tree-Line: The C3-C4 “Grass-Line” Can Track Global Change in the World’s Grassy Mountain Systems. Front. Ecol. Evol. 9:760118. doi: 10.3389/fevo.2021.760118
Received: 17 August 2021; Accepted: 08 November 2021;
Published: 07 December 2021.
Edited by:
Albertus J. Smit, University of the Western Cape, South AfricaReviewed by:
Anna Mária Csergõ, Hungarian University of Agriculture and Life Sciences, HungaryDaniel Scherrer, Swiss Federal Institute for Forest, Snow and Landscape Research (WSL), Switzerland
Copyright © 2021 de Deus Vidal, le Roux, Johnson, te Beest and Clark. This is an open-access article distributed under the terms of the Creative Commons Attribution License (CC BY). The use, distribution or reproduction in other forums is permitted, provided the original author(s) and the copyright owner(s) are credited and that the original publication in this journal is cited, in accordance with accepted academic practice. No use, distribution or reproduction is permitted which does not comply with these terms.
*Correspondence: João de Deus Vidal Jr., jd.vidal@unesp.br